R E S E A R C H A R T I C L E
Open Access
An application of restricted mean survival
time in a competing risks setting:
comparing time to ART initiation by
injection drug use
Keri L. Calkins
1*†, Chelsea E. Canan
1†, Richard D. Moore
1,2, Catherine R. Lesko
1and Bryan Lau
1,2Abstract
Background:Restricted mean survival time (RMST) is an underutilized estimand in time-to-event analyses. Herein, we highlight its strengths by comparing time to (1) all-cause mortality and (2) initiation of antiretroviral therapy (ART) for HIV-infected persons who inject drugs (PWID) and persons who do not inject drugs.
Methods:RMST to death was determined by integrating the Kaplan-Meier survival curve to 5 years of follow-up. To account for the competing risks of death and loss-to-clinic when estimating time to ART, we calculated RMST to ART initiation by estimating the area between the survival curve for ART initiation and the cumulative incidence curve for death or loss-to-clinic. We standardized all curves using inverse probability of exposure weights. Results:We followed 3044 HIV-positive, ART-naive persons from enrollment into the Johns Hopkins HIV Clinical Cohort from 1996 to 2014. PWID had a−0.19 year (95% confidence interval (CI):−0.29,−0.10) difference in survival over 5 years of follow-up compared to persons who did not inject drugs. There was no difference between the two groups in time not on ART while alive and in clinic (RMST difference = 0.08, 95% CI: -0.10, 0.36).
Conclusions:PWID have similar expected time to ART initiation after properly accounting for their greater risk of death and loss-to-clinic.
Keywords:Survival analysis, Competing risks, Restricted mean survival time, HIV, Injection drug use, Antiretroviral therapy
Background
Describing the occurrence of an event (or events) over time is central to epidemiological research. There are several estimands that can be used to summarize the occurrence of an event, such as providing survival or risk estimands for specific periods of time (e.g. 1-year survival or 5-year risk). (Note: we are using the term “survival”here to denote an event-free state, where the event is not constrained to be death.) The occurrence of an event in two or more groups is often compared using a risk difference, risk ratio, or hazard ratio [1–7]. In this paper we highlight restricted mean survival time (RMST) as an alternative estimand for
the analysis of time-to-event data. RMST has attractive properties, namely it: 1) does not require the assumption of proportional hazards; 2) can summarize the difference in survival when survival curves initially diverge and later con-verge; and 3) provides information about absolute risk. RMST is calculated by integrating the survival function from the origin to some time t, and is interpreted as the average survival time within that interval [8–10]. Despite its attractive properties, epidemiological studies utilizing RMST remain rare [11–14], particularly in an observational setting (which would require adjustment of RMST for po-tential confounding), or in the presence of competing risks (events that preclude the event of interest from occurring).
The first objective of this paper is to promote the use of the RMST in the epidemiology and medical literature by briefly reviewing its calculation, interpretation, strengths, and limitations. The second objective is to detail an approach to
* Correspondence:[email protected]
†Equal contributors
1Department of Epidemiology, Johns Hopkins Bloomberg School of Public Health, 615 N Wolfe St, Baltimore, MD 21205, USA
Full list of author information is available at the end of the article
standardize the RMST to account for confounding in the setting of competing events using inverse probability weight-ing. We illustrate estimation of the adjusted RMST to de-scribe time to death in an HIV clinical cohort among persons with and without a history of injection drug use (IDU) as a risk factor for HIV acquisition. We further illustrate use of RMST to compare time to initiation of antiretroviral therapy (ART) among persons who inject drugs (PWID) and persons who did not inject drugs, prop-erly accounting for persons who experienced a competing event (death or loss-to-clinic).
Methods
The definite integral of the survival curve from the time origin to some specified follow-up timet, wheret is less than or equal to the maximum observed follow-up time, provides an estimate of the expected event-free time from 0 tot[15]. The area under the survival curve,A(t) is also known as the RMST. This is in contrast to the marginal expected survival time, which is only estimable (without extrapolation) when the survival curve goes to zero during the observation time [16]. The“restricted”component of the mean survival calculation avoids extrapolating the in-tegration beyond the last observed time point. A particular strength of RMST is the ease of interpretation. The differ-ence in the area under two survival curves A1(t)–A2(t) can be interpreted as the extension (or contraction) of the expected (mean) survival time by time t associated with membership in group 1 or with treatment 1, as compared to group 2 or treatment 2. One could easily take the ratio rather than the difference.
Statistical methods
RMST, which was originally proposed by Irwin [8] and later adapted by Kaplan and Meier [17] is defined by [18]:
A tð Þ ¼E½minðT;tÞ ¼ Z t
0 S t
ð Þdt ð1Þ
whereTis the time to the event of interest,t∗is the point in time to which RMST is being calculated between 0 and the maximum follow-up, and S(t) is the survival function over time t. S(t) can be estimated using a variety of methods, i.e. non-parametrically, semi-parametrically, or parametrically. We follow convention and represent ran-dom variables with capital letters and possible realizations of those random variables with lowercase letters. Challenges in estimating RMST include: 1) deciding how to estimate the functionS(t); 2) adjusting for confounders; and 3) estimating the integralR0tSðtÞdt.
We focus on the estimation of S(t) using a step func-tion, specifically, the Kaplan-Meier survival function. The use of a step function allows for a simple integra-tion of the survival funcintegra-tion to time t by summing the
area under each rectangular step of the survival curve (i.e., a Reimann sum) [10]:
^
A tð Þ ¼Xk^S tð k−1Þðtk−tk−1Þ ð2Þ
wheretkare the ordered event times observed over (0,t∗]
andt∗is included in the set oftk, t0= 0,^SðtÞis the survival
estimate, and by definition^Sðt0Þ ¼1. We can interpretA^ð tÞ as the restricted mean time spent event-free through timet. Conversely, the integral over (0,t∗] of the comple-ment of the survival function, F(t) = 1−S(t), which is the cumulative incidence function (CIF) is the expected time after having the event through timet∗[19].
There are several options for generating covariate-adjusted curves to account for confounding or non-random censoring [20]. Here we detail how to obtain standardized survival curves using inverse probability weighting. Inverse probability weighting has several attractive properties com-pared to other methods for generating covariate-adjusted curves, namely that it produces survival curves that are marginalized over the distribution of covariates in the study sample rather than requiring a covariate profile be specified and is straightforward to implement [21,22]. Inverse prob-ability weighting is an extension of direct standardization [23] and it has been shown that a weighted Kaplan-Meier estimator can provide an unbiased estimate for an adjusted survival curve using an inverse probability weighted hazard function [22]. We define an individual’s weight as W^i
¼PdðXiÞ=PðdXijZiÞ, whereZis set of covariates sufficient to satisfy the assumption of conditional exchangeability be-tween two groups,X= 1 andX= 0. We suggest incorporat-ing causal knowledge and relyincorporat-ing on causal diagrams to identify a sufficient set of covariates to satisfy this assump-tion [24]. Note that we stabilized the weights by the mar-ginal probability of exposure, but non-stabilized weights are also possible. Other assumptions are necessary to interpret contrasts between RMST forX=xcausally, but a full dis-cussion of causal inference is beyond scope of this paper; see [23,25,26] for more details. Briefly, one sufficient set of assumptions includes, in addition to assuming conditional exchangeability between the exposed and unexposed: 1) positivity (everyone has a non-zero probability of being ex-posed) [27,28]; 2) treatment version irrelevance [29–31]; 3) no interference (one person’s exposure does not affect an-other’s outcome) [32, 33]; 4) no measurement error [26, 34]; and 5) correct model(s) specification.
inverse probability weighted CIF for event type j can be estimated [6]:
^
Fjð Þ ¼t
X
tk≤t ^
SW t^ð Þðtk−1Þ
dW tj^ð Þð Þtk
nW t^ð Þ t k
ð Þ
2 4
3
5 ð3Þ
where the overall inverse probability weighted survival
func-tion is S^W^ðtÞðtÞ ¼ expf−X
tk≤t
dW^ðtÞðtkÞ=nW^ðtÞðtkÞg ,
dWj^ðtÞand nW^ðtÞðtkÞ are the inverse probability weighted
number of events of typejand number of individuals at risk,
respectively, at timet[6].d
^
WðtÞ j ðtkÞ
nW^ðtÞðtkÞ
is the cause-specific
haz-ard ratio at timetk. The complement of the CIF provides the
survival function for thejth event,Sj(t) = 1−Fj(t). The lowest
value^SjðtÞmay attain is bounded by the sum of the cumula-tive incidences of the competing events, i.e., PJ≠j^FJðtÞ,
since^FjðtÞ þ
X
J≠j
^
FJðtÞ þ^S
^
WðtÞð tÞ ¼1.
Integration of Fj(t) orSj(t) over [0,t∗] provides the ex-pected time after the occurrence of event j through t∗ and the expected time prior to the occurrence of eventj throught∗, respectively. Note the interpretation of these integrals remains the same even if an individual experi-ences a competing event prior to t∗. For example, if the event of interestjis initiation of ART and the competing event is death, then the integration of Sj(t) over [0,t∗] would be interpreted as the expected time prior to ART through t∗, even if the individual died before initiating ART. Similarly, the integration ofFj(t) over [0,t∗] would be interpreted as the expected time after ART initiation throught∗even if the individual dies following ART ini-tiation but prior tot∗. The restricted mean lifetime spent in a state free of all events, including the event of inter-est and competing events, can be calculated by taking the difference in the integration of the complement of the CIF from the jth event and the integration of the CIF of all other events. Therefore this estimand is:
Z t
0
SJ¼jð Þt dt− Z t
0 X
J≠jFJð Þt dt¼AJ¼jð Þt −LJ≠jð Þt ð4Þ
whereAJ¼jðtÞ ¼
Rt
0 1−FJ¼jðtÞdt is the expected survival
time to the jth event and LJ≠jðtÞ ¼
Rt
0 FJ≠jðtÞdt is the
expected time spent in all non-jevents (i.e. the compet-ing events). That is, the area under the CIF for eventjis the expected time after having event j, therefore the in-tegral of the complement,AJ=j(t), corresponds to the
ex-pected time remaining in a state free of the jth event. However, this includes being in a non-jevent state. Be-cause we are interested in time spent free of all events,
the expected time spent in the non-jevents states needs to be removed and is provided in Eq. 4.FJ=j(t) andFJ≠
j(t) can be estimated using Eq. 3, where the event type
can either be the event of interest,jor the composite of the competing events.
Application
Despite demonstrated success of combination ART on re-duced morbidity, mortality, and HIV transmission risk [35, 36], many populations experience significant barriers to and delays in the initiation of ART. PWID consistently experience delayed treatment and lower rates of viral sup-pression [37–41]. To demonstrate how RMST can provide further insight into these disparities, we describe 1) time to all-cause mortality and 2) time to ART initiation among a cohort of persons engaged in HIV clinical care, stratify-ing by report of IDU as an HIV acquisition risk factor. We begin by examining all-cause mortality because we antici-pate mortality to be an important competing event for ART initiation and to serve as an example of the imple-mentation of the use of inverse probability-weighted RMST in a setting with no competing events.
We followed individuals who enrolled in continuity HIV care at the Johns Hopkins Moore Clinic for HIV Care from 1994 to 2014, who consented to share their medical record data with the Johns Hopkins HIV Clinical Cohort (> 90% of patients) and who had not yet initiated ART. When analyz-ing time to all-cause mortality, patients were followed from cohort enrollment until death, 5 years of follow-up or ad-ministrative censoring in June 2014. Date of death was ascer-tained through periodic matches against the National Death Index and the Social Security Death Index, so patients would not have to return to clinic in order to have their date of death measured and there are no competing events. While ART initiation impacts all-cause mortality, it is on the causal pathway between injection drug use and mortality; because this analysis focuses on the total effect of history of injection drug use on mortality, we do not account for ART.
When analyzing time to ART initiation, patients were followed from clinic enrollment until ART initiation (defined as the initiation of a three-drug regimen on a single day), loss-to-clinic (defined as the date on which a patient has gone one year without a CD4 or HIV RNA measurement or a clinic visit), death, or 5 years of follow-up or administrative censoring in June 2014. Patients must be under clinical care in order to receive treatment. In this analysis, we assume that patients only receive ART through our clinic. Therefore, patients must return to clinic for the outcome to occur. By definition, we can never observe ART initiation among pa-tients who die or drop out of clinical care (loss-to-clinic) prior to ART initiation; thus we consider death and loss-to-clinic to be competing events in this analysis.
RNA level, 18 missing CD4, 234 missing HIV RNA). The final analytic sample contained 3044 patients.
We generated stabilized inverse probability of exposure weights to standardize the Kaplan-Meier survival curves for all analyses. The denominators of the weights were estimated using predicted probabilities from a logistic regression model for IDU as an HIV acquisition risk factor conditional on the following baseline characteristics: sex, race, prior AIDS diag-nosis, prior mono- or dual-antiretroviral therapy, age, CD4 cell count and log10HIV RNA level. The numerators of the weights were the marginal probability of being in the expos-ure group that was observed for that individual. Baseline co-variate values were those measured closest to enrollment date within a window of 6 months before to 6 months after enrollment and prior to ART initiation. Continuous covari-ates were modeled with basis cubic splines [42].
When analyzing time to ART initiation we generated two sets of curves for PWID and persons who did not inject drugs: 1) the inverse probability weighted CIF for time to ART initiation based on Eq. 3 (weights were as defined above); and 2) the inverse probability weighted cause-specific CIF for a composite event defined as death or loss-to-clinic. Because death and loss-to-clinic preclude the occurrence and/or observation of ART initiation, we treat these two events as competing events [43]. We present the expected time not on ART while alive and enrolled in the clinic which is,A^J¼ART initiationðtÞ−^LJ≠ART initiationðtÞ, whereA^J¼ART initiation
ðtÞis the area under the survival curve for time to ART initi-ation and ^LJ≠ART initiationðtÞ is the area under the CIF for death or loss-to-clinic prior to ART initiation.
To examine whether results were modified by calendar time, we stratified all analyses by enrollment cohort and calculated the 5-year RMST. Enrollment cohorts were loosely defined by changes to ART initiation guidelines (1996–2001, 2002–2007, 2008–2014). We selected 5 years as the time point in which to calculate the RMST (t*) be-cause of our stratified analysis by enrollment cohort. The most recent enrollment cohorts would have a maximum 5.5 years of follow-up prior to administrative censoring in June 2014. Furthermore, the majority of ART initiation events are likely to occur within 5 years of clinical enroll-ment, so RMST differences in ART initiation are unlikely to change significantly after 5 years. For all estimates, we calculated 95% confidence intervals (CI) using the 2.5th and 97.5th percentiles of 10,000 non-parametric bootstrap estimates based on unrestricted random samples from the original data [44]. All analyses were conducted using R version 3.3.1 [45]. Sample R code for calculating RMST with competing risks is provided in Additional file1.
Results
Of the 3044 patients included in the time to ART analysis a majority were male (65.2%) and non-Hispanic Black (77.2%).
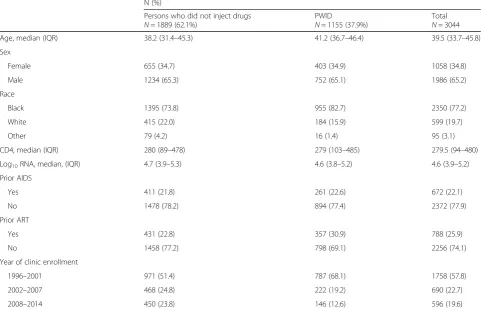
At clinic enrollment, the median age was 39 years (interquar-tile range (IQR) = 33–45 years), 22.1% of patients had a prior AIDS diagnosis and 25.9% had received prior mono- or dual-antiretroviral therapy. The baseline median CD4 cell count was 279 (IQR = 94–480) cells/μL and the baseline median log10HIV RNA was 4.6 (IQR = 3.9–5.3) copies/mL. Overall, 1155 (37.9%) of the patients were PWID. PWID were older, more likely to be black, more likely to have re-ceived prior mono-or dual-antiretroviral therapy, and more likely to enroll in care prior to 2002 (Table1).
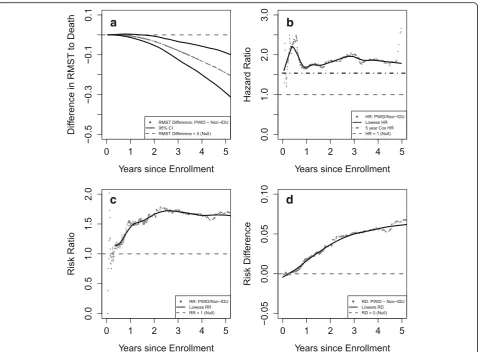
All-cause mortality was higher among PWID compared to persons who did not inject drugs, emphasizing the import-ance of accounting for death as a competing risk when examining time to ART initiation. The 5-year RMST to death was 4.51 years for PWID and 4.70 years for people who did not inject drugs. In other words, in the first 5 years following clinic enrollment, PWID spend an average of 4.51 years alive and people who do not inject drugs spend an average of 4.70 years alive. The difference in restricted mean survival between PWID and people who did not inject drugs was −0.19 years (95% CI: -0.29,−0.09). Panel A of Fig. 1 shows the difference in RMST to all-cause mortality compar-ing PWID and persons who did not inject drugs between 0 and 5 years after clinic enrollment. There is a near zero difference in expected time to death between PWID and persons who did not inject drugs until approximately 2 years after clinic enrollment. Following two years of follow-up, PWID begin to experience a shorter time to all-cause mor-tality than people who did not inject drugs, resulting in an increasingly negative difference in RMST over time.
Figure1 shows the relationship between PWID and all cause mortality for the RMST as well as three of the most common estimands: the hazard ratio (HR), the risk ratio (RR), and the risk difference (RD). The RR and RD were calculated using the Kaplan-Meier estimates for the survival function. As stated above, PWID experience an increasingly shorter time to death after 2 years of clinic enrollment based on the RMST. The HR is a more variable measure but for the majority of time points at which an event occurs, the hazard of all-cause mortality is higher among PWID and the HR estimated from the Cox model is 1.54 (Fig. 1, panel B). The RR is approxi-mately 1 (Fig.1, panel C) and the RD is approximately 0 (Fig. 1, panel D) for a few months after enrollment be-fore increasing. Overall the four different effect estimates indicate an increased all-cause mortality for PWID com-pared to patients who do not inject drugs.
drugs is−0.15 years (95% CI: -0.27,−0.02) for those en-tering care between 1996 and 2001, −0.35 years (95% CI: -0.64, -0.05) for those entering care between 2002 and 2007, and−0.30 years (95% CI: -0.53, 0.01) for those entering care between 2008 and 2014.
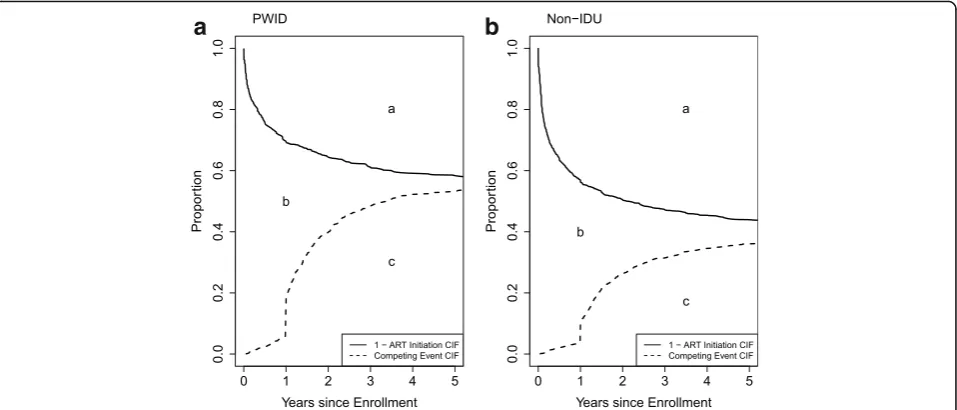
Figure2 shows the CIF for death or loss-to-clinic and the complement of the CIF for ART initiation by history of IDU. These curves depict the restricted mean time after ART initiation (Fig. 2, area ‘a’) and the restricted mean time after the competing events of mortality and loss-to-clinic (Fig. 2, area ‘c’). Area ‘b’, the 5-year re-stricted mean time spent not on ART while alive and retained in the clinic was 1.51 years (95% CI: 1.44, 1.87) for PWID and 1.43 years (95% CI: 1.37, 1.64) for persons who did not inject drugs. PWID experienced a 0.08 year delay (95% CI: -0.10, 0.38) in time to ART initiation compared to persons who did not inject drugs. There was a measurable difference in time spent not on ART while alive and enrolled in clinic for those entering care between 2008 and 2014; the 5-year difference in re-stricted mean time to ART while alive and in clinic was 1.39 years (95% CI: 0.15, 1.98), representing a delay in initiation of ART for PWID as compared to those who did not inject drugs (Table3).
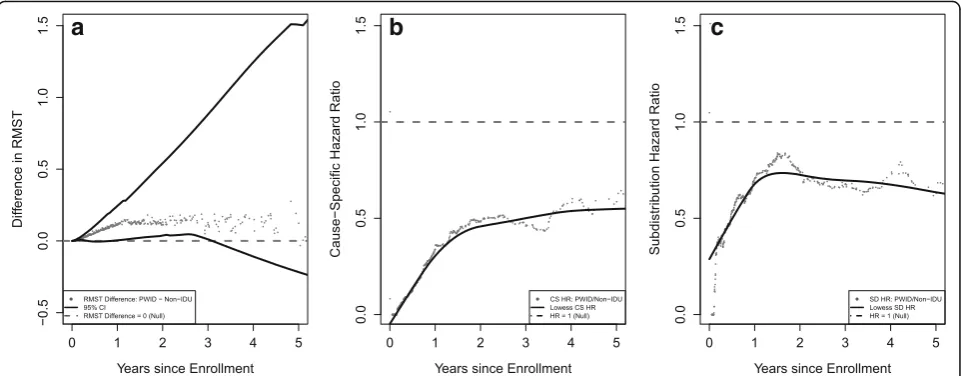
We compare the RMST spent not on ART but alive and in clinic to the cause-specific and subdistribution hazard ratios where ART initiation is the outcome of interest and death or loss-to-clinic is the competing event in Fig. 3. We see that PWID spend a longer time alive and in clinic while not on ART as compared to persons who do not in-ject drugs, and this difference becomes less pronounced as t* increases (Fig. 3, panel A). Both the cause-specific (Fig.3, panel B) and the subdistribution hazard ratios (Fig. 3, panel C) are variable early into follow-up but level off and are consistently below 1. The subdistribution hazard ratio is closer to the null than the cause-specific. The in-ference from both the cause-specific and the subdistribu-tion hazard ratio is that PWID have a lower rate (i.e., cause-specific hazard) and have a lower qualitative risk (i.e., subdistribution hazard) of ART initiation compared to persons who do not inject drugs.
Discussion
Using the restricted mean survival time approach, we evaluated the expected time to all-cause mortality and ART initiation by history of IDU among a cohort of HIV-infected patients receiving treatment in Baltimore, MD. We estimated that, between 1996 and 2014, PWID Table 1Patient baseline characteristics by history of injection drug use
N (%)
Persons who did not inject drugs
N= 1889 (62.1%)
PWID
N= 1155 (37.9%)
Total
N= 3044 Age, median (IQR) 38.2 (31.4–45.3) 41.2 (36.7–46.4) 39.5 (33.7–45.8)
Sex
Female 655 (34.7) 403 (34.9) 1058 (34.8)
Male 1234 (65.3) 752 (65.1) 1986 (65.2)
Race
Black 1395 (73.8) 955 (82.7) 2350 (77.2)
White 415 (22.0) 184 (15.9) 599 (19.7)
Other 79 (4.2) 16 (1.4) 95 (3.1)
CD4, median (IQR) 280 (89–478) 279 (103–485) 279.5 (94–480)
Log10RNA, median, (IQR) 4.7 (3.9–5.3) 4.6 (3.8–5.2) 4.6 (3.9–5.2)
Prior AIDS
Yes 411 (21.8) 261 (22.6) 672 (22.1)
No 1478 (78.2) 894 (77.4) 2372 (77.9)
Prior ART
Yes 431 (22.8) 357 (30.9) 788 (25.9)
No 1458 (77.2) 798 (69.1) 2256 (74.1)
Year of clinic enrollment
1996–2001 971 (51.4) 787 (68.1) 1758 (57.8)
2002–2007 468 (24.8) 222 (19.2) 690 (22.7)
2008–2014 450 (23.8) 146 (12.6) 596 (19.6)
a
b
c
d
Fig. 1The effect of follow-up time on four different effect estimates comparing all-cause mortality by IDU. Panela) displays the standardizedadifference
(with 95% confidence interval) in restricted mean time to all-cause mortality by history of injection drug use over follow-up time. Panelb) displays the standardizedaall-cause hazard ratio (HR) over follow-up time. Panelc) displays the standardizedaall-cause mortality risk ratio (RR) over follow-up time. Panel d) displays the standardizedaall-cause mortality risk difference (RD) over follow-up time.aCurves are standardized to the distribution of sex, race, AIDS diagnosis, prior ART mono- or dual-therapy, age, CD4 cell count, log10HIV viral load, Hepatitis C, history of smoking, and hazardous alcohol use in the total
sample at clinic enrollment using inverse probability of exposure weights.bDashed grey lines represent the null hypothesis (i.e. difference in RMST = 0, HR
= 1, RR = 1, and RD = 0) in each panel.cThe dot-dash black line on panelbis the HR estimated from the Cox Proportional Hazards Model.dThe solid black line on panelsb,c, anddis the lowess smoother to show the overall trend of the estimands.eThe RR and RD is defined asð1−SwPWIDðtÞÞ=ð1−Swnon−PWIDðtÞÞ andð1−SwPWIDðtÞÞ−ð1−Swnon−PWIDðtÞÞ, respectively, whereSw∙ ðtÞis the weighted survival curve
Table 2Standardizeda5-year restricted mean time to all-cause mortality by history of injection drug use
Expected time (years) to All-Cause Mortality
PWID Persons who did not inject drugs Difference
RMST 95% CIb RMST 95% CI RMST 95% CI
All years 4.51 4.42, 4.57 4.70 4.65, 4.74 −0.19 −0.29,−0.09
1996–2001 4.47 4.36, 4.58 4.62 4.54, 4.68 −0.15 −0.27,−0.02
2002–2007 4.45 4.18, 4.71 4.80 4.56, 5.00 −0.35 −0.64,−0.05
2008–2014 4.58 4.36, 4.87 4.88 4.80, 4.97 −0.30 −0.53, 0.01
a
Estimates are standardized to the distribution of sex, race, AIDS diagnosis, prior ART mono- or dual-therapy, age, CD4 cell count, and log10HIV viral load in the
total sample at clinic enrollment using inverse probability of exposure weights
b
had an expected 5-year restricted mean survival that was shorter than people who did not inject drugs by 0.19 years, after standardizing on baseline clinical and demographic covariates. We did not see a difference in time to all-cause mortality after 5 years of follow-up in each era of clinic enrollment, likely due to the relatively few events occurring within 5 years of clinic enrollment. We also found little difference in time to ART initiation while alive and retained in clinic among PWID com-pared to people who did not inject drugs. Other studies that have reported disparities in time to ART initiation among PWID compared to persons who did not inject drugs may not have accounted for death or loss-to-clinic as competing risks explicitly.
This study had several strengths. The sample size was suf-ficiently large to examine trends in time to ART initiation
stratified by enrollment cohort, which is of particular interest because of changing treatment guidelines. We highlighted the novel approach of using inverse probability weighting to standardize the RMST in the setting of competing events. By using inverse probability weights to standardize cohorts of PWID and persons who did not inject drugs to have the same distribution of baseline covariates, we were able to esti-mate restricted mean times to ART initiation that are not confounded by different clinical indications for treatment.
This study also had limitations. Data were collected from a single HIV clinic in an urban academic center and may not be generalizable to other sites. Additionally, we were unable to ascertain whether patients who were lost-to-clinic began treatment at a different clinic. As such, our estimates of time to ART initiation may be biased. Finally, we examined differences in RMST to ART initiation by
a
b
Fig. 2Standardizedacumulative incidence functions (CIF)bfor ART initiation and for the composite competing event, death or loss-to-clinic, for PWID (a) and non-IDU (b).aCurves are standardized to the distribution of sex, race, AIDS diagnosis, prior ART mono- or dual-therapy, age, CD4 cell count and log10HIV RNA level in the total sample at enrollment using inverse probability of exposure weights.
b
Solid line is the standardized 1-CIF (cumulative incidence function) for ART initiation. Dashed line is the CIF for the composite competing event, death or loss-to-clinic. Area“a” is the 5-year restricted mean time after ART initiation;“b”is the 5-year restricted mean time spent not on ART while alive and in clinic;“c”is the 5-year restricted mean time after death or loss-to-clinic
Table 3Standardizeda5-year RMSTbspent not on ART but alive and retained in clinicbby IDU
Expected time (years) to ART initiation
PWID Persons who did not inject drugs Difference
RMST 95% CIc RMST 95% CI RMST 95% CI
All years 1.51 1.44, 1.87 1.43 1.37, 1.64 0.08 −0.10, 0.38
1996–2001 1.61 1.51, 2.25 1.54 1.48, 1.91 0.07 −0.26, 0.67
2002–2007 1.48 1.25, 2.32 1.61 1.26, 2.09 −0.13 −0.82, 0.72
2008–2014 2.87 2.66, 3.52 1.48 1.34, 2.73 1.39 0.15, 1.98
a
Estimates are standardized to the distribution of sex, race, AIDS diagnosis, prior ART mono- or dual-therapy, age, CD4 cell count and log10HIV viral load in the
total sample at clinic enrollment using inverse probability of exposure weights
b
The RMST spent not on ART but Alive and Retained in Clinic refers to the difference of the integration of the 1-CIF for ART initiation minus the CIF for the com-posite of mortality and loss-to-clinic
c
self-reported history of IDU as an HIV acquisition risk fac-tor. History of IDU may be under-reported due to social desirability bias. Furthermore, history of IDU does not correlate perfectly with ongoing IDU and our estimates should not be interpreted as such.
Restricted mean survival time is a useful alternative to the traditional hazard ratio. The use of proportional haz-ards models in the presence of competing risks whether examining the cause-specific or subdistribution HR re-mains subject to the proportionality assumption. Relax-ing the proportional hazard assumption is possible, but doing so means no longer having a single summary esti-mate of association [15]. The RMST provides a single summary measure of survival through timet∗that avoids this pitfall. Furthermore, the cause-specific HR may not translate to an actual change in risk [43], while the RMST is estimated directly from risk functions. Never-theless, the hazard ratio, relative risk and risk difference remain important measures in their own right [6].
As was demonstrated in the comparison of the RMST, HR, RR, and RD, all four measures are useful in describing the difference in all-cause mortality by history of injection drug use. The RD can highlight the public health import-ance of a particular exposure of interest as it is measured on an absolute scale and the HR provides the instantan-eous relative rate at a particular point in time. Compared to the HR, an advantage of RMST is that it has more power to detect differences between exposure groups when the HR is close to 1 [18]. Further, unlike the HR, RR, and RD that compare exposure groups at a single
point in time, the comparison of RMST between exposure levels summarizes the difference in expected mean time to an event for a given time interval. This is especially useful when comparing survival functions that diverge and later converge or cross. A final advantage of the RMST is the ease of interpretability when summarizing delays in care or decreases in survival. The use of RMST in our analysis to describe the difference in time not on ART while alive and in clinic facilitated the interpretation of our results by providing a clinically meaningful measure.
Conclusions
RMST can be calculated easily using non-parametric and semi-parametric estimators. We have demonstrated use of RMST to determine that PWID have lower expected survival over the first five years of clinical engagement compared to persons who did not inject drugs. However, PWID have similar expected time to ART initiation after properly accounting for their greater risk of death and loss-to-clinic as competing events. In conclusion, the re-stricted mean survival time is a useful alternative in
ana-lyzing time-to-event data that can provide
supplementary information to traditional survival esti-mands (e.g. the hazards ratio or risk difference).
Additional file
Additional file 1:Contains the R code used to set up the analysis, as well as an outline of how the various tables in results section were generated. (DOCX 94 kb)
a
b
c
Fig. 3The effect of follow-up time on three different effect estimates comparing ART initiation by IDU accounting for the competing event of death and loss-to-clinic. Panela) displays the standardizedadifference (with 95% confidence interval) in restricted mean time in years spent not on ART while alive
and in clinic by history of injection drug use over follow-up time. Panelb) displays the standardizedacause-specific hazard ratio (HR) over follow-up time.
Panelc) displays the standardizedasubdistribution mortality risk ratio (RR) over follow-up time.aCurves are standardized to the distribution of sex, race,
AIDS diagnosis, prior ART mono- or dual-therapy, age, CD4 cell count, log10HIV viral load, Hepatitis C, history of smoking, and hazardous alcohol use in the
total sample at clinic enrollment using inverse probability of exposure weights.bDashed grey lines represent the null hypothesis (i.e. difference in
Abbreviations
ART:Antiretroviral therapy; CI: Confidence Interval; CIF: Cumulative Incidence Function; HR: Hazard ratio; IDU: Injection drug use; IQR: Interquartile range; PWID: Persons who inject drugs; RD: Risk difference; RMST: Restricted Mean Survival Time; RR: Risk ratio
Acknowledgments Not applicable
Funding
The National Institute on Drug Abuse at the National Institutes of Health (Grant Number U01-DA036935). The National Institute of Allergy and Infection Diseases at the National Institutes of Health (Grant Numbers T32-AI102623 and P30-AI094189). The National Heart, Lung, and Blood Institute at the National Institutes of Health (Grant Number U01-HL121812). The National Institute on Alcohol Abuse and Alcoholism at the National Institutes of Health (Grant Number U01-AA020793). The funding bodies had no role in the design of the study; collection, management, analysis and interpretation of the data; or the writing of the manuscript.
Availability of data and materials
The datasets analyzed during the current study are available from the corresponding author on reasonable request.
Authors’contributions
KC and CC contributed equally to this work. KC and CC conceived of the methodological application, performed the analysis and co-wrote the manuscript. RM designed and supervised all data collection for the cohort, and contributed to the editing and review of the manuscript. CL contributed to the analytic plan, literature review, and manuscript editing. BL conceived of the methodological approach and contributed to the design of the analysis and editing of the manuscript.
Ethics approval and consent to participate
The Johns Hopkins HIV Clinical Cohort was approved by the Johns Hopkins Medicine Institutional Review Board.
Consent for publication Not applicable.
Competing interests
The authors declare that they have no competing interests.
Publisher’s Note
Springer Nature remains neutral with regard to jurisdictional claims in published maps and institutional affiliations.
Author details
1
Department of Epidemiology, Johns Hopkins Bloomberg School of Public Health, 615 N Wolfe St, Baltimore, MD 21205, USA.2School of Medicine, Johns Hopkins University, Baltimore, MD, USA.
Received: 29 May 2017 Accepted: 27 February 2018
References
1. Greenland S. Model-based estimation of relative risks and other epidemiologic measures in studies of common outcomes and in case-control studies. Am J Epidemiol. 2004;160:301–5.
2. Hernán MA. The hazards of hazard ratios. Epidemiol Camb Mass. 2010;21(1):13–5. 3. Toh S, Hernández-Díaz S, Logan R, Robins JM, M a H. Estimating absolute
risks in the presence of nonadherence: an application to a follow-up study with baseline randomization. Epidemiol Camb Mass. 2010;21(4):528–39. 4. Robins JM, Morgenstern H. The foundations of confounding in epidemiology.
Computers & Mathematics with Applications. 1987;14:869–916.
5. Greenland S. Absence of confounding does not correspond to collapsibility of the rate ratio or rate difference. Epidemiol Camb Mass. 1996;7(5):498–501. 6. Cole SR, Lau B, Eron JJ, Brookhart MA, Kitahata MM, Martin JN, et al. Estimation
of the standardized risk difference and ratio in a competing risks framework: application to injection drug use and progression to AIDS after initiation of antiretroviral therapy. Am J Epidemiol. 2015 Feb 15;181(4):238–45.
7. Rogawski ET, Westreich DJ, Kang G, Ward HD, Cole SR. Brief report: estimating differences and ratios in median times to event. Epidemiology. 2016 Nov;27(6): 848–51.
8. Irwin JO. The standard error of an estimate of expectation of life, with special reference to expectation of tumourless life in experiments with mice. J Hyg (Lond). 1949;47(2):188.
9. Karrison T. Restricted mean life with adjustment for covariates. J Am Stat Assoc. 1987 Dec;82(400):1169–76.
10. Zucker D. Restricted mean life with covariates: modification and extension of a useful survival analysis method. J Am Stat Assoc. 1998;93:702–9. 11. Andersen PK, Perme MP. Pseudo-observations in survival analysis. Stat
Methods Med Res. 2010;19(1):71–99.
12. Andersen PK. Decomposition of number of life years lost according to causes of death. Stat Med. 2013;32(30):5278–85.
13. Lesko CR, Edwards JK, Moore RD, Lau B. A longitudinal, HIV care continuum: 10-year restricted mean time in each care continuum stage after enrollment in care, by history of injection drug use. AIDS Lond Engl. 2016 Sep 10;30(14):2227–34. 14. Edwards JK, Cole SR, Adimora A, Fine J, Martin J, Eron J. Illustration of a
measure to combine viral suppression and viral rebound in studies of HIV therapy. J Acquir Immune Defic Syndr. 2014;68(2):241–4.
15. Cox DR. Models and life-tables regression. J R Stat Soc Ser B Methodol. 1972;34(2):187–220.
16. Gong Q, Fang L. Asymptotic properties of mean survival estimate based on the Kaplan-Meier curve with an extrapolated tail. Pharm Stat. 2012;11(2):135–40. 17. Kaplan EL, Meier P. Nonparametric estimation from incomplete
observations. J Am Stat Assoc. 1958 Jun;53(282):457–81.
18. Royston P, Parmar MK. Restricted mean survival time: an alternative to the hazard ratio for the design and analysis of randomized trials with a time-to-event outcome. BMC Med Res Methodol. 2013;13(1):152.
19. Cox DR, Oakes D. Analysis of survival data. London: United Kingdom: Chapman & Hall; 1984.
20. Ghali WA, Quan H, Brant R, van Melle G, Norris CM, Faris PD, et al. Comparison of 2 methods for calculating adjusted survival curves from proportional hazards models. JAMA. 2001 Sep 26;286(12):1494–7. 21. Cole SR, Hernan MA. Adjusted survival curves with inverse probability
weights. Comput Methods Prog Biomed. 2004;75(1):45–9.
22. Xie J, Liu C. Adjusted Kaplan-Meier estimator and log-rank test with inverse probability of treatment weighting for survival data. Stat Med. 2005;24(20): 3089–110.
23. Hernán M, Robins J. Causal Inference: Boca Raton: Chapman & Hall/CRC, forthcoming; 2018.
24. Hernán MA, Hernández-Díaz S, Werler MM, Mitchell AA. Causal knowledge as a prerequisite for confounding evaluation: an application to birth defects epidemiology. Am J Epidemiol. 2002 Jan 15;155(2):176–84.
25. Hernán MA, Robins JM. Estimating causal effects from epidemiological data. J Epidemiol Community Health. 2006 Jul 1;60(7):578–86.
26. Edwards JK, Cole SR, Westreich D. All your data are always missing: incorporating bias due to measurement error into the potential outcomes framework. Int J Epidemiol. 2015 Aug;44(4):1452–9.
27. Petersen M, Porter K, Gruber S, Wang Y, van der Laan M. Diagnosing and responding to violations in the positivity assumption. Stat Methods Med Res. 2012;21(1)
28. Westreich D, Cole SR. Invited commentary invited commentary : positivity in practice. Am J Epidemiol. 2010;171(6):674–7.
29. Cole SR, Frangakis CE. The consistency statement in causal inference. Epidemiology. 2009;20(1):3–5.
30. Pearl J. On the consistency rule in causal inference: axiom, definition, assumption, or theorem? Epidemiology. 2010;21(6):872–5. 31. VanderWeele TJ. Concerning the consistency assumption in causal
inference. Epidemiology. 2009;20(6):880–3.
32. Hudgens MG, Halloran ME. Toward causal inference with interference. J Am Stat Assoc. 2008 Jun;103(482):832–42.
33. Tchetgen EJT, VanderWeele TJ. On causal inference in the presence of interference. Stat Methods Med Res. 2012;21(1):55–75.
34. Hernán MA, Cole SR. Invited commentary: causal diagrams and measurement bias. Am J Epidemiol. 2009;170(8):959–62.
35. Hogg RS, Yip B, Chan KJ, Wood E, Craib KJ, O’Shaughnessy MV, et al. Rates of disease progression by baseline CD4 cell count and viral load after initiating triple-drug therapy. JAMA J Am Med Assoc. 2001;286(20):2568–77. 36. Egger M, May M, Chêne G, Phillips AN, Ledergerber B, Dabis F, et al.
therapy: a collaborative analysis of prospective studies. Lancet. 2002; 360(9327):119–29.
37. Althoff KN, Rebeiro P, Brooks JT, Buchacz K, Gebo K, Martin J, et al. Disparities in the quality of HIV care when using US department of health and human services indicators. Clin Infect Dis. 2014;58(8):1185–9. 38. Novak RM, Hart RL, Chmiel JS, Brooks JT, Buchacz K. Disparities in initiation
of combination antiretroviral treatment and in Virologic suppression among patients in the HIV outpatient study, 2000-2013. J Acquir Immune Defic Syndr. 2015;70(1):23–32.
39. Cunningham WE, Markson LE, Andersen RM, Crystal SH, Fleishman JA, Golin C, et al. Prevalence and predictors of highly active antiretroviral therapy use in patients with HIV infection in the united states HCSUS Consortium HIV Cost and Services Utilization J Acquir Immune Defic Syndr 1999. 2000 Oct 1; 25(2):115–23.
40. Celentano DD, Galai N, Sethi AK, Shah NG, Strathdee SA, Vlahov D, et al. Time to initiating highly active antiretroviral therapy among HIV-infected injection drug users. AIDS. 2001;15(13):1707–15.
41. Gebo K a, Fleishman J a, Conviser R, Reilly ED, Korthuis PT, Moore RD, et al. Racial and gender disparities in receipt of highly active antiretroviral therapy persist in a multistate sample of HIV patients in 2001. J Acquir Immune Defic Syndr 2005;38(1):96–103.
42. Howe CJ, Cole SR, Westreich DJ, Greenland S, Napravnik S, Eron JJ. Splines for trend analysis and continuous confounder control. Epidemiology. 2011 Nov;22(6):874–5.
43. Lau B, Cole SR, Gange SJ. Competing risk regression models for epidemiologic data. Am J Epidemiol. 2009;170(2):244–56.
44. Efron B, Tibshirani RJ. An introduction to the bootstrap. New York: Chapman & Hall; 1993.
45. R Core Team. R: a language and environment for statistical computing. Vienna. Austria: R Foundation for Statistical Computing; 2016.
• We accept pre-submission inquiries
• Our selector tool helps you to find the most relevant journal
• We provide round the clock customer support
• Convenient online submission
• Thorough peer review
• Inclusion in PubMed and all major indexing services
• Maximum visibility for your research
Submit your manuscript at www.biomedcentral.com/submit