R E S E A R C H
Open Access
Model-based optimal PEEP in mechanically
ventilated ARDS patients in the Intensive
Care Unit
Ashwath Sundaresan
1*, J Geoffrey Chase
2, Geoffrey M Shaw
3, Yeong Shiong Chiew
1and Thomas Desaive
4* Correspondence: asu33@uclive.ac. nz
1Department of Mechanical Engineering, College of Engineering, University of Canterbury, Private Bag 8140, Christchurch, New Zealand Full list of author information is available at the end of the article
Abstract
Background:The optimal level of positive end-expiratory pressure (PEEP) is still widely debated in treating acute respiratory distress syndrome (ARDS) patients. Current methods of selecting PEEP only provide a range of values and do not provide unique patient-specific solutions. Model-based methods offer a novel way of using non-invasive pressure-volume (PV) measurements to estimate patient
recruitability. This paper examines the clinical viability of such models in pilot clinical trials to assist therapy, optimise patient-specific PEEP, assess the disease state and response over time.
Methods:Ten patients with acute lung injury or ARDS underwent incremental PEEP
recruitment manoeuvres. PV data was measured at increments of 5 cmH2O and fitted to the recruitment model. Inspiratory and expiratory breath holds were performed to measure airway resistance and auto-PEEP. Three model-based metrics are used to optimise PEEP based on opening pressures, closing pressures and net recruitment. ARDS status was assessed by model parameters capturing recruitment and compliance.
Results:Median model fitting error across all patients for inflation and deflation was 2.8% and 1.02% respectively with all patients experiencing auto-PEEP. In all three metrics’cases, model-based optimal PEEP was higher than clinically selected PEEP. Two patients underwent multiple recruitment manoeuvres over time and model metrics reflected and tracked the state or their ARDS.
Conclusions:For ARDS patients, the model-based method presented in this paper provides a unique, non-invasive method to select optimal patient-specific PEEP. In addition, the model has the capability to assess disease state over time using these same models and methods.
Keywords:Mechanical Ventilation, PEEP, Model Based Methods, ARDS
1.0 Introduction
Patients suffering from acute respiratory failure, such as Acute Respiratory Distress Syndrome (ARDS), are often admitted to the Intensive Care Unit (ICU) and require Mechanical Ventilation (MV). ARDS mortality rates range from 30% to 70% [1]. In ARDS, the lung is inflamed and filled with fluid, becoming stiff, and lung units can col-lapse from the weight of additional fluid reducing the number of functional units. Thus, the ARDS lung is a stiffer, smaller lung, the so called“baby lung”[2]. There are
no specific treatments for acute respiratory diseases, except to facilitate an environ-ment for patients to recover [3].
Positive pressure ventilation has been highlighted as a key component of care [4,5], and is used to aid the recovery by reducing the work of breathing or taking over this work completely. Application of Positive End-Expiratory Pressure (PEEP) is one of the most important interventions in managing a patient with ARDS [6,7]. PEEP is applied to prevent de-recruitment at the end of expiration by keeping unstable lung units open and to recruit new lung units [7,8].
Each patient and their disease state are unique. Thus, MV management needs to be individualized. As the patient’s condition changes, ventilator parameters need to be updated. Specifically, the level of PEEP needs to be adjusted to optimize recruitment and gas exchange, and to facilitate reductions in MV support, as patient condition improves.
Prior studies have been conducted to identify optimal ventilation management, including the use of low tidal volumes [6,9-11], and selecting PEEP using the inflection points of the pressure-volume (PV) curve. Although the use of low tidal volume is now common practice [12], the optimal PEEP is still debated. Selecting PEEP between the lower and upper inflection points provides a guide, but still does not provide a unique, patient-specific value.
Model-based recruitment tools provide a new method of determining optimal PEEP [13]. Sundaresan et al developed a minimal model that estimated recruitability of indi-vidual patients by fitting lung mechanics to measured PV curves. Although the research developed and validated the model with retrospective clinical data, its clinical feasibility was not illustrated. This paper validates this model in pilot clinical trials. The paper examines the model’s ability to assess lung status, optimise PEEP and moni-tor patient condition over time.
2.0 Recruitment Model and Decision Support
2.1 Model Basics
The lung mechanics model of Sundaresan et al [13] considers the lung as a collection of multiple lung units. Units represent a set of distal airways and alveoli, with the lung divided into several “horizontal”compartments. The model in Figure 1 works on the principle that units can only be either recruited or de-recruited.
Recruitment and de-recruitment of the modelled lung units are controlled by the dis-tribution of Threshold Opening Pressure (TOP) and Threshold Closing Pressure (TCP). TOP is the critical pressure at which a previously collapsed unit is recruited during inspiration. TCP is the critical pressure where a previously recruited unit col-lapses during expiration. The model assumes that TOP and TCP are normally distribu-ted [13,14]. Thus, these distributions are described by two variables: standard deviation (SD) and mean. The shapes of the distributions are unique to the patient’s condition and the state of their disease, and will thus evolve with patient condition.
Given data from clinical PV loops, the model evaluates TOP and TCP distributions for each limb of the breathing cycle at a given PEEP. In particular, the model evaluates the TOP and TCP mean and SD for each PEEP level. As PEEP changes, the mean TOP and TCP also shift to reflect changes in recruitment, while SD remains constant. Thus, the model takes readily available PV measurements and outputs a TOP and TCP distribution for a given level of PEEP. This model has been validated using retro-spective data [13].
2.2 Decision Support Metrics
TOP & TCP
To optimise PEEP, the clinician must have the ability to assess how recruitable a patient is with respect to PEEP. The slope of the TOP mean shift yields information on the patient-specific level of recruitability. Similarly, TCP gives information on alveo-lar retention.
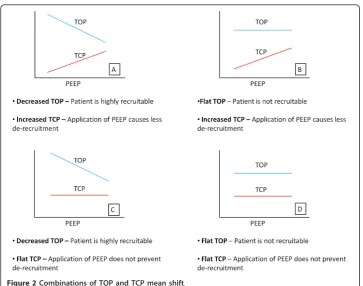
A large decrease in mean TOP with added PEEP implies that additional PEEP pro-duces additional recruitment of new alveoli units. Similarly, If TCP increases, then the application of PEEP continues to prevent de-recruitment of unstable units and added PEEP is beneficial. Thus, PEEP might be selected on the basis of how TOP and TCP change with PEEP. Figure 2 shows the possible combinations of TOP and TCP shifts as a function of PEEP.
The application of PEEP can risk inducing ventilation-induced lung injury (VILI) [15,16]. Thus, when the mean TCP is greater than PEEP, more than 50% of alveoli will de-recruit during expiration. Hence, where PEEP and TCP mean are equal represents the PEEP at which no more than 50% of alveoli de-recruit, which is used here as a benchmark for setting PEEP.
Net Recruitment
Figure 3(A) shows a static PV curve for a lung with total lung capacity (TLC). If a PEEP equal to Pcritis applied, the volume during inflation is represented by the volume
Vinf. However, during the deflationary portion of the static curve, the lung experiences
a level of hysteresis and results in much higher lung volume for a given pressure, Vdef.
The percentage of lung recruited at a given pressure is the lung volume divided by the TLC. Thus, during inflation for a given pressure, the percentage recruited volume is Vinf divided by the TLC. Simultaneously, during deflation, the percentage alveoli
remaining recruited at expiration is the Vdefdivided by TLC. The difference between
the percentage of alveoli remaining recruited at expiration and percentage recruited during inflation if PEEP equals Pcritis the net level of recruitment and varies as a
Though the mechanism of hysteresis is still not fully understood, studies have shown that the larger the hysteresis, the higher the recruitability of the lung [17]. This result implies airway pressures should be increased to provide additional recruitment to the point where net recruitment does not rise with PEEP (Figure 3(B)). Note that net recruitment should only be used if the TOP continues to decrease with PEEP.
2.3 Disease State Metrics
Four other parameters are used to assess how ARDS disease state evolves over time. Mean-Time Metric
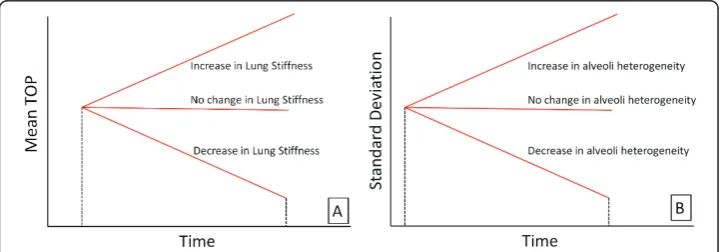
As a patient’s condition changes, the magnitude of the mean TOP for a given PEEP also changes. Increasing mean TOP indicates increasing lung stiffness and difficulty
Figure 2Combinations of TOP and TCP mean shift.
recruiting. A decrease implies more lung units available at a given pressure, and the lung has become less stiff. The trend of TOP can take on three possible scenarios over time, as shown in Figure 4(A).
Compliance-Time Metric
The second metric uses the SD to assess how the compliance of the lung changes with time, as shown in Figure 4(B). Schiller et al [18] showed that alveoli with various levels of injury typically appear in the same region of the lung, and even in the same micro-scopic field, because the ARDS lung is highly heterogeneous [19,20]. However, injured units recruit at higher pressures, while healthier units recruit at lower pressures. Therefore, changes in SD can help capture how healthy and damaged units are distrib-uted as their relative percentages and compliance change. An increase over time in SD could be interpreted as more injured lung units being present in the lung. Similarly, a decrease in SD could be attributed to a reduction and corresponding improvement in disease state.
Top Gradient Metric
The gradient of the TOP mean shift in Figure 2 captures changes in the patient’s recruitment response to PEEP. Changes in this gradient show how the recruitability response varies. An increase in magnitude of the TOP gradient implies the patient is becoming more responsive to PEEP, and a decrease implies less response.
Tcp Gradient Metric
The gradient of the TCP mean shift similarly shows how PEEP affects de-recruitment. An increase suggests that fewer alveoli are de-recruiting as a function of PEEP, and a decrease implies the application of PEEP does not prevent de-recruitment.
Importantly, healthy patients have all available alveoli recruited. Thus, these healthy patients will exhibit flat TOP and TCP gradients. However, this analysis only considers MV of very ill patients where the TOP and TCP gradient can vary significantly.
3.0 Methods and Materials
3.1 Patients
Ten patients were enrolled in this study from February 2010 through to September 2010. Of the ten patients enrolled, two patients underwent multiple recruitment man-oeuvres over several days. The study was approved by the Upper South Island Regional
Ethics Committee, New Zealand and was conducted in the Department of Intensive Care, Christchurch Hospital, New Zealand.
Patients were enrolled if they were over the age of 16 and were on MV therapy. Patients were only included if they were diagnosed with acute lung injury: a ratio of the partial pressure of arterial oxygen to the fraction of inspired oxygen (PF) of less than 300, but greater than 150. Patients were excluded if they were likely to be discon-tinued from MV therapy in 24 hours, were moribund or not expected to survive for greater than 72 hours, were diagnosed with asthma, had significant brain injury or required sedation.
3.2 Measurements
All patients were ventilated using volume controlled ventilation with the tidal volume selected by the clinician as 6 ml/kg and not changed for the duration of the trial. All patients underwent a protocolised recruitment manoeuvre with airway pressure and volume data collected. Heart rate, blood pressure and body temperature were also recorded. Before the recruitment manoeuvre and 30 minutes post manoeuvre, an arter-ial blood gas was taken to measure the PF ratio. Consented patients were given muscle relaxants to prevent spontaneous breathing efforts.
Patients were ventilated using a Puritan Bennett PB840 ventilator (Covidien, Boulder, CO, USA) in the Department of Intensive Care, Christchurch Hospital, New Zealand. A Hamilton Medical flow sensor (Hamilton Medical, Switzerland) was attached to the y-piece of the tubing and connected to a calibrated pneumotachometer. The pneumo-tachometer was used to obtain the pressure and flow measurements, and could capture the volume changes due to PEEP. A standard Dell™(Dell, Austin, TX, USA) laptop was used in conjunction with Labview Signal Express (National Instruments, Austin, TX, USA) to obtain the raw measurements.
3.3 Recruitment Manoeuvre
The protocol used in this study was based on the work by Gattinoni et al [21]. The protocol involved a PEEP trial, with PEEP incremented in steps of 5 cmH2O and peak
airway pressure limited to 45 cmH2O. Once all the required equipment was connected
to a patient, PEEP was reduced to zero (ZEEP). Five PV curves were obtained under ZEEP conditions. During ZEEP, at the end of expiration, a volume hold is performed to measure inspiratory resistance. In addition, an inspiration hold is also performed to measure auto-PEEP. PEEP is then incremented in steps of 5 cmH2O and the
corre-sponding PV curves obtained. PEEP is continually increased to PEEPmaxuntil peak
air-way pressure is equal to 45 cmH2O. Once PEEP max is achieved, PEEP is decremented
in steps of 5 cmH2O back to the initial ventilation settings. In all patients, tidal volume
was held constant at 500 ml or 6 ml/kg, whichever was lower.
4.0 Results
4.1 Peep Selection
levels below the auto-PEEP of 10 cmH2O. Figure 5 illustrates the TOP and TCP curves
for Patient 1, along with the model fit and net recruitment curves.
The model fits all the clinical data well as shown by low percentage error in Table 2. Fitting errors for all patients are summarised in Table 2. In all cases, patient-specific standard deviation was held constant for each patient across all PEEP values in a given trial. The fitting errors are presented as average absolute volume fitting errors and as percentage errors. The optimal patient-specific PEEP depending on the TOP, TCP and net recruitment are summarised in Table 3, including the auto-PEEP identified, for all patient trials.
4.2 Monitoring Disease Evolution
Patients 5 and 6 had multiple trials and recruitment manoeuvres on different days. The purpose was to examine the ability to track the evolution of disease state with time. Table 1 Model fitting error for Patient 1
PATIENT 1 Number of Units 144000
Inflation SDM 15
Deflation SD 7
Auto-PEEP [cmH2O] 10
Inflation Deflation
PEEP [cmH2O] Mean[l/cmH2O] Error [ml] Error [%] Mean[l/cmH2O] Error [ml] Error [%]
10 30.97 22.17 7.86 15.57 15.48 4.61
15 28.07 22.50 4.44 17.68 5.61 1.02
20 27.12 22.27 3.11 19.88 5.72 0.63
25 26.41 21.71 2.05 22.43 7.47 0.68
27 26.18 15.11 1.34 23.39 2.73 0.24
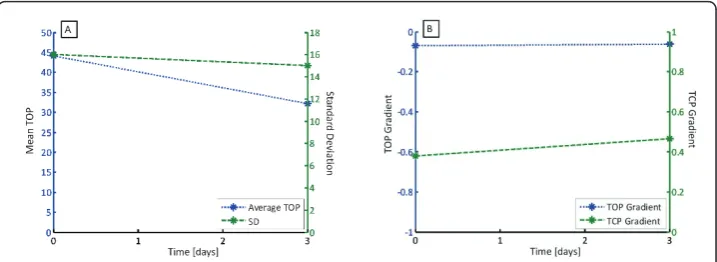
Patient 5 had two trials, with the second performed three days after the first. Patient 6 had three trials, with the subsequent two manoeuvres performed 7 and 14 days later. The variations of TOP, SD, TOP gradient and TCP gradient are shown in Figure 6 for Patient 5 and Figure 7 for Patient 6, with summary data in Table 3.
Figure 6(A) shows the average TOP and SD over time for Patient 5, and shows that a significant drop in average TOP, and a negligible drop in SD. Hence, Patient 5 has improved slightly in the ability to recruit and is slightly more compliant. Figure 6(B) shows no change in TOP gradient and little change in TCP gradient, suggesting that the recruitment response to PEEP has not changed significantly.
Similar to Patient 5, Patient 6 exhibits a decrease in average TOP, indicating recruit-ment has improved with time over the three trials. However, Figure 7(A) also indicates that between the first and second trial, SD has increased, implying less compliance and an increase in ARDS affected alveoli. Prior to the trial, the clinician hypothesised that this patient had severe ARDS. The increased level of recruitment could be attributed to marginally unhealthy units being recruited after a sustained level of pressure. How-ever, the increase in SD suggests that the condition of unhealthy alveoli was getting worse or that more alveoli were becoming ARDS affected. Patient 6 died later of severe respiratory failure, supporting this hypothesis. Figure 7(B) supports these outcomes, Table 2 Summary of absolute fitting errors for all patients
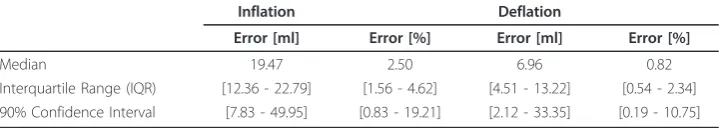
Inflation Deflation
Error [ml] Error [%] Error [ml] Error [%]
Median 19.47 2.50 6.96 0.82
Interquartile Range (IQR) [12.36 - 22.79] [1.56 - 4.62] [4.51 - 13.22] [0.54 - 2.34] 90% Confidence Interval [7.83 - 49.95] [0.83 - 19.21] [2.12 - 33.35] [0.19 - 10.75]
Table 3 Summary of auto-PEEP and model-based PEEP selection metrics for all patients
Auto-PEEP [cmH2O]
Clinically Selected PEEP [cmH2O]
Inflation SD
Model-Based PEEP Selection [cmH2O]
TOP TCP Net Recruitment
Patient 1 10 10 15 27 20 20
Patient 2 2 12 11 15 15 15
Patient 3 0 10 12 10 15 20
Patient 4 9 10 25 20 20 30
Patient 5 - Trial 1
13 12 16 20 25 25
Patient 5 - Trial 2
8 12 15 20 25 20
Patient 6 - Trial 1
10 11 11 15 20 20
Patient 6 - Trial 2
3 13 14 15 15 20
Patient 6 - Trial 3
2 10 14 10 20 15
Patient 7 2 7.5 10 5 10 10
Patient 8 0 12 15 15 20 30
Patient 9 12 10 15 25 20 29
suggesting that the patient was less responsive to PEEP induced recruitment over time, particularly between the second and third trials.
5.0 Discussion
5.1 Peep Selection
Based on the results of these clinical trials, the model highlighted aspects of MV that are clinically important in determining optimal PEEP. First, the model evaluates wave-forms to assess recruitment and de-recruitment, thus determining the patient’s recruit-ability. By examining how recruitable a patient is with respect to TOP, TCP, and net rate of recruitment, the model non-invasively evaluates the point where additional PEEP does not cause additional recruitment or retention of alveoli.
The model uses the TOP to assess the impact on recruitability using PEEP. The clin-ical data suggested that Patients 1, 3, 4, 9 and 10 were highly recruitable. These patients showed a significant drop in TOP as PEEP increased. In contrast, Patients 2, 6, 7 and 8 showed negligible or no change in TOP as PEEP increased, with PEEP resulting in minimally additional or no recruitment. Patient 5 underwent two trials, and in trial 1, was not very recruitable due to the minimal changes seen in TOP. How-ever, during the second trial, Patient 5 had a stronger recruitment response to PEEP.
The model also uses TCP to evaluate optimal PEEP, where the aim is to prevent de-recruitment or maintain recruited alveoli. All ten patients showed an increase in TCP as PEEP increased. This suggests that continual increases in PEEP will at least mini-mise de-recruitment, and PEEP should be maximini-mised. However, because high PEEP can result in VILI [15,16], the PEEP where no more than 50% of alveoli de-recruit was
Figure 6(A) Average TOP and SD over time for Patient 5 and (B) TOP and TCP gradient over time.
chosen as the optimal PEEP in this analysis. Although this 50% level is arbitrary, it represents a trade off between patient safety and ventilation efficacy.
Finally, the model also used net recruitment to select PEEP. This metric is only valid when the TOP decreases. Patients 2, 5 (trial 2), 6 (trials 1 and 3) and 7 showed an increase in TOP at high levels of PEEP, as shown in Figure 8(A). Based on alveolar recruitability, an increase in TOP would imply that high PEEP results in volume lost. Physiologically, this outcome would imply that there are more alveoli being damaged or lost (due to over inflation) than recruited. However, this sudden change of patient condition is highly unlikely due to the relatively low pressures used in this trial.
The clinical data showed this increase in TOP occurred when the compliance of the dynamic PV curve decreased markedly. When the compliance of the lung decreases, the pressure required to deliver a given volume of air increases. This result can occur when alveoli are maximally recruited and begin to over-inflate [16]. Thus, an increase in PEEP results in alveolar over-inflation, rather than additional recruitment, and venti-lating at higher PEEP is similar to ventiventi-lating above the upper inflection point (UIP). Therefore, the increase in TOP is an indication of alveolar over-inflation thus justifying the conclusion that it results in sub-optimal ventilation, as can be seen in Figure 8(B) for Patient 5.
5.2 Compliance Changes
The model used a constant SD across PEEP within a given trial to reflect the disease state of a patient, as fitted to the largely linear portion of the dynamic PV curve. When the model was applied to the clinical data, it was evident that the standard deviation is not necessarily constant across all PEEP values considered in this study. At relatively low and high PEEP, the compliance can be significantly different than in the linear portion of the static PV curve [22]. The variation in compliance is shown in Table 4 for the patients in this study. The compliance values are unusually high compared to the compliance for ARDS patient as in previous work [6,21,23-25]. This could be attributed to the presence of auto-PEEP in patients. Regardless of this limitation, it still reflects the recruitment response to PEEP indicating the robustness of the model.
The preliminary validation performed in Sundaresan et al [13] used retrospective clinical data with PV curves obtained during 30 minutes of sustained pressure [26] and showed similar compliance across the different PEEP. Recruitment manoeuvres apply-ing sustained pressure for relatively long periods of time have been shown to improve
recruitability [27]. This approach may have resulted in the very constant compliance in the data used in the initial validation on this data set. The model required multiple PV loops to assess the recruitability of the patient. From a practical perspective, if multiple PV loops are required, it is not feasible to hold the PEEP for 30 minutes as part of a clinical protocol for everyday use. Thus, in this situation, a short recruitment man-oeuvre would be more appropriate clinically, as used in these clinical trials.
Figure 9(A) shows PV curves from the Bersten dataset and Figure 9(B) from this study. Figure 9(A) shows the linear compliance not varying significantly in the three curves. In contrast, Figure 9(B) shows compliance varying at extreme PEEP, but remaining relatively constant in the linear region. Thus, although 30 minutes of sus-tained PEEP is not performed for the clinical dataset, the relatively constant compli-ance within the linear region is still obtained, which still incorporates the clinically acceptable PEEP ranges. In addition, the data from Bertsen used a maximum PEEP of 15 cmH2O, and did not push PEEP to the higher values compared to the trials used in
Table 4 Variation in compliance across all patients
PEEP in linear region [cmH2O]
Compliance in Linear region [ml/cmH2O]
Highest PEEP [cmH2O]
Compliance at highest PEEP [ml/cmH2O]
Patient 1 15 - 25 [45.43 - 60.47] 27 34.92
Patient 2 5 - 20 [63.19 - 103.91] 22 58.34
Patient 3 5 - 20 [70.62 - 107.96] 28 25.70
Patient 4 10 - 20 [21.82 - 44.81] 30 48.45
Patient 5 -Trial 1
15 - 20 [35.75 - 55.57] 25 24.40
Patient 5 -Trial 2
10 - 20 [55.01 - 62.21] 29 26.94
Patient 6 -Trial 1
10 - 20 [30.24 - 58.69] 25 17.02
Patient 6 -Trial 2
10 - 20 [35.13 - 53.80] 25 33.70
Patient 6 -Trial 3
5 - 15 [48.01 - 77.45] 20 23.64
Patient 7 5 - 10 [12.39 - 23.48] 16 5.76
Patient 8 10 - 25 [40.16 - 60.43] 30 32.14
Patient 9 10 - 25 [50.30 - 82.93] 30 36.70
Patient 10 10 - 25 [30.38 - 44.68] 30 26.74
this study. Thus, the relatively constant compliance seen by Bersten could have also been attributed to the fact that PEEP was not tested at extreme values.
5.3 SD & Compliance
Compliance in the linear portion of the static PV curve has been reported to be between 20 and 61 ml/cmH2O for patients with ALI and ARDS [6,21,23-25]. Table 5
summarises the inflation SD and the corresponding compliance of the linear portion of the static PV curve, with the results plotted in Figure 10. The aim is to examine the strength of the correlation between SD and compliance.
Figure 10 suggests that there is no strong correlation between inflation SD and the linear compliance. However, this result could be attributed to the fact that the TLC varies significantly between patients. For example, Patient 1 and Patient 8 exhibit the same SD, but the linear compliance is different, as shown in Figure 11 due to differ-ences in TLC. To correct for the varying lung capacity, the compliance was normal-ised, such that all patients exhibit a TLC of 1 L. This normalization effectively scales the static PV curve, and thus, modifies the compliance. The normalised compliance values thus present a fair comparison and are shown in Table 5, and plotted in Figure 12.
Figure 12 shows the normalised compliance as a function of SD and a very strong exponential relationship. In essence, the SD captures the effect of compliance. Although, numerically, SD may not accurately represent true linear compliance, these results show that SD can be effectively used as an indicator of the diseased state across a specific patient and across many patients if normalised.
5.4 Effect of Inspiratory Resistance
The effect of endotracheal tube resistance was evaluated by performing an inspiratory hold during the deflation to ZEEP and measuring plateau pressure. The difference in peak pressure and plateau pressure was attributed to the pressure loss of the tube.
Table 5 SD and linear compliance for each clinical patient
Inflation SD
Linear Compliance [ml/ cmH2O]
TLC [ml]
Normalised Linear Compliance [ml/cmH2O]
TLC [ml]
Patient 1 15 37.79 1440 26.25 1000
Patient 2 11 60.52 1710 35.40 1000
Patient 3 12 71.66 2200 32.48 1000
Patient 4 25 34.94 2200 15.88 1000
Patient 5 -Trial 1
16 48.80 1980 24.61 1000
Patient 5 -Trial 2
15 42.26 1610 26.25 1000
Patient 6 -Trial 1
11 33.92 960 35.36 1000
Patient 6 -Trial 2
14 47.97 1710 28.02 1000
Patient 6 -Trial 3
14 43.21 1540 28.04 1000
Patient 7 10 25.11 650 38.57 1000
Patient 8 15 46.20 1760 26.23 1000
Patient 9 15 49.58 1890 26.23 1000
Patient 10 16 36.17 1470 24.60 1000
Because a known decelerating flow waveform was used, inspiratory resistance can be calculated. Correcting for resistive pressure, the PV curves takes on a narrower shape, as shown in Figure 13(A).
The model was re-fitted with the corrected PV curves, and the resulting TOP and TCP calculated, in Figure 13(B). As shown, the overall magnitude of the TOP drops, while the TCP increases. This result is expected, as the pressure to overcome
Figure 10SD vs linear compliance for all patients.
resistance has now been partly compensated for. However, the overall TOP and TCP trends are still similar, and thus, the results, which are based on trends, are unchanged. The inspiratory hold is an additional step when obtaining the PV curves. Although the magnitude of TOP and TCP changes when corrected for resistive pressure, the trend is similar, and still produces the same patient-specific PEEP response. Thus, from a practical perspective, not measuring the flow resistive component yields similar responses, and avoiding this step reduces clinical burden in obtaining PV loops.
5.5 Airway Obstructions
One of the major limitations of this model is the reliance on the quality of the dynamic PV curve. In particular, the model does not work when patients exhibit severe airway obstructions, as was the case with Patient 4. Patient 4 exhibited very high
auto-Figure 12SD vs normalised linear compliance for all patients.
PEEP of 9 cmH2O and, as a result, the model was only fitted to PV curves with PEEP
above 10 cmH2O.
Figure 14 shows the flow and pressure waveforms. The waveforms highlight an inter-esting scenario where airway pressure begins to decrease even though the ventilator is still delivering positive flow. More specifically, the volume of the lung continues to increase even though there is a pressure drop, and thus does so faster than incoming flow.
In patients with ARDS and ALI, the lung is very heterogeneous. Some areas of the lung are compliant and healthy, while other portions of the lung can be extremely stiff [28]. In addition to a heterogeneous distribution of alveoli, an ARDS lung can exhibit significant airway resistance due to the presence of fluid secretions within the airway. The drop in pressure may then be explained when one considers heterogeneity of the ARDS lung.
As more air flows into lungs, the airflow takes the path of least resistance first fills compliant, healthy alveoli, A, as shown in Figure 15. However, the volume of alveoli A is limited. Hence, pressure builds up in the airways, and, as pressure builds at point 1, flow eventually overcomes the resistance to recruit alveoli B, recruiting more volume.
In this trial, the flow waveform used was a decelerating flow pattern. When the pres-sure difference at point 1 overcomes the resistance, flow begins to enter alveoli B. However, because the flow is decelerating, the newly available volume is not filled fast enough by the decelerating airflow. Thus, although lung volume is still increasing, the pressure drops due to the relative lack of flow.
This pressure drop could also be indicative of the severity of the disease state. Patient 4 was the only one who exhibited this drop in pressure, implying severe airway restrictions similar to what a COPD patient experiences. The pressure drop indicates that there are severe resistances to airflow and highlight potentially extreme heteroge-neity in the ARDS lung. Patient 4 later died due to advanced respiratory failure, further highlighting this possible indicator of the potential severity of ARDS.
Although Patient 4 showed such a pressure drop, the true compliance for this patient is when the pressure and volume increase (ie - when alveoli A is filling). Hence, the model is fitted to the regions of PV loops where pressure and volume are increasing. However, the problem with fitting to this region is that there are not many data points available. Hence, although the model can still fit to the PV curves, it may not give an accurate representation of patient recruitability, which is also a potential limitation.
6.0 Conclusions
The paper highlights the clinical validation and viability of using a lung mechanics recruitment model to assist in therapy. This paper introduced three metrics to help select optimal, patient-specific PEEP. Although the TOP, TCP and net recruitment metrics provide three different methods to evaluate the PEEP, they also provide a set of values that can be used in the clinic to gain insight into the patient’s recruitment and de-recruitment with the application of PEEP. Comparisons to clinical settings show that optimal PEEP can be higher than what is currently set.
This research also introduced four additional metrics to assess how the disease state evolves with time. Tracking the TOP with time yields information on the recruitability of the patient, and how this changes with time. In addition, tracking the SD provides information on how compliant the patient is and the state of the disease with time. Finally, tracking the gradient of TOP or TCP with time provides information on how the patient’s response to PEEP has changed. This metric strongly correlated with the clinical outcome of the two patients, and highlights the utility of using disease evolu-tion metrics in the clinic.
For patients with ARDS, the model presented suggests that optimal non-invasive PEEP titration can be achieved. In particular, the different metrics developed give a dif-ferent insight into the various mechanisms involved when selecting PEEP. The model outputs showed that optimal PEEP was much higher than clinically selected PEEP, and that most patients experienced auto-PEEP, indicating that current methods of ventila-tion still do not adequately ventilate patients.
7.0 Competing interests
The authors declare that they have no competing interests.
8.0 Authors contributions
AS, JGC and GMS created and defined the model. YSC and TD had input to analysis of results. GMS implemented trials clinically with input from all others. All authors had input in writing and revising the manuscript.
Author details
1Department of Mechanical Engineering, College of Engineering, University of Canterbury, Private Bag 8140, Christchurch, New Zealand.2Department of Mechanical Engineering, University of Canterbury, Private Bag 8140, Christchurch, New Zealand.3Department of Intensive Care, Christchurch Hospital, Private Bag 4710, Christchurch, New Zealand.4Cardiovascular Research Center, Institute of Physics, Allée du 6 Août, 17 (Bât B5), B4000 Liège (Belgium.
Received: 4 May 2011 Accepted: 27 July 2011 Published: 27 July 2011
References
1. Bersten AD, Edibam C, Hunt T, Moran J, Group TA, New Zealand Intensive Care Society Clinical T:Incidence and Mortality of Acute Lung Injury and the Acute Respiratory Distress Syndrome in Three Australian States.Am J Respir Crit Care Med2002,165:443-448.
2. Gattinoni L, Pesenti A:The concept of“baby lung”.Intensive Care Medicine2005,31:776-784. 3. Ware LB, Matthay MA:The Acute Respiratory Distress Syndrome.N Engl J Med2000,342:1334-1349. 4. Ashbaugh DG, Bigelow DB, Petty TL, Levine BE:Acute respiratory distress in adults.Lancet1967,2:319-323. 5. Ashbaugh DG, Petty TL, Bigelow DB, Harris TM:Continuous positive-pressure breathing (CPPB) in adult respiratory
distress syndrome.J Thorac Cardiovasc Surg1969,57:31-41.
6. Amato MBP, Barbas CSV, Medeiros DM, Magaldi RB, Schettino GP, Lorenzi-Filho G, Kairalla RA, Deheinzelin D, Munoz C, Oliveira R,et al:Effect of a Protective-Ventilation Strategy on Mortality in the Acute Respiratory Distress Syndrome.
N Engl J Med1998,338:347-354.
7. Halter JM, Steinberg JM, Schiller HJ, DaSilva M, Gatto LA, Landas S, Nieman GF:Positive End-Expiratory Pressure after a Recruitment Maneuver Prevents Both Alveolar Collapse and Recruitment/Derecruitment.Am J Respir Crit Care Med
2003,167:1620-1626.
8. McCann UG, Schiller HJ, Carney DE, Gatto LA, Steinberg JM, Nieman GF:Visual validation of the mechanical stabilizing effects of positive end-expiratory pressure at the alveolar level.J Surg Res2001,99:335-342.
9. Brochard L, Roudot-Thoraval F, Roupie E, Delclaux C, Chastre J, Fernandex-Mondejar E, Clementi E, Mancebo J, Factor P, Matamis D,et al:Tidal Volume Reduction for Prevention of Ventilator-induced Lung Injury in Acute Respiratory Distress Syndrome.Am J Respir Crit Care Med1998,158:1831-1838.
10. Stewart TE, Meade MO, Cook DJ, Granton JT, Hodder RV, Lapinsky SE, Mazer CD, McLean RF, Rogovein TS, Schouten BD,
et al:Evaluation of a Ventilation Strategy to Prevent Barotrauma in Patients at High Risk for Acute Respiratory Distress Syndrome.N Engl J Med1998,338:355-361.
11. Brower RG, Shanholtz CB, Fessler HE, Shade DM, White PJ, Wiener CM, Teeter JG, Dodd-o JM, Almog Y, Piantadosi S: Prospective, randomized, controlled clinical trial comparing traditional versus reduced tidal volume ventilation in acute respiratory distress syndrome patients.Crit Care Med1999,27:1492-1498.
12. The ARDS Network:Ventilation with Lower Tidal Volumes as Compared with Traditional Tidal Volumes for Acute Lung Injury and the Acute Respiratory Distress Syndrome.N Engl J Med2000,342:1301-1308.
13. Sundaresan A, Yuta T, Hann CE, Geoffrey Chase J, Shaw GM:A minimal model of lung mechanics and model-based markers for optimizing ventilator treatment in ARDS patients.Computer Methods and Programs in Biomedicine2009, 95:166-180.
14. Crotti S, Mascheroni D, Caironi P, Pelosi P, Ronzoni G, Mondino M, Marini JJ, Gattinoni L:Recruitment and Derecruitment during Acute Respiratory Failure. A Clinical Study.Am J Respir Crit Care Med2001,164:131-140. 15. Carney D, DiRocco J, Nieman G:Dynamic alveolar mechanics and ventilator-induced lung injury.Crit Care Med2005,
33:S122-S128.
16. Ricard JD, Dreyfuss D, Saumon G:Ventilator-induced lung injury.Eur Respir J2003,22:2s-9.
17. Cheng W, DeLong DS, Franz GN, Petsonk EL, Frazer DG:Contribution of opening and closing of lung units to lung hysteresis.Respiration Physiology1995,102:205-215.
18. Schiller HJ, Steinberg J, Halter J, McCann U, DaSilva M, Gatto LA, Carney D, Nieman G:Alveolar inflation during generation of a quasi-static pressure/volume curve in the acutely injured lung.Crit Care Med2003,31:1126-1133. 19. Rouby JJ, Lu Q, Goldstein I:Selecting the Right Level of Positive End-Expiratory Pressure in Patients with Acute
Respiratory Distress Syndrome.Am J Respir Crit Care Med2002,165:1182-1186.
20. Gattinoni L, Caironi P, Pelosi P, Goodman LR:What Has Computed Tomography Taught Us about the Acute Respiratory Distress Syndrome?Am J Respir Crit Care Med2001,164:1701-1711.
21. Gattinoni L, Caironi P, Cressoni M, Chiumello D, Ranieri VM, Quintel M, Russo S, Patroniti N, Cornejo R, Bugedo G:Lung Recruitment in Patients with the Acute Respiratory Distress Syndrome.N Engl J Med2006,354:1775-1786. 22. Harris RS:Pressure-volume curves of the respiratory system.Respir Care2005,50:78-98.
23. Brower RG, Lanken PN, MacIntyre N, Matthay MA, Morris A, Ancukiewicz M, Schoenfeld D, Thompson BT:Higher versus Lower Positive End-Expiratory Pressures in Patients with the Acute Respiratory Distress Syndrome.N Engl J Med
2004,351:327-336.
24. Gattinoni L, Pelosi P, Suter PM, Pedoto A, Vercesi P, Lissoni A:Acute Respiratory Distress Syndrome Caused by Pulmonary and Extrapulmonary Disease. Different Syndromes?Am J Respir Crit Care Med1998,158:3-11. 25. Jonson B, Svantesson C:Elastic pressure-volume curves: what information do they convey?Thorax1999,54:82-87. 26. Bersten AD:Measurement of overinflation by multiple linear regression analysis in patients with acute lung injury.
27. Lapinsky S, Mehta S:Bench-to-bedside review: Recruitment and recruiting maneuvers.Crit Care2005,9:60-65. 28. Gattinoni L, Chiumello D, Carlesso E, Valenza F:Bench-to-bedside review: Chest wall elastance in acute lung injury/
acute respiratory distress syndrome patients.Critical Care2004,8:350-355.
doi:10.1186/1475-925X-10-64
Cite this article as:Sundaresanet al.:Model-based optimal PEEP in mechanically ventilated ARDS patients in the Intensive Care Unit.BioMedical Engineering OnLine201110:64.
Submit your next manuscript to BioMed Central and take full advantage of:
• Convenient online submission
• Thorough peer review
• No space constraints or color figure charges
• Immediate publication on acceptance
• Inclusion in PubMed, CAS, Scopus and Google Scholar
• Research which is freely available for redistribution