Corresponding author: r.eldissoky@yahoo.com DOI: 10.21608/ejss.2019.13300.1275
Received 29/5/2019; Accepted 15/7/2019
Introduction
Potato (Solanum tuberosum L.) is one of the important economically crops that widely grown for local consumption and exportation in Egypt. It occupies more than 17% of the cultivated land (27.000 ha) with an average of production 360.000 tons per year (FAO 2015). Good Management of nitrogen-fertilizer (N) is the major limitation factors for potato yield and quality. Determining the optimum N-fertilizer rate and selection fertilizer forms are considering the most important decisions for growers (Güler 2009 and Zebarth et al. 2015).
Availability and cost are the most important factors to consider in choosing a fertilizer formulation today. The most common Nitrogen fertilizers in Egypt are: urea “U” (contributes
57.58% of total N-fertilizers), ammonium nitrate “AN” (10.52%) and ammonium sulfate (AS: 2.24%) (El-Gabaly 2015). In addition, U is the most widely used in the world (contributes 59.34% of total N-fertilizers production), whereas AN and AS contribute 7.69% and 3.96%, respectively (IFA 2014). Therefore, U contributes the most production of nitrogen-fertilizers, whereas AN-fertilizer is the most preferable one for potatoes grown in old and newly soils in Egypt (Ahmed et al., 2009 and Khalil, 2014). However, AN is not available at all time of season, and high expensive. On contrast, U is usually less expensive than AN, and more available at all time of season. So, growers resort to U for its availability and economic considerations more than the other sources. On the other hand, AS isn’t
S
ELECTING the appropriate form of nitrogen fertilizer is one of the important limitation factors for potato yield and quality, which depends primarily on the availability and cost of fertilizers.The aim of this study was to compare the effect of conventional N-fertilizer forms (urea “U”, ammonium nitrate “AN” and ammonium sulphate “AS’) with mixed fertilizers (six MF: as a mixture percent’s of AS with U or AN of the added N) on growth, yield, quality, nutrients uptake, N use efficiency (NUE) and profitability of potatoes grown in clayey loam soils. Two field experiments were carried out at Batra, Talkha, Dakahlia Governorate, Egypt during successive seasons on two potato varieties (i.e., Spunta and Diamant). Treatments were arranged in Complete Randomized Blocks Design with three replicates. The obtained results showed that mixed nitrogen fertilizers treatments enhanced plant growth, tuber yield, quality, nutrient uptake and NUE compared to sole application of conventional forms, with superiority of MF: 75%AN+25%AS, 50%AN+50%AS and 50%U+50%AS. The highest yield of dry matter and starch was obtained by adding MF of 50%AN+50%AS. However, the accumulation of NO3-in tuber is -inversely proportional to dry matter; the highest content obta-ined with 100%Uea, but the lowest content obtained with MF of 25%AN+75%AS. The greatest percentage of NUE was obtained with MF of 50%AN+50%AS in both experiments. These results referred to the importance of AS application along with AN or U as a mixed fertilizer to maximize potato yield and quality, NUE and profitability.
Keywords: Nitrogen Fertilizer forms; N use efficiency; Potato varieties; Dry matter& nitrate relationship; Profitability.
Mixed and Conventional Nitrogen Fertilizers Impacts on Yield,
Quality and Nutrient Uptake by Potato
Ramadan Awad El-Dissoky
Soils, Water and Environment Research Institute, Agricultural Research Center, Giza, Egypt
Egyptian Journal of Soil Science
http://ejss.journals.ekb.eg/
common as U and AN, as well as it isn’t known for some growers in Egypt, however it is the most popular fertilizer in many countries (Sharma and
Bali, 2018).
Plant takes up N in two forms: NO3--N and NH4+-N, but some plant species prefer one ion over the other. Under normal aerated conditions in soils, nitrate is the main source of nitrogen; and readily mobile in plants and can be stored in
vacuoles (Marschner, 1995 and Barker & Pilbeam,
2007). The excessive application of N-fertilizers resulted in a higher nitrate status in the plant tissues and in underground water (Ismail and Abu-Zinada, 2009). Nitrate contents in vegetables depend largely on the level of NO3- nutrition; high rates of NO3- application (300 to 400 kg N ha-1) result in high levels of NO
3- in the plant material (Mengel and Kirkby, 2001). In addition, increasing the accumulation of nitrate in fruits had a bad effect on its quality and is dangerous on the common health, where it is believed to be carcinogenic (Wong and Li, 2004).
Also, high NO3--N levels in soil or nutrient solution will cause oxidative damage and induce reactive oxygen species, and at highly toxic level can damage many important cellular components as lipids, protein, DNA and RNA. On the other hand, increasing level of NH4+-N could be highly toxic for plant cells (Pilbeam and Kirkby, 1992). So, the good management of application N-Fertilizer has important effects on quality of
potato yield too (Laboski & Kelling, 2007 and
Zebarth et al., 2015).
Optimizing N fertilization requires matching the supply of N to the crop N demand in space and time. Potato varieties differ in the relationship between growth and N uptakes as well as it differed in tuber yield response to N-fertilizer (Zebarh et al., 2004). The rapid plant uptake of N occurs during tuber initiation and set (from about 50 to 70 days after planting), and is reduced during tuber bulking (from about 70-90 days after planting) (Zebarth and Rosen, 2007). The varieties vary in their requirements of N-fertilizer that ranged from 120 to 180 kg N fed-1 (fed= 0.42ha), according to variety and soil type (MALR, 2014).
Growth, yield, quality and the nutrient uptake of potato plant are affected by nitrogen fertilizer forms. Karadogan (1995) indicated that the greatest growth of potato plants resulted by supplying N as NO3- followed by both NO
3- and NH4+ and the least with NH4+. However, Westermann and Sojka
(1996) showed that vegetative growth characters were higher by using ammonium sulfate (AS) fertilizer rather than ammonium nitrate (AN). In the same trend, Soliman et al. (2000) found that
N sources had significant effects on plant growth
and tuber yield of potato with superiority of AS when compared with AN or urea.
On the other hand, Ahmed et al. (2009) found that using N fertilizers as AN (at a rate of 230 Kg N fed-1) recorded the highest values of tuber yield, number of tubers plant-1 and marketable tuber percentage, whereas using the same source of N at a rate of 130 Kg N fed-1 gave the highest values
of quality; specific gravity, starch, dry matter, P
and K in tubers. In the same trend Ahmed et al. (2015) reported that vegetative growth characters of potato plants, tuber yield and quality were better with using AN rather than U-fertilizer under the ecological conditions of clay loam soil. However, the differences among the impacts of N-sources; AN, U, NP and NPK fertilizers on the plant growth,
yield and quality of tuber did not reveal significant
differences in clayey soil (Marouani et al., 2015). In addition, Dua (2018) reported that ammonium sulphate (21% N) is the most preferred one of N-sources for potato production, due to its content of sulfur (24% S), followed by calcium ammonium nitrate (25% N), whereas urea (46% N) being cost effective, and it is most commonly
used. Also, Sharma and Bali (2018) demonstrated
that AS is considered an excellent source of N and S, it tends to decrease soil pH as a side effect, which makes it a preferable option at high soil pH and when additional S is also required for
sufficient crop growth and health. Accordingly,
achieving to successful fertilizer form that gained top yields that have high quality and maximizing returns of fertilizer investment is considering the greatest goal in planning a fertilizer program for potatoes (Forde and Clarkson, 1999).
So, the aim of this study was to compare the effect of conventional forms of nitrogen fertilizers with some mixture percent’s of them as mixed fertilizers on growth, yield, quality, NPK-uptake
and the use efficiency of added nitrogen for
two potato varieties grown in clayey loam soil. Furthermore, assessment the economic return of each treatment.
Materials and Methods
Egypt. J. Soil. Sci. 59
District, Dakahlia Governorate, Egypt (30° 16’ 72”N; 31° 46’ 25.80”E) during the two successive grown seasons: 2015/2016 and 2016/2017. The 1st experiment was conducted on potato cultivar: Spunta (non-industrial cultivar), and the second experiment was on potato cultivar: Diamant (industrial cultivar; according to Potato Varieties Database- Online 2019).
Samples of soil surface (0-30 cm) were taken from each experiment before soil preparation for planting. The samples were air dried and prepared for laboratory analyses. Some physical and chemical properties of soil and initial soil status of available nutrients N, P, K, Ca, Mg, Fe, Mn and Zn were determined according to Hesse (1971) and Page (1982) as shown in Table 1(average of the two study seasons).
Each experiment included ten treatments; zero application (without application any nitrogen fertilizer), and nine treatments of nitrogen fertilizer formulas at the rate of 150 kg N fed -1. Three of them as common or conventional N-fertilizers forms: urea (U: 46% N), ammonium nitrate (AN: 33.5% N) and ammonium sulphate (AS: 20.6% N+ 24% S); and six treatments as mixed fertilizers (MF) of AS with U or AN at different percentages of application N (150 kg N fed-1 “the recommended of N”) as
follows:-T1: Zero application.
T2: 100% of the added N as U [CO(NH2)2]. T3: 100% of the added N as AN [NH4NO3]. T4: 100% of the added N as AS [(NH4)2SO4]. T5: MF1: 75%U+25%AS.
T6: MF2: 50%U+50%AS. T7: MF3: 25%U+75%AS. T8: MF4: 75%AN+25%AS. T9: MF5: 50%AN+50%AS. T10: MF6: 25%AN+75%AS.
The treatments were arranged in Complete
Randomized Blocks Design with three replicates.
The area of each plot was 10.5 m2 (3 lines * 5 m length * 0.70 m width). Potatoes were planted in the 1st season on 7th December 2015 and harvested in the last week of April 2016 for both experiments (Spunta and Diamant). In the 2nd season, potatoes in both experiments were planted on 13th December 2016 and harvested in the first week of May 2017.
Nitrogen fertilizer treatments were applied at
two equal doses with first and second irrigation
after planting. Phosphorus was added at the rate of 75 Kg P2O5 fed-1 assingle super phosphate fertilizer (15% P2O5) with soil preparation. Potassium was added at the rate of 48 kg K2O fed-1 as potassium sulphate fertilizer (48% K2O) before planting. Each experiment received about 6
Properties 1st Values Properties Values
Experiment 2 nd
Experiment 1
st
Experiment 2 nd Experiment Particle size
distribution % Sand 34.45 31.10
**EC (dSm-1) 2.04 1.41 Silt 30.30 33.30 Soluble
Cations (mM L-1)
Ca++ 7.0 5.0 Clay 35.25 35.60 Mg++ 5.0 4.0 Texture class Clayey loam Clayey loam Na+ 7.1 4.2 Saturation percent 65.0 60.0 K+ 0.54 0.46 Organic matter % 0.93 1.10 Soluble
anions (mM L-1)
CO3-- ***N.D. N.D.
CaCO3% 2.40 2.30 HCO3- 4.0 4.0
*pH 8.16 8.08 Cl- 12.5 8.5
Bulk density (g cm-3) 1.25 1.20 SO4-- 3.14 1.16
Available nutrient (mg kg-1)
N 70 65 Mg 180 210
P 13.6 9.8 Fe 3.80 4.2
K 380 320 Mn 2.15 2.3
Ca 1100 980 Zn 0.75 1.0
TABLE 1. Some physical and chemical properties of the experimental soils
irrigations; the first after 30-35 days form planting
and then irrigation every 21 days, and every 15 days at bulking and maturity stages, respectively.
Additionally, all recommended field practices for
potato were performed for each experiment. At harvest stage (after 135 days from planting approximately), 6 plant were taken from each plot to determine growth parameters as plant height (cm), leaf number per plant, fresh and dry weight of plant and dry straw weight (kg fed-1). Additionally, unit area from each plot was harvested and collected to calculate total tuber yield per fed (fed= 0.42 ha). Samples of plant and tubers were randomly taken for chemical analyses. Parameters of tuber quality were carried out on fresh tubers as dry matter % and nitrate content. Dry matter % was calculated as percentage of dry weight of 100 gram fresh tuber weight was oven dried at
70 ̊C according to Dogras et al. (1991). Nitrates
were determined according to Singh (1988) using spectrophotometer at wave length 540 nm.
Samples were dried then wet digested using mixture of sulphoric and percolreic acids (1:1) for chemical analyses of NPK concentrations in plant and tuber. Nitrogen was determined using micro Kjeldahl method. Phosphorus was determined by ammonium molybedate method using spectrophotometer at wave length 640
nm. Potassium was determined using flame
photometer. Starch %was calculated as {17.457+ 0.891×(dry matter% -24.182)} according to
Burton (1948). Total carbohydrates and reducing
sugars were determined using spectrophotometer at wave length 420 nm according to A.O.A.C.
(1990). Nitrogen agronomic efficiency (NAE) is
known as the ability of use N to produce biomass (Mengel and Kirkby 2001). NAE was calculated as «kg yield/ kg N-applied».
Nitrogen use efficiency (NUE) known as
N-removal to N-applied ratio (EU Nitrogen Expert Panel 2015 and Evans et al., 2016), also it is known by apparent nitrogen recovery (Mengel and Kirkby, 2001). Hence, NUE% was calculated according to the following equation:
Also, study included economic evaluation of potato yield per fed (fed= 0.42ha) for each treatment of nitrogen fertilizer according to the total cost and the total gross return in Egyptian Pound
(L.E). The total cost included the cost of nitrogen fertilizer as a variable beside the other constant cost of phosphorus, potassium and other fertilizers,
seeds, pesticides, labors and other field practices.
The total gross return was calculated as (tuber yield by kg fed-1 X price in L.E kg-1). Generally, prices were the average for the two seasons.
The statistical analysis was done according to Gomez and Gomez (1984) as a combined analysis of the two seasons, and the means of treatments
were compared against Least Significant
Differences Test (L.S.D) at level 5% and Duncan’s Multiple Comparisons Test.
Results and Discussion Soil characteristics of experiments
Data in Table 1 illustrate the initial status of studied soils before planting both experimentsof potato varieties; Spunta and Diamant. It is clear from results that soils were moderately texture (clayey loam); slight alkaline, non-saline and low in content of organic matter. Also, it was moderate in available N, P, K and Mg; high in available Ca and low in available Fe, Mn and Zn.
Plant growth
It is obvious from results in Table 2 that plant height, fresh and dry weight of plant, leaf No. plant-1 and dry straw weight (kg fed-1) were
significantly affected by variation in N-fertilizer
forms at both experiments; Spunta and Diamant. Application of N as Mixed fertilizer (MF) of AS [(NH4)2SO4] at 25 or 50% of the added N with AN (NH4NO3) or U [CO(NH2)2] significantly
increased growth of plant than sole application of each form for both potato varieties. The superiority in plant growth was recorded with treatments of MF: 75%AN+25%AS (T8) followed by 50%AN+50%AS (T9), without significant
differences between them. Also, MF of AS with U as 75%U+25%AS, 50%U+50%AS and 25%U+75%AS enhanced growth of plant (plant height, leaf No. plant-1 and dry weight of plant) as compared with sole application of U, AN or AS. For comparison among conventional N-fertilizer forms, AS gave higher values of dry weight per plant and per fed than AN and U, but U had higher values of plant fresh weight.
Egypt. J. Soil. Sci. 59
U [CO(NH2)2] applied is converted into NH4-N by the enzyme urease, since these reactions take some days may be lengthen or shorten based on several factors such as soil moisture, soil texture,
soil temperature and organic matter (Barker and
Pilbeam, 2007).
In this admiration, Westermann (1993) and Karadogan (1995) reported that the greatest growth of potato plants resulted from supplying N as NO3-N followed by NO3+NH4 then with NH4-N. Also, Khalil (2014) indicated that the application of N-demand at 25%AS and 75%AN enhanced growth of potato grown in sandy soil more superior than relying on sole source of them followed by the application as 50%AS and 50%AN then the application as 100%AN.
Furthermore, Dua (2018) and Sharma and Bali
(2018) reported that ammonium sulphate (21% N) is the most preferred one of N-sources for potato production, due to its content of sulfur (24% S).
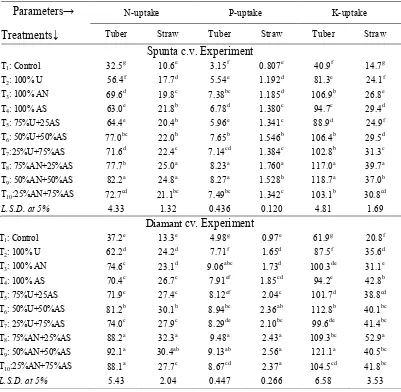
Tuber yield and its components
Data in Table 3 illustrate that tuber yield, average weight of tuber as well as dry matter
and starch yields were significantly affected by
varying in N-fertilizer forms in both experiments; Spunta and Diamant. Mixed N fertilizer treatments had the greatest effect on potato yield and its components as compared with conventional forms of N-fertilizer for both varieties.
Spunta experiment
The highest yields of tubers (20.457 t. fed-1), dry matter (3861 Kg fed-1) and starch were obtained by treatment of MF 50%AN+50%AS, but these
yields were insignificant with that obtained by
MF 75%AN+25%AS. Also, the highest average of tuber weight (226 g) was obtained with MF of 75%AN+25%AS. In general, MF treatments of 50%AN+50%AS and 75%AN+25%AS had higher values of NAE and higher percentages of relative increase (RI) of dry matter and starch yields followed by those of MF 50%U+50%AS.
Diamant experiment
The highest tuber yield (18.930 t. fed-1) was gained at the treatment of MF 75%AN+25%AS,
but this yield insignificantly differed with that
obtained by treatments of MF; 50%U+50%AS (18.519 t. fed-1) and 50%AN+50%AS (18.466 t. fed-1). Also, MF of 50%AN+50%AS had the highest yields of dry matter and starch (4145 and 2956 Kg fed-1, respectively), but these values
were insignificantly differed with that of MF:
75%AN+25%AS and 50%U+50%AS. Concerning
conventional forms, AN had superior effect on yield of tuber, dry matter and starch followed by AS-fertilizer then urea for both varieties. The highest NAE (kg yield/kg N-applied) was gained with MF of 50%AN+50%AS.
It is obvious from previous mentioned results that MF treatments maximized the values of tuber yield, average weight of tuber, dry matter and starch yields, and it had high RI as compared with traditional fertilization as a sole application in both experiments. The superiority was the greatest with treatments of MF: 75%AN+25%AS (T8), 50%AN+50%AS (T9) and 50%U+50%AS (T6).
These results are confirmed by Khalil (2014), who
indicated that the usage of appropriate ratio of AS to AN for potato fertilization grown in sandy soil was more superior than relying on sole source of them. The superiority of AN-fertilizer is attributed to its content of the two forms NO3- and NH
4+ which is considered preferable for plant than contain NH4+ only (Westermann 1993 a nd Karadogan 1995).
However, the lowest yield of tuber, dry matter and starch was obtained with 100%U. In this respect, Ahmed et al. (2015) found that tuber yield was better with using nitrogen fertilizer in the form of ammonium nitrate rather than urea fertilizer. The poor performance of urea has been found to be related to its adverse effect on plant emergence by increasing the osmotic pressure particularly at higher doses. Therefore, it is recommended that half of N be applied at planting through calcium ammonium nitrate and remaining at earthling up at about 25-30 days after planting through urea (Dua, 2018).
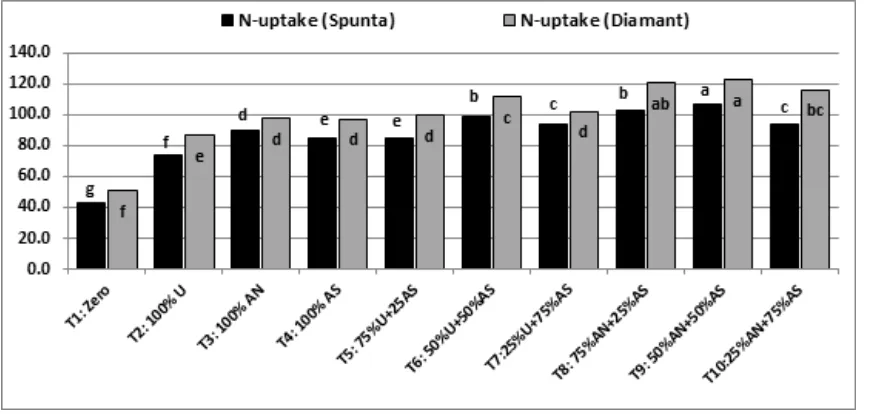
NPK-uptake and NUE Nitrogen uptake and NUE
The presented results in Table 4 show that potato
uptake of N was significantly affected by variation in
N-fertilizer forms. Application of N-requirements as mixed fertilizer (MF) of AS with AN or lower rates of U (treatments of T6 to T10) enhanced the plant
N-uptake and the use efficiency of application N
(NUE) than sole application as conventional forms i.e. U, AN or AS for both varieties.
The greatest uptake of N was obtained by treatments of MF 50%AN+50%AS (T9), without
significant differences with N-uptake with MF
maximizeplantuptake of N as compared with other treatments, whereas the differences among them
were insignificant. In this admiration, Ahmed et
al. (2009) found that the highest NPK-uptake in tuber was found with applying N-fertilizer as AN followed by that of U then AS.
The above mentioned results demonstrated that application of N-requirements as mixed fertilizer of AS [(NH4)2SO4] along with U [CO(NH2)2] or AN (NH4NO3) improved the use
efficiency of application N, where it increased the uptake of N (Table 5 and Fig. 1 & 2) as compared
individual application of each form. The greatest percentages of NUE in both experiments were attained with treatments of MF: 50%AN+50%AS, 75%AN+25%AS and 50%U+50%AS, respectively.
These results may be attributed to that forms of MF gave plant the optimum chance to take up N at two forms NH4+-N and NO
3--N along with S as SO42+, that had positive relationship between them (N and S); the uptake and assimilation of N and S by plants are strongly interrelated and dependent upon each other (Mengel and Kirkby
2001; Barker and Pilbeam 2007). Application of N
as MF of 50%AN+50%AS supply plant with N as 25% NO3--N + 75% NH
4+-N along with SO42+ (at 90 kg S), whereas MF of 75%AN+25%AS supply plant with N as 37.5% NO3--N + 62.5% NH
4+-N along with SO42+ (at 45 kg S). However, the application of N as MF of 50%U+50%AS supply plant with N as 50% NH2-N (rapidly converted to NH4+-N after application)+ 50% NH
4+-N along with SO42+ (at 90 kg S).
TABLE 2. Effect of conventional forms of nitrogen fertilizers and some mixture percent’s of them as mixed fertilizer on plant growth
Parameters→
Treatments↓
Plant height
(cm) Leaf No./plant
Plant fresh weight
(g)
Plant dry weight
(g)
Dry straw weight (kg/fed) Spunta cv. Experiment
T1: Control 23.3g 10.7f 39.8f 9.27f 312f
T2: 100% U 31.2f 15.8e 135.7c 14.42e 486e
T3: 100% AN 34.4cd 19.5bc 116.2de 15.46de 521d
T4: 100% AS 32.8de 17.5d 110.7de 17.26c 582c
T5: 75%U+25AS 35.2bc 17.5d 121.5d 16.28cd 549cd
T6: 50%U+50%AS 32.6ef 19.3c 106.5e 18.68b 630b
T7:25%U+75%AS 33.5de 18.2d 163.5b 18.70b 630b
T8: 75%AN+25%AS 36.2ab 21.8a 177.3a 21.82a 735a
T9: 50%AN+50%AS 36.9a 22.3a 168.8ab 21.41a 722a
T10:25%AN+75%AS 34.3cd 20.5b 113.2de 18.40b 620b
L.S.D. at 5% 1.63 1.10 11.03 1.04 35.04
Diamant cv. Experiment
T1: Control 26.7e 17.3f 65.4f 13.08g 441g
T2: 100% U 36.3bc 23.3cd 104.4e 20.14f 679f
T3: 100% AN 35.7bcd 20.7de 124.3d 20.88f 704f
T4: 100% AS 36.7bc 25.0abc 124.7d 22.49e 758e
T5: 75%U+25AS 35.3cd 22.3cde 137.2bc 24.87cd 838cd
T6: 50%U+50%AS 35.0cd 24.0bc 134.7c 26.30bc 886bc
T7:25%U+75%AS 33.3d 20.3e 135.6c 24.60d 829d
T8: 75%AN+25%AS 40.0a 27.7a 156.5a 28.09a 947a
T9: 50%AN+50%AS 38.3ab 27.0a 151.3a 27.22ab 917ab
T10:25%AN+75%AS 35.0cd 26.3ab 143.0b 25.83bcd 870bcd
L.S.D. at 5% 2.97 2.69 6.87 1.55 52.4
Egypt. J. Soil. Sci. 59
Furthermore, the plant uptake of N and NUE could be returned to relationship between forms of fertilizer and its behavior in soil; fertilizers that contain N as NH4+-N (AS) carries a positive charge and is adsorbed onto soil particles and is resistant to leaching too, so it had high percentage of NUE. However, fertilizers that contain N as NO3--N (calcium nitrate and AN) carries a negative charge and is not adsorbed onto soil particles, moves freely in the soil solution, so it
is free to be leached from the soil which reflect
by negative on NUE. On other hand, urea-fertilizer (U) is readily available to plants at the application to soil; it rapidly changes to NH4+-N,
but significant quantities of NH4+-N may be
lost through volatilization, especially when it is surface applied at high soil pH (Das and Mandal,
2015). Moreover, it is worth mentioning that there are numerous processes affect N turnover
in the soil; i.e. nitrification, denitrification and ammonification. Generally, ammonium fertilizers tend to be converted to nitrate by nitrification
process in soil. Therefore, soils usually contain higher levels of nitrate than ammonium (Mengel and Kirkby, 2001). Therefore, application of N as MF of two forms (AS+U or AS+AN) reduced the loss of applied N and maximize the plant uptake of NH4+-N and NO3--N along with and SO42-. These results are in accordance with Westermann (1993), Karadogan (1995) and Khalil (2014) who reported that the ideal nitrogen program is one that employs both NO3- and NH4+ sources, which provides a steady and adequate supply of N to the plant over the season.
TABLE 3. Effect of conventional forms of nitrogen fertilizers and some mixture percent’s of them as mixed fertilizer on potatoes yield and its components
Parameters→ Treatments↓
Tuber yield (t. fed-1)
*NAE (kg tuber/
kg N)
Average weight of tuber (g)
Dry matter
yield (kg fed-1)
**RI
% (kg fedStarch yield-1)
RI %
Spunta cv. Experiment
T1: Control 9.217e 0.00 111f 1593h 0.00 1043g 0.00
T2: 100% U 15.058d 38.9 165e 2576g 61.71 1679f 60.98
T3: 100% AN 18.188b 59.8 198bc 3220d 102.13 2126d 103.84
T4: 100% AS 16.973c 51.7 185cd 3051e 91.53 2025d 94.15
T5: 75%U+25AS 16.500c 48.6 208b 2903f 82.23 1912e 83.32
T6: 50%U+50%AS 18.553b 62.2 193bcd 3419c 114.63 2288c 119.37
T7:25%U+75%AS 17.013c 52.0 178de 3157de 98.18 2117d 102.97
T8: 75%AN+25%AS 20.020a 72.0 226a 3747ab 135.22 2520ab 141.61
T9: 50%AN+50%AS 20.457a 74.9 201b 3861a 142.37 2604a 149.66
T10:25%AN+75%AS 18.340b 60.8 179de 3621b 127.31 2476b 137.39
L.S.D. at 5% 0.546 -- 15.4 137.3 -- 103.5
--Diamant cv. Experiment
T1: Control 10.184e 0.00 81e 2158g 0.00 1516g 0.00
T2: 100% U 15.465d 0.0 97d 3170f 46.88 2206f 45.54
T3: 100% AN 16.808c 35.2 100d 3569cd 65.39 2508cd 65.48
T4: 100% AS 16.194c 44.2 131b 3392e 57.19 2375e 56.70
T5: 75%U+25AS 16.272c 40.1 119c 3469de 60.73 2440de 60.99
T6: 50%U+50%AS 18.519a 40.6 127bc 4048ab 87.56 2866ab 89.10
T7:25%U+75%AS 16.763c 55.6 129b 3692c 71.09 2620c 72.84
T8: 75%AN+25%AS 18.930a 43.9 125bc 4093a 89.68 2891a 90.69
T9: 50%AN+50%AS 18.466a 58.3 130b 4145a 92.10 2956a 94.99
T10:25%AN+75%AS 17.606b 55.2 139a 3899b 80.66 2770b 82.74
L.S.D. at 5% 0.711 -- 7.67 165.5 -- 119.6
Phosphorus uptake
Also, data presented in Table 5 illustrate that
the plant uptakes of P was significantly affected
by variation in N-fertilizer forms. Application of N as MF boosting the uptake of P more than solely added as conventional forms (T2, T3 and T4) in both experiments of potato: Spunta and Diamant. The highest uptake of P was obtained with treatment of MF 75%AN+25%AS (T8), but
it was insignificant with that uptake at treatment
of MF 50%AN+50%AS (T9) in both experiments. Furthermore, MF of AS with U maximizes the
uptake of P more than individual application of 100%U (T2) in favor of MF 50%U+50%AS (T6). However, the plant uptake of P was higher with 100%AN rather than 100%AS or 100%U (Fig. 3). These results may be return to synergistic relationship between P and N, optimum supply
of N ensures optimum uptake of P (Barker and
Pilbeam 2007). However, the differences among treatments may be attributed to side effect of every treatment of N-fertilizer form. The use of different N-sources may directly affect the nutrition status
Fig. 1. Total N-uptake (kg fed-1) as affected by treatments
Egypt. J. Soil. Sci. 59
of plants due to changes in the rhizosphere, as
a result of modification in the ionic balance in
that soil fraction (Wei et al., 2009). The use of NH4+-N (as AS) causes an increasing hydrogen ionic (H+) excretion, leading to a decrease in soil pH. On the other hand, the use of NO3--N is associated with a decrease in H+ excretion and increasing rates of HCO3- or OH- ionics resulting in rise pH, especially when in combination with
Ca+2 (Marschner & Rӧmheld 1996 and Mengel &
Kirkby, 2001). This side effect had a positive or negative effect on the release of P and its uptake; positive at a decreased in soil pH and negative at raise pH.
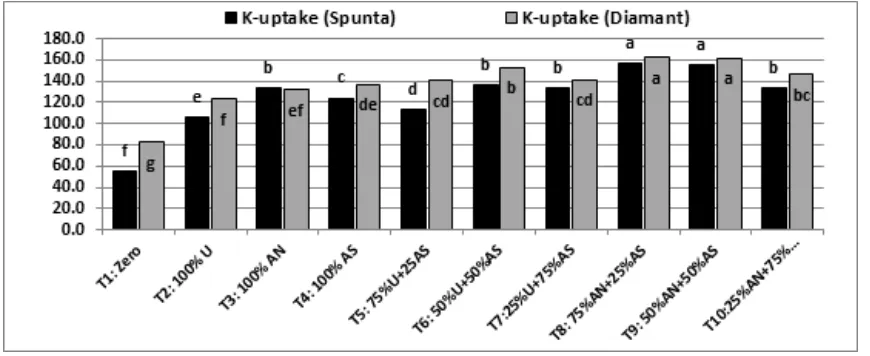
Potassium-uptake
Also, plant uptake of K significantly affected by
forms of N-fertilizer whether conventional forms or as mixed fertilizers for both varieties (Table 5). The highest plant uptake of K was obtained with N-fertilization as MF of 75%AN+25%AS, but
without significant differences with that uptake at
MF of 50%AN+50%AS. Also, MF treatment of 50%U+50%AS enhanced the plant uptake of K as compared with sole application of urea. However, the uptake of K was higher with AN than AS and U (Fig. 4).
Application of N as mixed fertilizer as treatments of T6, T8, T9 and T10 improved the plant uptake of K as compared other treatments. These results may be attributed to positive relationship between yields of tuber and starch and the uptake of K that had the same trend (Tables 3
and 4). The enzyme of starch synthetase is strongly activated by K+, therefore tuber content of starch is correlated by the uptake of K and vice versa. In addition, the greatest uptake of K with AN and MF of AN with AS rather other treatments forms may be return to role of K in NO3- mobilization; K+ acting as a counter ion for N0
3- transport in the xylem from the root to the shoot for reduction and assimilation; and after NO3- reduction as amino acids and organic anions, K+ again acts as counter ion from shoot to root (Mengel and Kirkby, 2001).
Quality of tuber yield
Quality of tuber yield is the main factor that determined price of yield and suitability for local consumption and export, as well as the suitability for processing. Dry matter % (DM), starch %, carbohydrate %, reducing sugar % and nitrate contents are considering the most important factors of tuber quality, especially DM and starch for processing potato cultivars (as Diamant). Results in Table 5 show that quality of tuber was
significantly affected by forms of N-fertilizer (as
traditional or MF) in both experiments of potato: Spunta and Diamant. Application N-requirements as mixed fertilizer of two N forms enhanced quality of tuber as compared with sole application of conventional N-fertilizer forms.
In Spunta variety; the highest tuber contents of DM (19.74%), starch (13.50%) and carbohydrates were obtained by treatment of MF: 25%AN+75%AS. However, in Diamant variety the highest tuber content of DM (22.45 %) and
starch (16.01) was gained with N fertilization as MF of 50%AN+50%AS. Furthermore, mixed fertilizers of T8, T9 and T10 enhanced quality of tuber (increased the content of DM, starch and carbohydrates) rather than conventional sole application of 100%U, 100%AN and 100%AS,
with significant differences in both varieties. These
results may be attributed to positive relationship between yields of tuber and starch, the uptake of K and tuber content of dry matter and carbohydrates that had the same trend (Tables 3, 4 and 5).
On the other hand, tuber content of reducing sugar and nitrate decreased with MF treatments as compared with sole application of one fertilizer form (where decreasing the tuber content of these two components are considering in quality). The lowest tuber content of nitrate and reducing sugar was obtained with treatment of MF: 25%U+75%AS and 25%AN+75%AS, but the highest content was gained at treatment of 100%U (T2). However, 100%AS and 100%AN had better effect on quality of tuber than 100%U, without
significant differences between AS and AN. In
this admiration, Ahmed et al. (2009) found that values of tuber quality (starch, dry matter and protein content) were the highest with application of N-fertilizer in the form of AN rather than the others (U and AS).
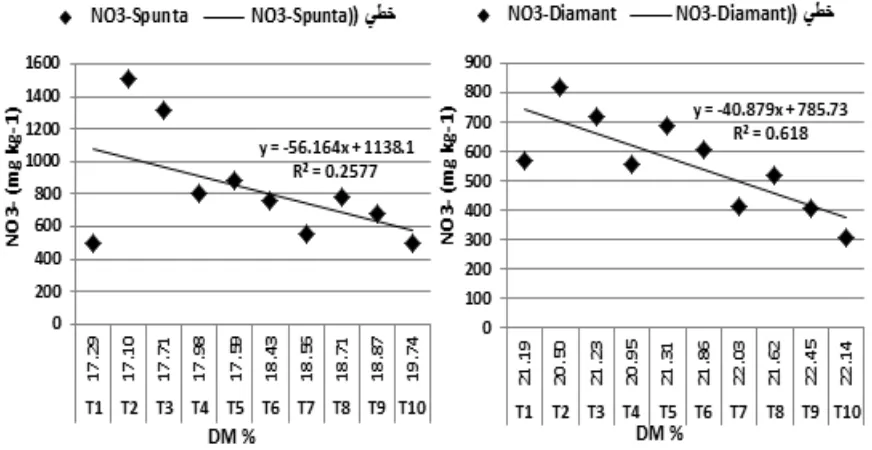
Relationship between DM and
NO3-Results shown in Fig. 5 illustrate tuber content of DM, NO3- and the relationship between them as regression. It is obvious from the trend line the negative relationship between them, when the
production of DM increased the accumulation of NO3- decreased for both potato experiments. Furthermore, data analysis as correlation showed
significant correlation between them, where the
correlation coefficient (r) values were -0.59* and
-0.822** for both varieties: Spunta and Diamant, respectively.
In general, tuber content of NO3- was lower than the critical level according to Mengel and Kirkby (2001), who reported that the critical level of NO3- is 2 mg per g (2000 mg kg-1) dry matter in vegetables and particularly in spinach; however in forage crops contents of up to 4 mg NO3- per g (4000 mg kg-1) dry matter are acceptable. Moreover, The other values of quality are suitable (good) for processing potato especially of Diamant variety, where these values are in accordance with quality requirements of potato for chip processing; i.e. 20-25% dry matter and 15-18% starch (Dua, 2018).
The previous mentioned results demonstrate that potato supply of N demand as a mixed fertilizer of two formulas; ammonium sulfate (AS)+ urea (U), or AS+ ammonium nitrate (AN) provides and enhancing potato yield and its quality as compared with sole application of every N-fertilizer alone. These results may be attributed to sulfur in
AS-fertilizer that boosting N utilization efficiency
and mobilization processing of N. Where under
conditions of S deficiency, the utilization of N
will be reduced, and consequently nonprotein N compounds, including nitrate accumulation
Egypt. J. Soil. Sci. 59
in plant tissue (Barker and Pilbeam, 2007).
These results agreed with Soliman et al. (2000), Khalil (2014) and Dua (2018), who reported the importance of ammonium sulphate fertilizer for potato production.
Economic evaluation
Data in Table 6 show comparison study among the treatments of N-fertilizer forms as economic assessment of potato yield. The inputs were; 290 L.E/50 kg urea fertilizer, 250 L.E/50 kg ammonium nitrate fertilizer and 200 L.E/ 50 kg ammonium sulphate fertilizer. Furthermore, 23600 L.E fed-1 other constant costs (400 L.E tillage, 350 L.E super phosphate fertilizer, 7150 L.E potato seeds, 900 L.E cost of planting, 600
L.E potassium sulphate fertilizer, 1200 L.E labors, 1500 L.E pesticides, 1500 L.E harvest and 10000 L.E rental value of land area “fed= 4200 m2”). The outputs were; gross return per feddan that calculated as “tuber yield*price of potato”, where price of potato range from 2.7 L.E (Spunta) to 3 L.E (Diamant) per kg of tuber (as 2700 to 3000 L.E t-1). The net return was calculated as “Gross return fed-1−Total cost fed-1”. Investment factor (IF) was calculated as “Gross return/Total cost”.
Spunta experiment
Data in Table 6 illustrate that application of N as 100%AS (T4) had the highest cost of N-fertilizer (2700 L.E); whereas the treatment of 100% U had the lowest cost (1885 L.E). For gross return per
TABLE 4. Effect of conventional forms of nitrogen fertilizers and some mixture percent’s of them as mixed fertilizer on NPK-uptake (kg fed-1)
Parameters→
Treatments↓
N-uptake P-uptake K-uptake
Tuber Straw Tuber Straw Tuber Straw
Spunta c.v. Experiment
T1: Control 32.5g 10.6e 3.15f 0.807e 40.9f 14.7g
T2: 100% U 56.4f 17.7d 5.54e 1.192d 81.3e 24.1f
T3: 100% AN 69.6d 19.8c 7.38bc 1.185d 106.9b 26.8e
T4: 100% AS 63.0e 21.8b 6.78d 1.380c 94.7c 29.4d
T5: 75%U+25AS 64.4e 20.4b 5.96e 1.341c 88.9d 24.9f
T6: 50%U+50%AS 77.0bc 22.0b 7.65b 1.546b 106.4b 29.5d
T7:25%U+75%AS 71.6d 22.4c 7.14cd 1.384c 102.8b 31.3c
T8: 75%AN+25%AS 77.7b 25.0a 8.23a 1.760a 117.0a 39.7a
T9: 50%AN+50%AS 82.2a 24.8a 8.27a 1.528b 118.7a 37.0b
T10:25%AN+75%AS 72.7cd 21.1bc 7.49bc 1.342c 103.1b 30.8cd
L.S.D. at 5% 4.33 1.32 0.436 0.120 4.81 1.69
Diamant
cv. Experiment
T1: Control 37.2e 13.3e 4.98g 0.97e 61.9g 20.8f
T2: 100% U 62.2d 24.2d 7.71f 1.65d 87.5f 35.6d
T3: 100% AN 74.6c 23.1d 9.06abc 1.73d 100.3de 31.1e
T4: 100% AS 70.4c 26.7c 7.91ef 1.85cd 94.2e 42.8b
T5: 75%U+25AS 71.9c 27.4c 8.12ef 2.04c 101.7d 38.8cd
T6: 50%U+50%AS 81.2b 30.1b 8.94bc 2.36ab 112.8b 40.1bc
T7: 25%U+75%AS 74.0c 27.9c 8.29de 2.10bc 99.6de 41.4bc
T8: 75%AN+25%AS 88.2a 32.3a 9.48a 2.43a 109.3bc 52.9a
T9: 50%AN+50%AS 92.1a 30.4ab 9.13ab 2.56a 121.1a 40.5bc
T10:25%AN+75%AS 88.1a 27.7c 8.67cd 2.37a 104.5cd 41.8bc
L.S.D. at 5% 5.43 2.04 0.447 0.266 6.58 3.53
feddan, N fertilization as MF of 75%AN+25%AS recorded the highest gross return, followed by that of MF 50%AN+50%AS then 50%U+50%AS. Also, treatment of MF 75%AN+25%AS had the highest net return followed by 50%AN+50%AS, but the lowest net return was obtained with treatment of 100%U. However, the treatment of MF 50%AN+50%AS had the highest investment factor (2.12).
Diamant experiment
Also, N fertilization as MF of 75%AN+25%AS was gained the highest gross return and the highest net return per feddan followed by MF treatments 50%U+50%AS then 50%AN+50%AS,with high values of IF; 2.19, 2.15 and 2.12, respectively.
In general, the previous results illustrated that application of potato N-demands as mixed fertilizer (MF) of 50%AN+50%AS, 75%AN+25%AS or 50%U+50%AS were the best treatments (as respectively) for yield, quality,
nutrients uptake and N utilization efficiency than
individual application as conventional forms of 100%AN, 100%AS or 100%U. Furthermore, applications of N as these forms of MF maximize
profitability of yield in the both experiments
(Spunta and Diamant). In addition, application of N as these pervious mentioned MF could be declined the load or request on AN-fertilizer, as
well as enhancing the use efficiency of applied
N-fertilizers, and consequently could reduce the added rate of N. Therefore, application of AS-fertilizer along with AN or U as mixed AS-fertilizer has become very important.
Conclusion
Under the ecological conditions of clayey loam soils (Dakahlia Governorate, Egypt), it can be concluded that application of potato N-demands as mixed fertilizer of 50%AN+50%AS or 75%AN +25%AS or 50%U+50%AS; are the best N-fertilizer forms for optimize tuber yield and its quality and
profitability, whether from the two potato varieties;
non industrial (Spunta) or industrial (Diamant).
Egypt. J. Soil. Sci. 59
TABLE 5. Effect of conventional forms of nitrogen fertilizers and some mixture percent’s of them as mixed fertilizeron quality of tuber yield
Parameters→ Treatments↓
D M
% Starch% Carbohydrates % Reducing sugar % NO3
-(mg kg-1)
Spunta cv. Experiment
T1: Control 17.29ef 11.32ef 53.52f 30.00c 502f
T2: 100% U 17.10f 11.15f 57.38f 39.83a 1504a
T3: 100% AN 17.71d 11.69d 65.50e 36.83ab 1312b
T4: 100% AS 17.98d 11.93d 73.17cd 33.83b 806cd
T5: 75%U+25AS 17.59de 11.59de 79.33ab 27.17c 884c
T6: 50%U+50%AS 18.43c 12.33c 69.17de 27.67c 762de
T7:25%U+75%AS 18.56bc 12.44bc 74.83bc 28.00c 555f
T8: 75%AN+25%AS 18.71bc 12.58bc 74.33ab 27.33c 785cde
T9: 50%AN+50%AS 18.87b 12.73b 65.00e 23.00d 681e
T10:25%AN+75%AS 19.74a 13.50a 80.50a 30.00c 502f
L.S.D. at 5% 0.397 0.355 4.63 3.23 113.8
Diamant cv. Experiment
T1: Control 21.19e 14.88e 63.50f 16.50b 567de
T2: 100% U 20.50g 14.27g 74.17e 23.17a 822a
T3: 100% AN 21.23e 14.92e 81.83abc 15.17bcd 719b
T4: 100% AS 20.95f 14.67f 80.00bcd 12.50e 555de
T5: 75%U+25AS 21.31e 15.00e 77.83d 16.00bc 690bc
T6: 50%U+50%AS 21.86c 15.48c 79.33cd 13.17de 608cd
T7:25%U+75%AS 22.03b 15.63b 78.33d 9.17f 415f
T8: 75%AN+25%AS 21.62d 15.27d 81.17abc 14.50bcde 517e
T9: 50%AN+50%AS 22.45a 16.01a 82.17ab 13.83cde 410f
T10:25%AN+75%AS 22.14b 15.73b 82.83a 10.00f 306g
L.S.D. at 5% 0.156 0.141 2.69 2.48 90.8 U (urea 46%N); AN (ammonium nitrate 33.5%N); AS (ammonium sulphate 20.6%N).
TABLE 6. Economic evaluation of tuber yield as affected by treatments of N fertilizer
Variables →
Treatments ↓
Cost of
N-fertilizer (L.E) Total costs (L.E) Tuber yield (t.fed-1)
Gross return (L.E)
Net return
(L.E) IF
*
1st Experiment (Spunta c.v.):
T1: Control 0 23600 9.217 24887 1287 1.05 T2: 100% U 1891 25491 15.058 40656 15165 1.59 T3: 100% AN 2240 25840 18.188 49106 23266 1.90 T4: 100% AS 2700 26300 16.973 45826 19526 1.74 T5: 75%U+25AS 2098 25698 16.500 44551 18853 1.73
T6: 50%U+50%AS 2295 25895 18.553 50094 24199 1.93
T7:25%U+75%AS 2502 26102 17.013 45936 19834 1.76
T8: 75%AN+25%AS 2357 25957 20.020 54053 28096 2.08
T9: 50%AN+50%AS 2470 26070 20.457 55233 29163 2.12 T10:25%AN+75%AS 2587 26187 18.340 49519 23332 1.89
2nd Experiment (Diamant c.v.):
T1: Control 0 23600 10.184 30552 6952 1.29 T2: 100% U 1891 25491 15.465 46395 20904 1.82 T3: 100% AN 2240 25840 16.808 50424 24584 1.95 T4: 100% AS 2700 26300 16.194 48582 22282 1.85 T5: 75%U+25AS 2098 25698 16.272 48816 23118 1.90
T6: 50%U+50%AS 2295 25895 18.519 55557 29662 2.15
T7:25%U+75%AS 2502 26102 16.763 50289 24187 1.93
T8: 75%AN+25%AS 2357 25957 18.930 56790 30833 2.19
T9: 50%AN+50%AS 2470 26070 18.466 55398 29328 2.12 T10:25%AN+75%AS 2587 26187 17.606 52818 26631 2.02
References Ahmed A.A., Zaki, M.F., Shafeek, M.R., Helmy,Y.I.
and Abd El–Baky, M.M.H. (2015) Integrated use of farmyard manure and inorganic nitrogen fertilizer on growth, yield and quality of potato (Solanum tuberosum L.). Int. J. Curr. Microbiol. App. Sci.,
4 (10), 325-349.
Ahmed A., EL-Baky, M. A., Ghoname, A., Riad, G. and El-Abd, S. (2009) Potato tuber quality as affected by nitrogen form and rate. Middle Eastern
and Russian J. of Plant Sci. and Biotechnology,
3 (special issue 1), 47-52 © 2009 Global Science Books.
A.O.A.C. (2012) “Official Methods of Analysis of the Association of Official Analytical Chemists”. 19th
Ed., Washington, D.C.
Barker Allen V. and David J. Pilbeam (2007)
“Handbook of Plant Nutrition” CRC, Taylor & Francis Group, Boca Raton London New York (1st
Ed.), Pp: 50-220.
Burton, W. G. (1948) The Potato. Chapman and Hall, London. Pp.319.
Das D. K. and Mandal, M. (2015) Advanced technology of fertilizer uses for crop production. Fertilizer Technology Vol. 1: Synthesis, pp.18-68. https:// www.Researchgate.net/publication/299392904. Dogras, C., Siomos, A. and Psomakelis,C. (1991)
Sug-ar and dry matter changes in potatoes stored in a clamp in a mountainous region of Northern Greece. Potato Res. 34, 211-214.
El-Gabaly S. (2015) “Fertilizers Industry in Egypt”,
Report: Present and Future”. Ministry of Investment, Egypt.
EU Nitrogen Expert Panel (2015) Nitrogen Use Efficiency (NUE) - an indicator for the utilization of nitrogen in agriculture and food systems. Secretariat: Wageningen University, Alterra, PO Box 47, NL-6700 Wageningen, Netherlands; Website: www.eunep.com.
Evans A., Lucas, D. and Blaesing, D. (2016) Nitrogen use efficiency (NUE) and tools for farmer engagement: a good reason for being imprecise. International Nitrogen Initiative Conference, “Solutions to improve nitrogen use efficiency for the world”, 4–8 December 2016, Melbourne, Australia. www.ini2016.com.
FAO (2015) “Statistical Yearbook”. Food and Agriculture Organization (FAO), Rome, Italy. Forde, B.G. and Clarkson, D.T. (1999) Nitrate and
ammonium nutrition of plants: physiological and molecular perspectives. Adv. Bot. Res. 30, 1-90. Gomez, K. A. and A. A. Gomez (1984) “Statistical
Procedures for Agricultural Research”. 2nd ed.
John Wiely and Sons, Pp. 680.
Güler, S. (2009) Effects of nitrogen on yield and chlorophyll of potato (Solanum tuberosum L.) cultivars. Bangladesh J. Bot. 38 (2), 163-169. Hesse, P. R. (1971) “A Text Book of Soil Chemical
Analysis”. Juan Murry (Publisher) Ltd, London.
IFA (2014) “Fertilizer Outlook 2014-2018”, Patrick Heffer and Michel Prud’homme. 82nd IFA
(International Fertilizer Industry Association) Annual Conference, Sydney, May 2014.
Ismail A. and Abu-Zinada, I. (2009) Potato response to potassium and nitrogen fertilization under Gaza strip conditions. J. of Al Azhar University-Gaza (Natural Sciences), 11, pp. 15-30.
Karadogan, T. (1995) Effect of nitrogen fertilizer sources and application dates on yield and yield components of potatoes. Turk. J. Agric. Forestry,
19(6), 417-421.
Khalil, A. A. (2014) Growth, yield, quality and nutrient uptake of potato (Solanum tuberosum, L.) as affected by two nitrogen sources applied at various ratios. J. Soil Sci. and Agric. Eng., Mansoura Univ., Vol. 5 (7), 1067-1076.
Laboski, C.A.M. and Kelling, K. A. (2007) Influence of fertilizer management and soil fertility on tuber specific gravity: a review. Am. J. Potato Res., 84, 283-290. MALR (2014) “Potato Production”. Ministry of
Agricultural and Land Reclamation, Egypt. Marouani A., Behi,O., Ben Ammar, H., Sahli, A. and
Ben Jeddi, F. (2015) Effect of various sources of nitrogen fertilizer on yield and tubers nitrogen accumulation of spunta potato cultivar (Solanum tuberosum L.). J. of New Sciences,Agriculture and Biotechnology,13 (1), 399-404.
Egypt. J. Soil. Sci. 59 Marschner, H. (1995) “Mineral Nutrition of Higher
Plants”. Academic, Elsevier, 2nd ed. Academic
Press, London, UK., Pp. 229-242.
Mengel, K. and Kirkby, E. A. (2001) “Principles of Plant Nutrition”. (5th ed.), Kluwer Academic Publishers,
Inter. Potash Institute, Bern, Switzerland.
Page, A. L. (1982) Methods of Soil Analysis. Part 2: Chemical and microbiological properties, (2nd Ed.).
Am. Soc. at Agron. Inc. Soil Sci. Soc. of Am. Inc., Madison, Wisconsin, VSA.
Pilbeam D.J. and Kirkby, E. A. (1992) Some aspects of the utilization of nitrate and ammonium by plants. In: Mengel K., Pilbeam DJ (Ed.), Nitrogen
Metabolism of Plants. Clarendon Press, Oxford Pp.
55-70.
Sharma L. K. and Bali,S. K. (2018) A review of methods to improve nitrogen use efficiency in agriculture.
Sustainability, 10, 51, doi:10.3390/su10010051;
www.mdpi.com/journal/sustainability.
Singh, J. P. (1988) A rapid method for determination of nitrate in soil and plant extracts. Plant and Soil J.,
110, 137- 139.
Soliman, E. M., El-Bahairy, U. A., El-Kabbany, E. A. and Khatab, K. A. (2000) Effect of sources and rates of nitrogen fertilization on growth, yield and tuber quality of potatoes. Ann. Agricult. Sci., 3 (Special Issue): 1111-1126.
VK Dua, (2018) “Nutrient Management in Potato
Production”. Central Potato Research Institute,
Shimla (HP) 171 001.
Wei GP., LF.Yang; YL.Zhu and G.Chen (2009) Changes in oxidative damage, antioxidant enzyme activities and polyamine contents in leaves of grafted and non-grafted eggplant seedlings under stress by excess of calcium nitrate. Sci. Hortic., 120, 443-451.
Westermann, D.T. (1993) “Fertility Management”. In: Rowe, R.C. (Ed.), Potato Health Management.
American Phytopathological Society Press, USA. Pp. 77-86.
Westermann, D.T. and Sojka, R.E. (1996) Tillage and nitrogen placement effects on nutrient uptake by potato. Soil Sci. Soc. Am. J., 60, 1448 1453. Wong, Z. and S. Li (2004) Effect of nitrogen and
phosphorus fertilization on plant growth and nitrate accumulation in vegetables. Plant Nutrition J., 27 (3), 539-556.
Zebarth B. J. and Rosen, C. J. (2007) Research perspective on nitrogen BMP development for potato. Am. J. Potato Res., 84, 3-18.
Zebarth B. J., Leclerc, Y. and Moreau,G. (2004) Rate and timing of nitrogen fertilization of Russet Burbank potato: nitrogen use efficiency. Can. J. Plant Sci., 84, 845-854.
Zebarth Bernie, J., Gilles Bélanger, Athyna N. Cambouris, and Noura Ziadi (2015) Nitrogen Fertilization Strategies in Relation to Potato Tuber
صاصتماو هتدوجو سطاطبلا لوصحم ىلع ةطولخملاو ةيديلقتلا ةينيجورتينلا ةدمسلأا ريثأت
ةيئاذغلا رصانعلا
ىقوسدلا ضوع ناضمررصم - ةزيجلا - ةيعارزلا ثوحبلا زكرم - ةئيبلاو هايملاو يضارلأا ثوحب دهعم