Vol.8 (2018) No. 6
ISSN: 2088-5334
The Use of GIS and Hydrodynamic Model for Performance Evaluation
of Flood Control Structure
I Gede Tunas
#and Rizaldi Maadji
*#
Department of Civil Engineering, Universitas Tadulako, Palu, 94117, Indonesia E-mail: [email protected]
* Department of Civil Engineering and Environment, Universitas Gadjah Mada, Yogyakarta, 55281, Indonesia E-mail: [email protected]
Abstract— Flood disaster in Palu River has repeatedly occurred with varying discharge magnitudes, especially in the downstream segment near and around the estuary. The most recent flood occurred in July 2018 has inundated some areas of Palu City and resulted in a considerable impact on the socio-economic life of the community in the city of Palu. Actually, flood prevention efforts have been undertaken by the Palu City Government and River Basin Board of Sulawesi III, one of which is by constructing levee combined with revetment along more than 5 km measured from the estuary to the upstream reach. The levee is made of soil material, while the revetment is a structure to protect the levee made of concrete. These structures were built on both sides of the river banks. However, the flood disaster always happens almost every year in this area. This paper intends to evaluate the performance of the flood control structure using Geographic Information System and HEC-RAS hydrodynamic model. The use of these tools provides the ease and efficiency of flood simulation along the river being modeled. The analysis results show that the bank capacity of Palu River is currently only effective for flood discharge below 550 m3/s, where the river bank capacity at the beginning of the levee and revetment design is approximately 550 m3/s, equivalent to the 25 years return period of discharge. The river bank capacity decreases due to sediment deposition on the river bed which were originated from the upstream watershed. This decline in cross-section capacity is estimated to be the cause of the flood disaster in parts of Palu City.
Keywords— flood disaster; mitigation; river bank capacity; river basin.
I. INTRODUCTION
One of the natural phenomena that are difficult to predict the magnitude and time of occurrence is a flood. Flooding in the river is strongly influenced by the main variable forming the flow such as rainfall which is transformed to run off in the watershed system [1]. Rainfall characteristics with large spatial and temporal variability cause flood with high probabilistic and stochastic characteristic. In other words, flooding in the river can occur at any time with varying discharges [2-4].
In principle, flood flow in the river is defined by the characteristic of exceeded bank capacity [5]. This can occur other than by rainfall factors as a trigger, also strongly influenced by watershed characteristics, river morphology and sediment transport conditions in the estuary [6-7]. The river basin is a unified system that transforms rainfall into run off with its various characteristics [8]. The principle of transformation follows two basic concepts of hydrology, i.e., hydrologic cycle and water balance. The watershed parameters that influence the flood characteristics are land
use changes, both naturally occurring and human exploiting to improve the people welfare. Physical changes that occur in the watershed will directly affect the ability of watershed retention in the upstream zone [9]. Degradation of watershed retention capability due to changes in land use affects the run-off and surface erodibility that lead to large flows with high sediment concentrations [10].
In relation to the phenomenon and possible flood impact, an early analysis is needed in the form of flood routing [11] to optimize flood disaster management activities at an advanced stage. Basically, disaster management includes three main issues: mitigation includes monitoring, prevention, and preparedness, evacuation includes rescue and emergency relief and rehabilitation services including reconstruction and restoration of the situation to normal on physical and nonphysical facilities [12-13]. This analysis is indispensable to provide preliminary information related to flood mitigation and control in the flood disaster management framework.
provided many conveniences, mainly for spatial-based data analysis related to the preparation of river geometry within the framework of routing and simulating flood flows [[14], [15]. Currently, the implementation and application of GIS have evolved for a variety of purposes with a more diverse field and broader area. One of GIS application tools in the river hydraulics field is HEC-GeoRAS, an extension module (add-on program) under ArcGIS operation [16]. This extension was developed to construct the attributes of river geometry in the form of geospatial data compiled with HEC-RAS, in order to obtain more accurate simulation results according to the characters in the prototype. Therefore, the use of a geographic information system is expected to improve the accuracy of the analysis by simulating the actual river model.
II. MATERIAL AND METHOD
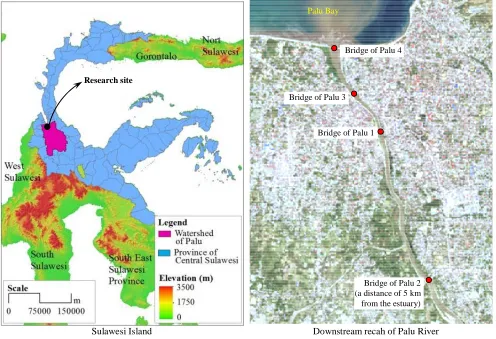
A. Research Site
The location of this research was in the Palu Watershed, especially on downstream Palu River (Fig. 1). Administratively, Palu Watershed is located in Sigi and Palu Regency of Central Sulawesi Province which stretches from South to North and to be the part of Palu-Lariang River Basin. The site of the watershed was situated between longitudes 119°43'45.90"E–120°19'14.54"E and latitudes 0°49'45.14"S a1°35'44.01"S. The watershed has a total area
of approximately 3,048 km2, which consists of many tributaries that flow along the main channel of the Palu River. It was usually considered to be the third largest basin in Central Sulawesi, after Lariang and Bongka Watersheds where each is located in the west and east of the watershed. The basin provides many benefits to Palu Valley especially for drinking water supply, irrigation, micro-hydropower, local recreation, wildlife habitat, and economic resources.
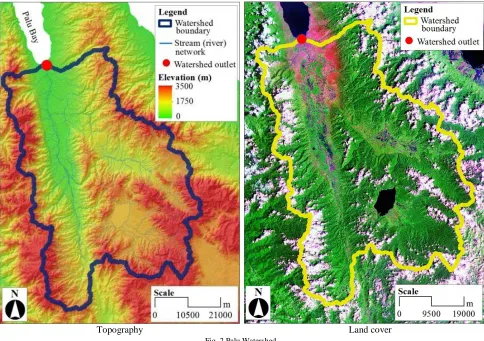
The topography of the watershed was mostly a mountainous area with various valleys and miscellaneous stream [17]. The mountainous area dominates in the in the upper and middle zone of the watershed. The flat area was generally found in the lower zone of the watershed and was mostly used for agriculture, plantation, settlement and urban area (Fig. 2).
Most of the upper basin was covered by the Lore Lindu rainforest, which is a protected area of forest in Central Sulawesi, namely Lore Lindu National Park. The park covers an area of about 2,180 km2, with the primary function as conservation of biodiversity and natural resources. The boundaries of the park are defined by the Palolo Valley to the north, Napu Valley to the east and Bada Valley to the south. Because of the uniqueness of flora, fauna, megalithic sites, landscape, culture, and human tradition, the park was inaugurated as UNESCO World Network of Biosphere Reserves in 1977 [18].
Sulawesi Island Downstream recah of Palu River
Palu Bay
Bridge of Palu 1
Bridge of Palu 2 (a distance of 5 km
from the estuary) Research site
Bridge of Palu 3
Bridge of Palu 4
Fig. 1 Location map of the research site
The land cover of the watershed tends to change from year to year. The land cover changes intensively in the middle and lower area of watersheds due to the development
light green color indicate that there has been a change of land cover from forest to plantation or cultivation area.the settlement, residential and urban areas were marked by red color, which dominates in the lower area of the watershed. The change of land cover is predicted as one cause of the increase of runoff in Palu River, which induced flooding in recent years. Nevertheless, the control of land cover changes has also been intensively undertaken by various stakeholders,
especially the Watershed Management Board of Palu-Poso (BPDAS) and Forestry Agency of Central Sulawesi Province.
Palu Watershed has eight major sub-watersheds namely Sombe Lewara, Kawatuna, Paneki, Gumbasa, Bangga, Wera, Miu, and Wuno sub-watersheds. The main river was formed by some confluences, which were Gumbasa River in the right side and Miu River in the left side of the watershed. It is considered as an alluvial river, carrying large amounts of sediment to the ocean mainly in a rainy season.
Topography Land cover
Fig. 2 Palu Watershed
Basical[==]\ly, the Palu River is formed by a series of meanders from upstream reach to downstream reach with a length of approximately 90 km. Cross section width of the main river varies between 40 meters to 80 meters in the middle and downstream section, while in the upstream section ranges from 30 to 50 meters. The length of the river has been modeled approximately 5 km with the width between 60 and 80 m.
B. Data
The data to be collected for the research were water level and tidal data, Digital Elevation Model (DEM) of Palu River along approximately 5 km, land use and the type of river bed material to determine the roughness coefficient of Manning. Most data were obtained from River Basin Bureau of Sulawesi III-Ministry of Public Work and Housing Republic of Indonesia and Water Resources Board of Central Sulawesi Province. Observations were also conducted to find water level and tidal data at the same time at two points in the river that is at Bridge of Palu 1 and Bridge of Palu 4. All
data would be used as the input of a hydrodynamic model for flow simulation under some conditions.
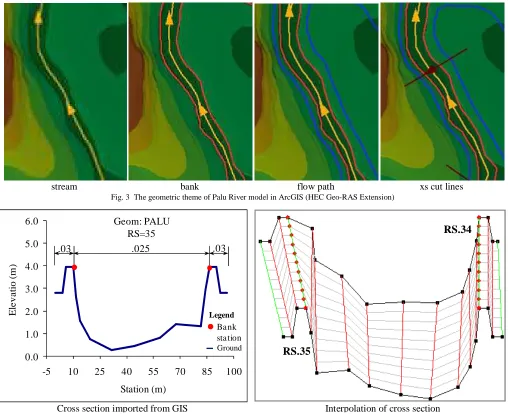
C. Creating River Geometric
Preparation of river geometry model is performed by using a geographic information system approach. This arrangement is carried out through geoprocessing (GIS) and import geometric in GIS analysis. By using the HEC-GeoRAS extension on the GIS Arc can be created all the geometric attributes of the model to be imported by HEC-RAS. The geometric scope of this model includes stream centreline, banks, flow path, and xs cut lines creation streams that are modeled (Fig. 3).
on the type of bed material of the river channel and the type of vegetation and land use on the side banks of the river.
The process of arranging river geometry using GIS as shown in Fig. 3, produces a cross-section of the river at the desired points depending on the profile of the river modeled. The number of river cross section made is as many as 110 pieces with an average cross-section distance of 50 m on the
straight channel and 25 m at the bend. One of the cross-sections of river geometry arranged using GIS is as shown in Fig. 4 on the left side. Fig. 4 on the right side presents the interpolation of a cross-section of the river to shorten the distance between cross sections if required for stability of simulation.
stream bank flow path xs cut lines
Fig. 3 The geometric theme of Palu River model in ArcGIS (HEC Geo-RAS Extension)
Cross section imported from GIS Interpolation of cross section
0.0 1.0 2.0 3.0 4.0 5.0 6.0
-5 10 25 40 55 70 85 100
E
le
v
a
ti
o
(
m
)
Station (m)
.025 .03
.03
RS=35 Geom: PALU
Legend Ba nk sta tion
Ground
RS.35
RS.34
Fig. 4 Cross section based on GIS and HEC-RAS processing
D. Evaluation of Flood Control Structure Performance
The hydraulic flow simulation is carried out using the HEC-RAS hydrodynamic model to determine the bank capacity and the ability of the flood control structure (levee) to pass the discharge. Calibration and verification are also done for controlling model performance by setting up the Manning roughness number so that the water level simulation results near the water level of the measurement result [19], [20].
The simulation is performed with the upstream boundary condition in the form of flood hydrograph (25 year return period of discharge) as shown in Fig. 5 and the downstream boundary condition in the form of a tidal curve generated based on the constants obtained through tidal harmonic analysis of the measurement data for 30 days (Fig. 6). Calibration is done by adjusting the Manning roughness
coefficient and comparing the suitability of the simulated water level with the measured water level at a certain point in the river
0 150 300 450 600
0 3 5 8 10 13 15 18 20 23 25
D
is
c
h
a
rg
e
(m
3/s
)
Time (hour)
Q25 year
-2 -1 0 1 2 3
0 2 4 6 8 10 12 14 16 18 20 22 24
W
a
te
r
L
e
v
e
l
(m
)
Time (hour)
Fig. 6 Tidal curve as a downstream boundary condition
III.RESULTS AND DISCUSSION
A. The Capacity of Flood Control Structure
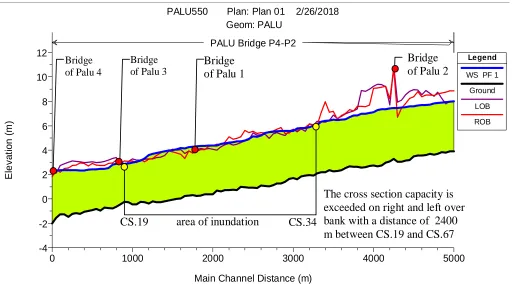
Based on the hydraulic simulation conducted in Palu River on the downstream segment, it can be seen the water level elevation every hour in each cross section during the simulation time (Fig. 7). The water level elevation that defines the flood or not in a cross-section is the water level that goes beyond the bank capacity. Therefore, the parameters to be discussed and analyzed for flood evaluation and control are the maximum water level that exceeds the cross-section capacity.
0 1000 2000 3000 4000 5000
-4 -2 0 2 4 6 8 10 12
PALU550 Plan: Plan 01 2/26/2018 Geom: PALU
Main Channel Distance (m)
E
le
v
a
ti
o
n
(m
)
Legend
WS PF 1
Ground
LOB
ROB PALU Bridge P4-P2
Bridge of Palu 4
Bridge of Palu 3
Bridge
of Palu 1
Bridge
of Palu 2
The cross section capacity is
exceeded on right and left over
bank with a distance of 2400
m between CS.19 and CS.67
CS.19
area of inundation
CS.34
Fig. 7 Longitudinal profile of water level for 550 m3/s of discharge
TABLEI
PARAMETERS SIMULATION OUTPUT IN CS.34
Parameters Value Parameters Left
OB Channel Right OB
Energy Grade Line Elevation (m) 4.43 Conveyance Weighted Manning 0.025
Velocity Head (m) 0.29 Reach Length (m) 50 50 50
Water Surface Elevation (m) 4.14 Flow Area (m2) 231.22
Bank Elevation (m) 3.74 Flow Area (m2) 231.22
Energy Grade Line Slope (m/m) 0.000898 Flow (m3/s) 550
Total Flow (m3/s) 550 Top Width (m) 80.4
Top Width (m) 80.4 Average Velocity (m/s) 2.38
Velocity Total (m/s) 2.38 Hydraulic Depth (m) 2.88
Maximum Channel Depth (m) 3.89 Conveyance (m3/s) 18352.6
Conveyance Total (m3/s) 18352.6 Wetted Perimeter (m) 82.72
Weighted Length (m) 50 Shear (N/m2) 24.62
Minimum Channel Elevation (m) 0.25 Stream Power (N/m s) 3849.39 0 0
Alpha 1 Cumulative Volume (1000 m3) 424.67
From the simulation, it can be known that with the discharge of 550 m3/s, some cross section on the simulated segment has reached its capacity. This can be seen from the simulation output for example at CS.34, that water surface elevation is higher than bank elevation on both sides (Table 1). Simulations are repeated by providing upstream discharge inputs under some conditions for obtaining a
discharge that defines the river cross-section capacity. If the water level on a cross-section has reached the levee elevation either on the left or on the right side of the path the simulation is stopped, and the discharge at this condition is expressed as the bank capacity representing all the modeled segments. The simulation results at design discharge of 25 year return period are represented in Fig. 7.
Fig. 8 Water level based on simulation using HEC-RAS
The cross sections that have reached capacity at 550 m3/s of discharge are from CS.19 to CS.67 (Fig. 7). If the water level line is above bank elevation, then the bank capacity is exceeded (Fig. 8 on the left side), and vice versa. The bank capacity is marked by the water level line below bank elevation (Fig. 8 on the right side).
For determining the bank capacity, hydraulic simulation is performed by retrying the flood discharge input at the upper
boundary. Reduced peak discharge hydrograph discharge is done gradually, and then the water level at each cross section can be evaluated
If the water level is still below the elevation of the levees, the peak flood hydrograph discharge is reduced again. This is done repeatedly until the water level equals the elevation of the freeboard.
0 1000 2000 3000 4000 5000
-4 -2 0 2 4 6 8 10 12
PALU400 Plan: Plan 01 2/26/2018 Geom: PALU
Main Channel Distance (m)
E
le
v
a
ti
o
n
(
m
)
Legend
WS PF 1 Ground
LOB
ROB
PALU Bridge P4-P2
Bridge of Palu 4
Bridge of Palu 3
Bridge
of Palu 1
Bridge
of Palu 2
Minimum capacity of CS.19 (LOB)
Minimum capacity of CS.34 (ROB)
Cross section in beginning of construction
Cross section after sedimentation
0.0 0.8 1.5 2.3 3.0 3.8 4.5-5 10 25 40 55 70 85 100
E le v a ti o n ( m ) Station 0.0 0.8 1.5 2.3 3.0 3.8 4.5
-5 10 25 40 55 70 85 100
El e v a ti o n ( m ) Station Left side levee Right side levee Revetment
Initial river bed
River bed after sedimentation Water level line
at effective bank capacity Water level line at
bankfull capacity
Top of levee or bankfull elevation
Deposition of sediments decrease bank capacity
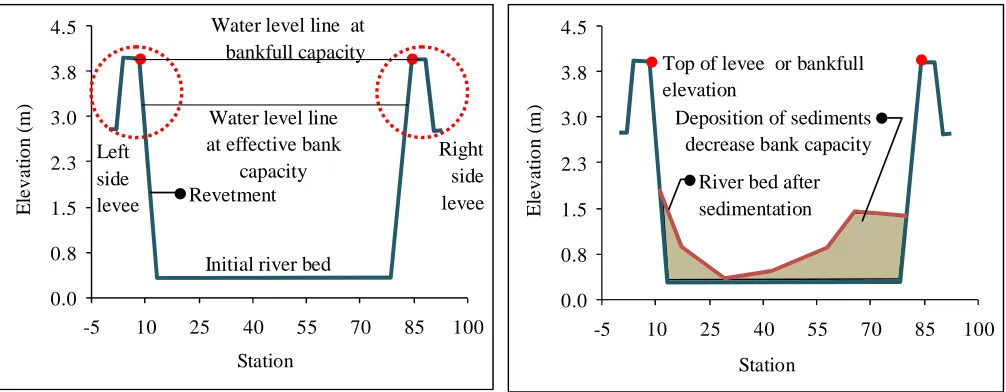
Fig. 10 Sedimentation on the river bed
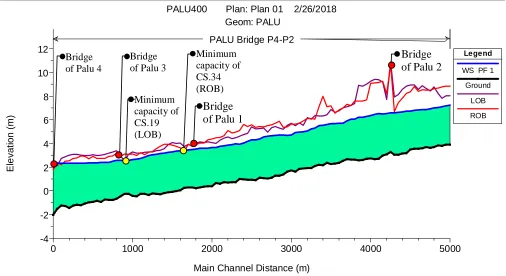
Based on a series of simulations performed, the river cross-section capacity was met at a discharge of 400 m3/s (Fig. 9). The capacity of the river cross section is reduced from the initial capacity of levee and revetment construction — a capacity reduction of 27.3%, primarily on CS.19 to CS.67 segment along 2400 m. The decrease of bank capacity in this segment is estimated to be caused by sediment deposition in the river channel coming from a tributary in upstream watersheds such as Sombe-Lewara River which carry a very high sediment concentration (Fig. 10).
B. The Benefit of using GIS and Hydrodynamic Model
The use of GIS for the arrangement of river geometry and the use of the HEC-RAS Hydrodynamic Model provides many advantages [9]. The input of river geometric data can be done more effectively and efficiently. The time required is much shorter than compiling the river geometry directly in the HEC-RAS Program. In addition, the integration of GIS data with the HEC-RAS Hydrodynamic Model can further improve the accuracy of the simulation results, since manual data entry errors can be solved using GIS. In addition, with the development of current topographic measurement technology, DEM data can be obtained more easily. Thus topographic measurements can be done in a short time.
However, data accuracy and simulation results also depend on the resolution of DEM used. Nowadays, DEM with very high resolution can be obtained but at a cost that is still relatively expensive.
IV.CONCLUSION
The use of geographic information systems and HEC-RAS Hydrodynamic Model provides the ease and efficiency for flood simulation in the river. River geometric arrangement can be made more efficiently, especially in defining the situation, cross-section, and roughness number. In addition, correction and modification of the cross section can be done well. However, the accuracy of river geometry results is highly dependent on the resolution of DEM data.
The simulation results show that the Palu River cross-section is currently only useful for flood discharge below 550 m3/s, where the river bank capacity at the beginning of
the levee and revetment design is 550 m3/s, equivalent to the 25 year return period of discharge. The river bank capacity decreases due to sediment deposition on the river bed which was originated from the upstream watershed. This decline in cross-section capacity is estimated to be the cause of the flood disaster in parts of Palu City in June 2017
ACKNOWLEDGMENT
Authors thank the River Basin Bureau of Sulawesi III-Ministry of Public Work and Housing Republic of Indonesia and Water Resources Board of Central Sulawesi Province for providing the rainfall and discharge data at the study area. Authors also thank all those who participated in this research, especially in collecting and analyzing data.
REFERENCES
[1] Y. Zhu, Z. Lin, Y. Zhao, H. Li, F. He, J. Zhai, L. Whang, and Q. Wang, “Flood simulations and uncertainty analysis for the Pearl River Basin using the coupled land surface and hydrological model system,” Water, vol. 9, pp.-, 2017
[2] S. Afsharia, A.A. Tavakolyb, M.A. Rajib, X. Zheng, M.L. Follumb, E. Omraniane, and B.M. Feketef, “Comparison of new generation low-complexity flood inundation mapping tools with a hydrodynamic model,” Journal of Hydrology, vol. 556, pp. 539-556, Jan. 2018 [3] M. Farid, H.H. Pusparani, M.S.B. Kusuma, and S. Nastasaputra,
“Study on effectiveness of flood control based on risk level: a case study of Kampung Melayu Village and Bukit Duri Village,” in
MATEC Web of Conferences, 2017, paper 05003, p.-
[4] D. Indrawati, I.K. Hadihardaja, M.B. Adityawan, S.F. Pahrizal, and F. Taufik, “Diversion canal to decrease flooding (Case study: Kebon Jati Kalibata Segment, Ciliwung River Basin,” in MATEC Web of
Conferences, 2018, paper 03006, p.-
[5] J. Nugroho, I. Soekarno, and D. Harlan, “Model of Ciliwung River flood diversion tunnel using HEC-RAS software,” in MATEC Web of
Conferences, 2018, paper 03001, p.-
[6] N.A. Harun, M. Makhtar, A.A. Aziz, Z.A. Zakaria, F.S. Abdullah, and J.A.Jusoh, “The application of apriori algorithm in predicting flood areas,” International Journal on Advanced Science
Engineering Information Technology, vol. 7(3), pp. 763-769, Jun.
2017
[7] N.T. Hong, P.T.T. Truc, N.D. Liem, and N.K. Loi, “Optimal selection of number and location of meter-hydrological monitoring networks on Vu Gia–Thu Bon River Basin using GIS,” International
Journal on Advanced Science Engineering Information Technology,
[8] S. Harto, Hydrology: Theory, Problem, and Solving, 1st ed., Nafiri Offset, Yogyakarta, 2000. [in Indonesian]
[9] I.G. Tunas, Simulation Model of Flood Control System Using HEC-RAS and GIS, M. Eng. Thesis, Universitas Gadjah Mada, Yogyakarta, Indonesia, Apr. 2004. [in Indonesian].
[10] M.K.A. Kamarudin, M.E. Toriman, N.A. Wahab, Hafiz Rosli, F.M. Ata, and M.N.M. Faudzi, “Sedimentation study on the upstream reach of selected rivers in Pahang,” International Journal on
Advanced Science Engineering Information Technology, vol. 7(1), pp.
35-41, Feb. 2017
[11] V.B. Mitková, P. Pekárová, P. Miklánek, and J. Pekár, “Hydrological simulation of flood transformations in the upper Danube River: a Case study of large flood events,” Journal of Hydrology and
Hydromechanics, vol. 64(4), pp. 337-348, Dec. 2016
[12] P.J.A. Baan, and F. Klijn, “Flood risk perception and implications for flood risk management in the Netherlands,” International Journal of
River Basin Management, vol. 2(2), pp. 113-122, 2004
[13] A. Domeneghetti, S. Gandolfi, A. Castellarin, L. Brandimarte, G.D. Baldassarre, M. Barbarella, and A. Brath, “Flood risk mitigation in developing countries: deriving accurate topographic data for remote areas under severe time and economic constraints,” Journal of Flood
Risk Management , vol. 8(4), pp. 301-314, Dec. 2015
[14] C. Li, X. Cheng, N. Li, X. Du, Q. Yu, and G. Kan, “A framework for flood risk analysis and benefit assessment of flood control measures in urban areas,” International Journal of Environmental Research
and Public Health, vol. 13, pp. 1-18, 2016
[15] K. Hafeez, and M.A.U. Khan, “Application of geographic information system for the installation of surge arrestors on overhead 132 k-v power line”, International Journal on Advanced Science
Engineering Information Technology, vol. 2(6), pp. 6-8, Dec. 2012
[16] S.A. Hamidi, and F.B. Khosrowshahy, “Impacts of hydraulics and sediment transport in river training works and flood control schemes (Case study: Shahroud River),” Journal of Flood Risk Management , vol. 3(3), pp. 209-214, 2005
[17] I.G. Tunas, N. Anwar, and U. Lasminto, “Fractal characteristic analysis of watershed as a variable of synthetic unit hydrograph model,” The Open Civil Engineering Journal, vol. 10, pp. 706-718, Oct. 2016
[18] M. Mappatoba, S. Kassa, K. Palebori, C. Anwar, C.E. Tanamal, and S.Ilyas, “Exploring nature conservation problems at Lore Lindu National Park Central Sulawesi, Indonesia,” International Journal of
Agriculture Innovations and Research, vol. 6(2), pp. 279-287, Sep.
2017
[19] A.S. Parsa, M. Noori, M. Heydari and M. Rashidi, “Floodplain zoning simulation by using HEC-RAS and CCHE2D Models in the Sungai Maka River”, Air, Soil and Water Research, vol. 9, pp. 55-62, Feb. 2016