ISSN 0015–5659 www.fm.viamedica.pl
Developmental parallelism in primates
Z.M. Sikorska-Piwowska
1, A.L. Dawidowicz
21Department of Normal Anatomy, Centre of Biostructural Research, Medical University of Warsaw, Poland 2Institute of Mathematics, Jagiellonian University, Krakow, Poland
[Received: 3 June 2016; Accepted: 18 July 2016]
To my mother Teresa Sikorska To my father Stanislaw Dawidowicz
The authors examined a large random sample of skulls from two species of ma-caques: rhesus monkeys and cynomolgus monkeys. The skulls were measured, divided into age and sex groups and thoroughly analysed using statistical methods. The analysis shows that skulls of young rhesuses are considerably more domed, i.e. have better-developed neurocrania, than their adult counterparts. Male and female skulls, on the other hand, were found to be very similar, which means that sexual dimorphism of the rhesus macaque was suppressed. Both of these patterns are known from the human evolutionary pattern. No such parallelism to the de-velopment of Homo sapiens was found in the cynomolgus monkeys. The authors conclude that mosaic hominisation trends may have featured in the evolution of all primates. This would mean that apes were not a necessary step on the evolu-tionary way leading to the development of Homo sapiens, who may have started to evolve at an earlier stage of monkeys. (Folia Morphol 2017; 76, 2: 295–300) Key words: hominisation trends, sexual dimorphism, macaque
craniometrics
INTRODUCTION
The aim of this study is to propose a method for classifying the evolution of primates on the basis of selected features of the skull. A general trend in brain development, known as progressive cephalisa-tion, is found in primates and this is directly associ-ated with stages of hominisation and correlassoci-ated with the development of the brain case and the dermal roof. This phenomenon can be explained by the ten-dency to increase the complexity of the brain and by delayed myelinisation of neurons [3]. According to Theilhard de Chardin [20] the miniaturisation of the neurons increased the perceptive surface of the cor-tex. The brain development with perception centres for impulses coming from its natural environment
and ability of their stimulation according to its own needs can be observed independently in many line-ages of primates [2]. However, the changes in skull features do not proceed at the same pace within each phylogenetic line as a result of mosaic evolution and different ontogenetic rhythms and rates [16]. Convergence phenomena also exist between groups that are phylogenetically distant, but have a similar ecological status. This is demonstrated, for example, in the evolution of a similar type of joint between the skull and the vertebral column in response to modes of locomotion. For instance, the foramen magnum is shifted forward in the tarsiers (prosimiens) as it is in the hominids. Developmental parallelism appears among closely-related lines that display different
Address for correspondence: Dr. Z. Sikorska-Piwowska, Department of Normal Anatomy, Centre of Biostructural Research, Medical University of
levels of adaptation to the environment, such as in hominids and apes [17]. According to Singleton [18], polyphyletic evolution of primates has created a range
of parallel developmental lines which are reflected in
the skull morphology of contemporary monkeys and apes. General studies on the phylogenesis of primates have led to the assumption that the process of homini-sation (the evolutionary development of man) involves a neotenic feature (retaining juvenile features in pu-berty) whereby in the process of attaining a bipedal posture a 90o angle is attained between the sagittal
axis of the head and the long axis of the trunk — it was developed by Bolk [1]. The head can thus be balanced on top of the vertebral column and this entailed the reduction of the splanchnocranium in favour of the
neurocranium. If a proto-human form had retained the quadrupedal posture instead of becoming bipedal, that angle would have forced it to look downwards.
The phenomenon of neoteny is accompanied by a gradual suppression of sexual dimorphism during the course of evolution of the human skull, while this dimorphism remains a very strong feature in certain other primates. It can immediately be seen that the skulls of adult males and females of the same species differ more than between specimens of the same sex but different species. The scale of dimorphism depends on age. Plavcan [10] suggested that distinct patterns of sexual dimorphism may as-sist in species recognition and perhaps phylogenetic analysis. O’Higgins et al. [8] approved his point of view. The authors suggested that variation in facial form between monkey species seemed to be the re-sult of prenatal established differences in form plus post-natal growth divergence. The different sexual dimorphism of these species arises through the ac-tion of similar growth processes on divergent growth trajectories. A more general question posed in this connection is to what extent the rate of development and the developmental stages of the skull and its sexual dimorphism emerging at reproductive age, affect the stages of hominisation. These differences
resulted in great morphological diversification for
papionins over equivalent size ranges (Profant and Shea [11], Ravosa and Profant [12]). To address these issues it was necessary to study a fairly uniform group of macaques.
MATERIALS AND METHODS
The study was conducted using 450 skulls of mon
-keys obtained from the Chinese province Guangxi.
These monkeys are catarrhines, Cercopithecidae of the species M. rhesus Audeb. and M. cynomolgus
Zimm., genus Macaca Lacépède (1799). In M. rhesus, two sub-species A and B were distinguished [15]. The sub-species and sex were determined on the basis of descriptive features pertaining to the whole body and examined before the preparation of the skulls. The age was established according to Schultz’s teeth eruption table [13] as follows (where M is molars, I — incisors, P — premolars, and C — canine teeth): 1. 1–2 years — M1 (permanent teeth);
2. 2–3 years — I1 I2;
3. 3–4 years — M2 P1 P2; 4. 4–5 years — C;
5. 5–6 years — – (none);
6. 6–8 years — M3 (piercing in progress, not fully formed);
7. 6–24 years — M3 (In these specimens molars may
be fully pierced and formed at any age from 6 to
24 years).
The age groups were identified by years (depend
-ing on the age at which permanent teeth are fully
developed) to max. of 24 and coded as 1 through 7.
The developmental trends in the neurocranium
and splanchnocranium are identified using the Mo
-rant and Sergi index [9, 14], according to the follow
-ing formula:
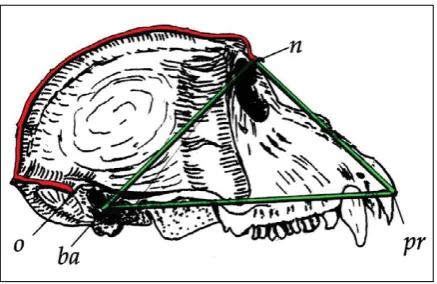
whereby: S — n – o (25) – Callot’s measure of the cranial vault dimension; P — the area of the upper-face triangle determined by the measurement; n-ba (5),
ba-pr (40), n-pr (48) (Fig. 1).
The number designations of the measurements follow Martin and Saller [7].
2
100
S
P
⋅
2
c
b
a
p
=
+
+
)
)(
)(
(
p
a
p
b
p
c
p
P
)
=
c
−
p
P
) (
=
b
−
−
p
p
P
(
) (
p
=
a
−
−
−
a
p
p
)(
(
(
p
p
p
−
−
−
a
b
=
)(
)(
P
p
p
−
−
b
c
)
)(
p
−
c
)
)
c
−
p
) (
b
−
p
) (
a
−
p
(
p
=
P
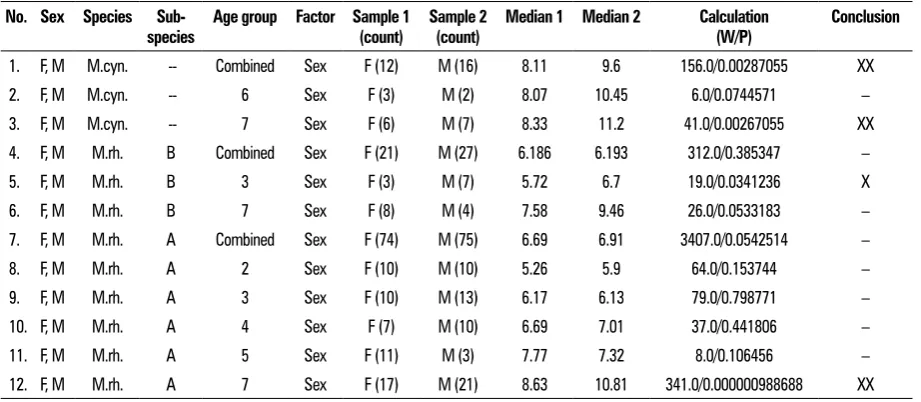
Table 1. Statistical analysis of monkey skull shape variability according to sex
No. Sex Species
Sub-species Age group Factor Sample 1 (count) Sample 2 (count) Median 1 Median 2 Calculation (W/P) Conclusion
1. F, M M.cyn. -- Combined Sex F (12) M (16) 8.11 9.6 156.0/0.00287055 XX
2. F, M M.cyn. -- 6 Sex F (3) M (2) 8.07 10.45 6.0/0.0744571 –
3. F, M M.cyn. -- 7 Sex F (6) M (7) 8.33 11.2 41.0/0.00267055 XX
4. F, M M.rh. B Combined Sex F (21) M (27) 6.186 6.193 312.0/0.385347 –
5. F, M M.rh. B 3 Sex F (3) M (7) 5.72 6.7 19.0/0.0341236 X
6. F, M M.rh. B 7 Sex F (8) M (4) 7.58 9.46 26.0/0.0533183 –
7. F, M M.rh. A Combined Sex F (74) M (75) 6.69 6.91 3407.0/0.0542514 –
8. F, M M.rh. A 2 Sex F (10) M (10) 5.26 5.9 64.0/0.153744 –
9. F, M M.rh. A 3 Sex F (10) M (13) 6.17 6.13 79.0/0.798771 –
10. F, M M.rh. A 4 Sex F (7) M (10) 6.69 7.01 37.0/0.441806 –
11. F, M M.rh. A 5 Sex F (11) M (3) 7.77 7.32 8.0/0.106456 –
12. F, M M.rh. A 7 Sex F (17) M (21) 8.63 10.81 341.0/0.000000988688 XX
M.cyn. — M. cynomolgus Zimm.; M.rh. — M. rhesus Audeb.; A and B — sub-species; F — female; M — male; F, M — both sexes taken into account, F+F concerns female only, M+M — male only. Age groups are coded: 1) 1–2 years, 2) 2–3 years, 3) 3–4 years, 4) 4–5 years, 5) 5–6 years, 6) 6–8 years, 7) 6–24 years; X — p<L=0.05; XX — p<L=0.01
for the two populations. It was considered to be more suitable than Student’s t-test due to the small sample sizes available. Student’s t-test requires a large-size sample based on the limit theorem. Individual skulls from both groups were placed in order of increas-ing values of the index and were ranked. The Mann--Whitney statistics were based on the sum of ranks of elements within each group. The statistic package [19] was used to derive the probability (p) of arriving at or exceeding the calculated value of the Mann-Whitney statistics based on the assumption that both groups are homogeneous. Any probability p < 0.05 would
represent a statistically significant difference.
RESULTS
Tables 1–4 show differences in the proportion of neurocranium and splanchnocranium in the macaques investigated. Sex, age, sub-species and species were selected as differentiating factors. The existence of
significant differences between the male and female
specimens is known as sexual dimorphism; when
sig-nificant differences divide various age groups then
we are talking about a different pace and rhythm of
cranial development; and when significant differences
are found between taxons (systematic units) then these are differences in phylogenetic development. These dif-ferences will be further discussed below and relevant
rows in Tables 1–4 will be pointed out. 1. Sexual dimorphism — Table 1.
1a. Sexual dimorphism in M. cynomologus is a dominant feature (row 1) and is fully formed in the The area of the triangle is calculated according to
Heron’s formula:
whereby a, b and c are sides of the triangle, and
The Morant and Sergi index values decrease as the
neurocranium and the dermal-skull roof sizes increase.
The calculations and results regarding the signifi
-cance of differences between the species and
sub-species studied, classified by the various age classes and sex, are given in Tables 1–4. Factors are the criteria
used for classifying the skulls examined according to sex, age, species and sub-species of the specimens.
W is the calculation result and p-value means that
if no significant differences exist in the population
studied then the probability of such a result would be, e.g., 0.00013082, as seen with M. rhesus A, aged
between 3 and 4 years old (Table 2, row number 6). Significance of the differences exists when p <
a = 0.05.
Concluding: X denotes p < a = 0.05 while XX denotes p < a = 0.01.
The rows of these Table 1–4 contain data on char
-acteristics of the groups studied, Sample 1 and Sam-ple 2, to which the Morant and Sergi index medians, Median 1 and Median 2, refer.
The Mann-Whitney [6] and Hollander and Wolfe [4]
oldest age group (row 3). A lack of sexual dimorphism found in the sixth age group (row 2) is probably caused by variable rates, at which features that nor-mally account for sexual dimorphism develop at that stage. Females have larger neurocrania than males.
1b. Sexual dimorphism is suppressed in M. rhesus B (rows 4 and 6) with the exception of age group 3 (row 5).
M. rhesus A onlydisplays strong differences be-tween males and females in the oldest age group (row 12), where females have larger neurocrania than males. 2. Pace and rhythm of cranial development — Table 2. 2a. In M. cynomolgus this factor does not influ -ence the proportions of the neuro- and splanch-nocrania with the exception of age groups 5 and 6
Table 3. Statistical analysis of monkey skull shape variability according to sub-species.
No Sex Species
Sub-species Age group Factor Sample 1 (count) Sample 2 (count) Median 1 Median 2 Calculation (W/P) Conclusion
1. F M.rh. A and B Combined
Sub-species A (74)M.rh. B (21)M.rh. 6.69 6.19 761.0/0.292178 –
2. F M.rh. A and B 1 to 5
Sub-species A (52)M.rh. B (12)M.rh 5.84 5.72 291.0/0.196409 –
3. F, M M.rh. A and B 6 and 7
Sub-species A (51)M.rh. B (13)M.rh. 8.18 7.94 62.0/0.0560911 –
4. M M.rh. A and B Combined
Sub-species A (75)M.rh. B (27)M.rh. 6.91 6.2 865.0/0.0724932 –
5. M M.rh. A and B 1 and 2
Sub-species A (20)M.rh. B (14)M.rh. 5.29 5.86 214.0/0.0842725 –
6. F, M M.rh. A and B Combined
Sub-species A (149)M.rh. B (48)M.rh. 6.87 6.2 3274.0/0.00836977 XX
Significances according to Table 1
Table 2. Statistical analysis of monkey skull shape variability according to age
No. Sex Species
Sub-species Age group Factor Sample 1 (count) Sample 2 (count) Median 1 Median 2 Calculation (W/P) Conclusion
1. F, M M.cyn. – 1 and 5 Age 1 (2) 5 (2) 7.23 6.16 1.0/0.349266 –
2. F, M M.cyn. – 5 and 6 Age 5 (2) 6 (5) 6.16 8.54 10.0/0.0406804 X
3. F, M M.cyn. – 6 and 7 Age 6 (5) 7 (13) 8.54 9.9 45.0/0.118429 –
4. F, M M.rh. A 1 and 2 Age 1 (24) 2 (20) 4.84 5.65 342.0/0.00669017 XX
5. F, M M.rh. A 2 and 3 Age 2 (20) 3 (23) 5.65 6.12 329.0/0.00823341 XX
6. F, M M.rh. A 3 and 4 Age 3 (23) 4 (17) 6.12 7.00 306.0/0.0013082 XX
7. F, M M.rh. A 4 and 5 Age 4 (17) 5 (14) 7.00 7.56 195.0/0.00136371 XX
8. F, M M.rh. A 5 and 6 Age 5 (14) 6 (13) 7.00 7.56 117.0/0.107966 –
9. F, M M.rh. A 6 and 7 Age 6 (13) 7 (38) 7.93 9.73 404.0/0.000359178 XX
10. F, M M.cyn.
+M.rh. Combined– 1 and 2 Age 1 (37) 2 (31) 5.12 5.88 792.0/0.00363347 XX
11. F, M M.cyn.
+M.rh. Combined– 2 and 3 Age 2 (31) 3 (36) 5.88 6.36 798.0/0.00129908 XX
12. F, M M.cyn.
+M.rh. Combined– 3 and 4 Age 3 (36) 4 (21) 6.36 7.02 523.0/0.00841334 XX
13. F, M M.cyn.
+M.rh. Combined– 4 and 5 Age 4 (21) 5 (18) 7.02 7.00 237.0/0.0904217 –
14. F, M M.cyn.
+M.rh. Combined– 5 and 6 Age 5 (18) 6 (19) 7.00 8.09 260.0/0.00358082 XX
15. F, M M.cyn.
+M.rh. Combined– 6 and 7 Age 6 (63) 7 (56) 8.09 9.52 862.0/0.00192373 XX
(row 2) where the younger specimens feature larger neurocrania than the older ones.
2b. The M. rhesus A displays very significant rela -tionships between age and cranial proportions (rows
4–7 and 9). This is principally manifested by a larger
neurocranium in younger specimens in comparison to older ones. A similar process is also known from Homi-nidae [2]. An exception is found in the comparison of
groups 5 and 6 that yields no significant differences
(row 8), but this can be explained by the fact that there is a pause in the piercing of teeth that starts in group 5 and lasts until group 6. It is only then that the
final molar begins to pierce. The M. rhesus B was not
compared for the lack of a sufficiently large sample. 2c. The combination of M. cynomologus and
M. rhesus into a single taxon reveals changes in cra-nial proportions depending on age (rows 10–12 and
14–15), whereby younger specimens have larger neu
-rocrania than older groups. One exception (row 13) is found at an early reproductive age when the cranial proportions are distorted by the growth of canines.
3. Phylogenetic relationships — Tables 3 and 4.
3a. Differences between sub-species — Table 3. 3a1. When broken down into age groups and
sexes, the A and B sub-species showed no significant
differences (rows 1–5). The differences between sexes and age groups are greater than taxonomic ones.
3a2. A different picture appeared when both sexes and age groups were amalgamated; the differences
between sub-species A and B were very significant
(row 6) with the neurocranium of sub-species B being larger than that of sub-species A.
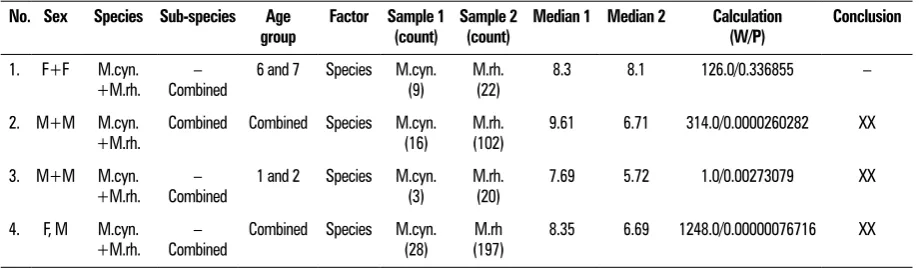
3b. Differences between species — Table 4.
3b1. Differences between M. cynomologus and
M. rhesus are only found between males (rows 2–3), (M. rhesus having greater neurocranium). The morpho- logically developed female skulls are similar (row 1).
This means that the sex factor prevails here over taxonomical differences.
3b2. A comparison of male M. cynomologus and
M. rhesus across the age sample and in the two youngest age groups (1 and 2) (row 3) yielded very
significant taxonomic differences. This means that
males account for the systematic diversity here. Ad-ditionally, M. rhesus have relatively larger neurocrania when compared to M. cynomolgus.
3b3. When both sexes and all age groups were
combined, significant differences between M. rhesus
and M. cynomolgus were also revealed (row 4). Again,
the M. rhesus had relatively larger neurocrania when compared to M. cynomolgus.
DISCUSSION
In the hominisation process there is a trend to-wards the progressive development of the neurocra-nium versus the splanchnocraneurocra-nium and the suppres-sion of sexual dimorphism. Morphologically, this is indicated by the Morant and Sergy index.
Our study suggests that:
1. Sexual dimorphism of the skull is strong in
M. cynomolgus, which eliminates it from the line that manifests hominisation tendencies. In M. rhesus
sexual dimorphism is quite suppressed, but more in the B sub-species than in the A, in which sexual dimorphism only manifests itself at the stage of complete morphological maturity.
2. The degree of development of the neurocranium relative to the splanchnocranium depends on the age group, as demonstrated in M. rhesus A. The neurocranium is greater in younger specimens. Generally in M. cynomolgus the proportions of the skull do not change with age and only M. rhesus
manifests tendencies typical of human develop-ment where the relative size of the neurocranium
Table 4. Statistical analysis of monkey skull shape variability according to species
No. Sex Species Sub-species Age
group Factor Sample 1 (count) Sample 2 (count) Median 1 Median 2 Calculation (W/P) Conclusion
1. F+F M.cyn.
+M.rh. Combined– 6 and 7 Species M.cyn. (9) M.rh. (22) 8.3 8.1 126.0/0.336855 –
2. M+M M.cyn.
+M.rh. Combined Combined Species M.cyn. (16) M.rh. (102) 9.61 6.71 314.0/0.0000260282 XX
3. M+M M.cyn.
+M.rh. Combined– 1 and 2 Species M.cyn. (3) M.rh. (20) 7.69 5.72 1.0/0.00273079 XX
4. F, M M.cyn.
+M.rh. Combined– Combined Species M.cyn. (28) (197)M.rh 8.35 6.69 1248.0/0.00000076716 XX
is greater in infants and children than in mature specimens.
3. In phylogenetic relations the males of M. rhesus
and M. cynomolgus species differ significantly
while females do not. The sex factor is therefore stronger than the taxonomic differences. As an interesting twist of the tale this may mean that, among certain primates, males and females may belong to different developmental lines. While both sexes and all age groups are analysed as one group there are considerable differences between M. cynomolgus and M. rhesus and this
rules out their classification in the same genus of
macaques.
4. The Rhesus sub-species A and B, analysed together as one group, differ significantly in their skull pro -portions with the B sub-species having a larger neu-rocranium. These taxonomic differences tend to be suppressed by sexual dimorphism and by differences in the pace and rhythm of the skull development when sex and age are taken into account.
5. The macaque forms studied display developmental parallelism.
6. The rhesus macaques display a mosaic manifesta-tion of hominisamanifesta-tion tendencies.
According to Maestripieri [5] understanding why rhesus macaques behave the way they do may tell us something about human nature, metaphysics, and perhaps the future as well. So what rhesus macaques and people may have in common is that their psy-chological and behavioural dispositions have been shaped by selective pressures stemming from coop-eration and competition between individuals and groups to a larger extent than many other animal species, including many other primates.
CONCLUSIONS
According to the results obtained the following can be concluded:
1. The macaque forms studied display developmental paralelism that occurs a mosaic manifestation of hominisation tendencies.
2. Generally in M. cynomolgus the proportions of the skull do not change with age. Above skull sexual dimorphism eliminates them from the line that manifests hominisation tendencies.
3. M. rhesus manifests traits typical of human de-velopment where the relative size of the neuro-cranium is greater in infants and children then in mature specimens.
4. In M. rhesus sexual dimorphism is quite suppressed,
but more in the B sub-species than in the A. As known evolution of hominid forms displays decreasing skull sexual dimorphism until its complete elimination.
5. Significant differences between M. cynomolgus
and M. rhesus rules out their classification in the
same genus of Macaca.
REfERENCES
1. Bolk L. Die Enstehung des Menschenkinnes. Verh K Akad. 1926: Wetenschappen.
2. Falk D. Brain Evolution in Homo, the “radiator theory”. Behav. Brain, SCI. 1990; 13: 333–338.
3. Fijałkowski K, Bielicki T. Homo przypadkiem sapiens. Wydawnictwo Naukowe PWN, Warszawa 2009.
4. Hollander M, Wolfe DA. Nonparametric Statistical Meth-ods. John Wiley and Sons, Inc., New York. 1973. 5. Maestripieri D. Macachiavellan intelligence. How Rhesus
Macaques and Humans have conquered the World. The Uni-versity of Chicago Press, Ltd., Chicago and London. 2007. 6. Mann HB, Whitney RD. Mann-Whitney U Test. Wilcoxon
Rank Sum Test 1974.
7. Martin R, Saller K. Lehrbuch der Antropologie. Gustav Fischer Verlag, Stuttgart 1. 1957: 455, 464, 476. 8. O’Higgins P, Chadfield P, Jones N. Facial growth and the
ontogeny of morphological variation within and between the primates Cebus apella and Cercocebus torquatus. Journal of Zoology. 2001; 254(3): 337–357, doi: 10.1017/ s095283690100084x.
9. Panek S. Metody statystyczne stosowane w opracowani-ach materialow antropologicznych. Zarys Antropologii, PWN, Warszawa 1962.
10. Plavcan JM. Taxonomic variation in the patterns of crani-ofacial dimorphism in primates. J Hum Evol. 2002; 42(5): 579–608, doi:10.1006/jhev.2001.0542, indexed in Pub-med: 11969298.
11. Profant L, Shea B. Allometric basis of morphological diversity in the Cercopithecini vs Papionini tribes of Cercopithecinae monkeys. Am J Phys Anthrop. 1994 (Suppl. 18): 162–163. 12. Ravosa MJ, Profant LP. Evolutionary morphology of the skull
in Old World monkeys. In: Whitehead PF, Jolly CJ Eds. Old World Monkeys. Cambridge University Press, New York 2000. 13. Schultz A, Hofer A, Starck D. Postembryonic age changes.
Primatologia TJS Karger, Basel, New York 1956.
14. Sergi S. Der Neandertal – Schadel von Monte Circo. Anthrop Anz XI. 1940.
15. Sikorska-Piwowska Z. Doniesienie tymczasowe o odmia-nach występujących w obrębie gatunków M. rhesus Audeb i M cynomolgus Reichen. Przegl Zool. 1959(3): 3–4. 16. Sikorska-Piwowska Z, Dawidowicz AL,
Mańkowska--Plisszka H, et al. Morphological evolution of formalized taxa for some monkey and apes species. Mathematica Applicanda. 2014; 42(1): 93–113.
17. Simpson GG. Principles of animal taxonomy. Columbia University Press, New York 1961.
18. Singleton M. Patterns of cranial shape variation in the Papionini (Primates: Cercopithecinae). J Hum Evol. 2002; 42(5): 547–578, doi:10.1006/jhev.2001.0539, indexed in Pubmed: 11969297.
19. Statistic package. R package. Foundation for Statistical Computing. 2006.