The changes of radiotherapy in Lithuania:
infrastructure, utilization rate, and cost
Correspondence to: Ramunė Mineikytė, National Cancer In-stitute, 1 Santariškių Street, LT-08660 Vilnius, Lithuania. E-mail: [email protected]
Ramunė Mineikytė1,
Ernestas Janulionis1, Vydmantas Atkočius1,
Laimonas Jaruševičius2, Aista Plieskienė3,
Jonas Gečas4
1 National Cancer Institute, Vilnius, Lithuania
2 The Hospital of Lithuanian University of Health Sciences Kaunas Clinics,
Kaunas, Lithuania
3 Klaipėda University Hospital, Klaipėda, Lithuania
4 Republican Šiauliai Hospital, Šiauliai, Lithuania
Background. The aimof this study was to evaluate radiation therapy (RT) productivity, capacity, and cost in Lithuania.
Materials and methods. An electronic questionnaire was prepared and sent to the country’s RT centres. The data was collected for the years 2011–2014. The early data of the RT infrastructure was obtained from the QUARTS Project (2001).
Results. In Lithuania the external beam RT was applied to 32.6% of new cancer cases (non-melanomatous skin cancer and benign conditions were excluded). In 2014, RT was more frequently applied for breast and prostate carcinomas, 23 and 20%, respectively. The country owned 11 units of linear accelerators (linacs) and this accounts for 3.7 linacs per one mil-lion population. 3D conformal RT is the standard approach in all four RT centres in Lithuania. IMRT practices were established in three centers and VMAT or stereotactic RT in two of them. 73% of linacs were capable of IGRT, while only 27% were equipped with CBCT. The average linac workload was 567 patients per year and showed a 10% decrease compared with the 2011 data. During a ten-year period, the average cost per patient for RT treatment increased 7.6 times – from EUR 129 to 974. The reim-bursement system in Lithuania is not favourable for application of RT.
Conclusions. During the recent thirteen years, RT services in Lith-uania have dramatically improved, but we are still behind the average of European countries and benchmark rates. It is important to continue op-timising the efficiency of RT services, and further evidence-based studies on RT infrastructure assessment and planning are needed.
Keywords: radiotherapy in Lithuania, utilization rate, equipment, work-load, cost
INTRODUCTION
In Lithuania, as in all developed and developing countries, the number of new cancer cases increases every year – in 10 years (2002–2012) the number of oncology patients increased by 23%; the index
Approximately half of the cancer patients require radiation treatment at some time during the course of their illness. Some recent studies (3–5) suggest that the optimal RT utilisation rate varies from 40.6% in England to 53.4% in Poland. But since 2005 most of the publications quote the results of the Del-aney et al. (6) study which indicated that 52.3% of all people with notifiable malignancies would require RT at some stage during the course of their disease. These recommendations were reviewed in 2013, and the evidence-based guidelines suggest that in Aus-tralia RT is the treatment of choice for 48.3% of no-tifiable cancers (7).
The last assessment of the RT situation in Lithua-nia was performed in 2001, in the QUARTS Project (Quantification of Radiation Therapy Infrastruc-ture and Staffing Needs), initiated by the European Society for Therapeutic Radiology and Radiation Oncology (ESTRO) (8, 9). Over the past decade, there have been enormous changes in the delivery of RT from two-dimensional and three-dimensional (3D) to intensity-modulated radiotherapy (IMRT) and image-guided radiotherapy (IGRT) treatments using the greatly improved accuracy of CT simula-tion, multileaf collimators, etc. These complicated methods require more and more material resourc-es, but according to some studies (10, 11) the costs of external RT constitute only 5% of the total costs for oncology services. However, an important fac-tor influencing the choice of treatment modalities is the reimbursement system in Lithuania.
Without doubt, since the beginning of this century, RT has undergone many qualitative and structural changes. Projects, funded by the Eu-ropean Union in Lithuania, helped to purchase the major part of the diagnostic and treatment equipment. During the recent thirteen years, the number of linacs in Lithuania has increased 5.5 times; all cobalt machines were dismantled and not used any more.
The aim of this study was to estimate the situa-tion of RT in Lithuania and to review the changes of RT productivity, equipment, workload, and RT ser-vice cost over the 13-year period from 2001 to 2014; to compare the current situation with other coun-tries; and to predict the future demand for linacs until the year 2025. This is necessary for the ration-al planning of our financithe ration-al resources in the future, and thereby ensuring the accessibility and quality of the RT services provided for patients. This is because
the results of the QUARTS Project seem to have had a valuable impact on the government decisions.
MATERIALS AND METHODS
An electronic questionnaire was prepared and sent to all 4 RT centres in Lithuania. The data were collected for the calendar years of 2011 and 2014. The ques-tionnaire consisted of 4 blocks of questions: gener-al information about patients (numbers of patients treated, cancer types); RT methods applied; equip-ment owned; costs of RT services (only in the ques-tionnaire of 2011).
The response rate was 100%. In order to identify contradictory data or to obtain missing information, an individual, standardised verbal survey was car-ried out (contacting by phone). The data published on the websites of the institutions were used as well.
Information about the RT situation in Lithuania in 2001 was obtained from the QUARTS Project participants.
Data of other countries from the published lit-erature and the results of the ESTRO QUARTS (8) and HERO projects (12), as well as documents and technical reports published in the official websites of international organisations (ESTRO, World Health Organisation (WHO), International Atomic Energy Agency (IAEA), etc.) were used. We selected the lit-erature and reports relevant to the objective and methodology.
The article includes external beam RT data; we did not include benign indications, non-melanoma skin cancer, and paediatric cancer. The calculations of the external RT application level in the country included only primary patients. The RT utilisation rate is described as the number of new cases of can-cer treated using RT per year, divided by the num-ber of newly registered cases of cancer during that year. The numbers of new cases of cancer were ob-tained from the data of the Lithuanian Cancer Reg-istry (the last report presents 2012 data) (1).
The assessment of the workload for equipment, the number of patients, was calculated as the sum of primary and repeat therapy patients who re-ceived RT services in the calendar year.
Evaluating the RT cost, we used the cost structure and calculation methods mentioned in the literature (13, 14).
linac/year; additional 10% capacity in linac numbers to negate increase in the waiting times for treatment; a 25% re-treatment rate). For cancer incidence pro-jections, the Globocan database was used (17).
RESULTS
Currentsituation of external beam radiotherapy in Lithuania
RT services in Lithuania are provided by 4 public healthcare institutions, two of which are estab-lished in the major cities and have 69% of patients per year. The other 2 RT centres are about three to four times smaller, regarding the number of pa-tients treated as well as the number of linacs.
On the average, one RT centre in the country provides treatment for 1,702 patients per year (pts/ year). It is estimated that 64% of RT services are delivered within the outpatient setting.
In 2012 the number of new cancer cases was 17,734 (1). Approximately 32.6% of all newly di-agnosed patients were treated with external beam RT (non-melanomatous skin cancer and benign conditions were excluded) alone or in combination with other treatment modalities.
In 2014 the five most frequent cancers (66%) treated by RT were the following: breast, prostate, gynaecological, head and neck, lung cancers (Ta-ble 1). In comparison with the 2001 data, prostate and breast cancer patients treated by RT increased, especially prostate patients – more than 80%; other cancer patients decreased.
Equipment
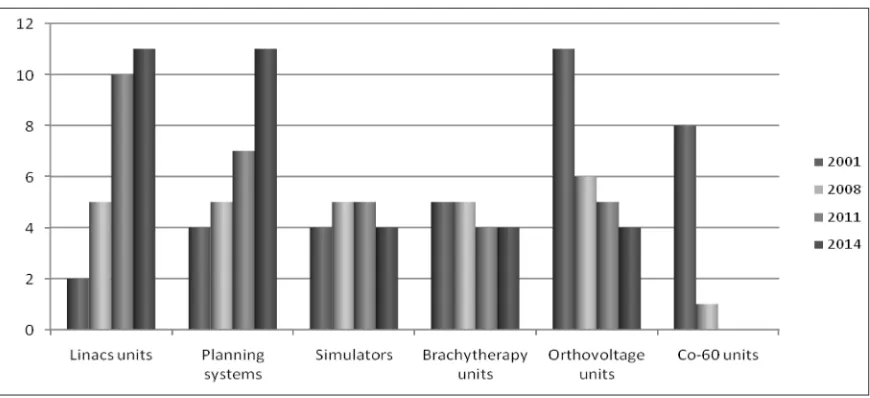
Figure 1 shows an overview of RT equipment units in 2001–2014. In 2014 there were 11 linacs in the coun-try: two major oncology centres owned 4 units each and the two smaller had 1 and 2 units, respective-ly, i. e. the largest centres had 73% of the entire RT infrastructure. IMRT practices were established in three centers andvolumetric modulated arc therapy (VMAT)orstereotactic RT in two of them. 73% of linacs were capable of IGRT, while only 27% were equipped with kilovoltage cone-beam computed to-mography (CBCT).
There was a decrease in the number of ortho-voltage treatment units, from 11 in 2001 to 4 in 2014. Currently these machines are only used for treat-ments of some skin tumours and other superficial lesions. The RT centres owned 4 simulators. There
Fig. 1. Changes in the RT equipment units in Lithuania (2001–2014) Table 1. Patients distribution by cancer types (% from all patients treated by RT)
Years Breast Prostate Gynecological Head and neck Lung Others
2001 19.4 3.9 11.9 10.6 10.3 43.9
2014 23.3 19.9 8.7 6.8 7.3 34
Change* 16.7 80.4 –36.8 –55.9 –41.1 –29.1
was an average of 0.36 simulators per linac unit. In 2014, there were 11 units of planning systems, all centres implemented 3D planning, three of them IMRT. In 2014, 100% of the patients had computer-ised treatment plans as compared to the year 2001 when this index was only about 30%.
Cost of radiotherapy
The costs of RT departments were evaluated ac-cording to cost inputs used by other studies (13, 14), and the results were compared with those of the year 2001 (Table 2).
Both in 2011 and in 2001, the major cost drivers included the cost of equipment (purchases, depreci-ation, maintenance) and personnel salaries. In 2001, personnel costs were the most important cost com-ponent of an RT department, while in 2011 equip-ment costs were most important (78% of all these costs were for linacs purchasing and maintenance). Maintenance of equipment accounted for about 17% of all costs within the equipment category.
In total, the average cost per patient for RT treatment was EUR 974, that is 7.5 times more than that in the year 2001 (in 2001 it was EUR 129). The cost varies widely from one delivery method to the next one. Also, it depends on the institution size, e. g. in small institutions (departments treat-ing <1,000 pts/year) the cost per patient was higher by more than 80%. So, looking from an economic point of view, the cost effectiveness applies to RT centres that treat more than 1,000 new patients an-nually, as is shown in other countries (9).
Reimbursement system
Lithuania has a compulsory health insurance sys-tem, which means that residents of Lithuania are obliged to obtain health insurance coverage (i. e. pay compulsory health insurance contributions). With respect to the insured, the State guarantees healthcare services compensated by the Compul-sory Health Insurance Fund.
The Ministry of Health establishes the ap-praisement for radiotherapy services provided by health institutions. The costs of expensive exami-nations and procedures performed during the ep-isode of the active in-patient treatment are includ-ed in the total cost of healthcare service and are not reimbursed separately. An average reimburse-ment by the health institution for one treated pa-tient with 3D conformal RT is 571 EUR; and for IMRT it is EUR 860. Obviously, institutions suffer losses providing RT services.
DISCUSSION
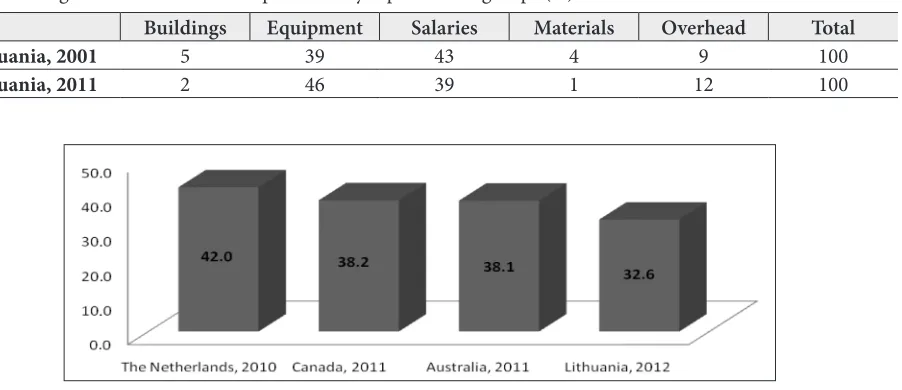
Comparing the current survey data with the data from Western countries or published optimal benchmarks, it is clear that the Lithuanian RT infrastructure is still below the average. Accord-ing to our data, the actual RT utilisation rate in Lithuania was 32.6%, and it is relatively low when compared with the developed countries (Fig. 2) (4, 15, 18). When compared with the Australian evidence-based estimation of the optimal RT uti-lization rate of 48.3% (7), or with the benchmark
Fig. 2. Actual utilisation rates of radiation therapy (%) Table 2. Average annual costs of RT department by separate cost groups (%)
Buildings Equipment Salaries Materials Overhead Total
Lithuania, 2001 5 39 43 4 9 100
rate of the neighbouring country Poland (53.4%) (5), there is a significant shortfall between the op-timal rate and the proportion of patients currently treated with RT. The HERO study (19) shows that the optimal utilization rate for Lithuania should be 51.5%.
The most common tumour sites treated by RT were breast and prostate cancer cases. The num-bers of these cancer sites increased during the last 10 years, but others (gynaecological, head and neck, lung cancer) decreased. This could be influenced by the following: the changes in cancer morbidity trends of some cancer sites (e. g. large increase of prostate cases; on the other hand, lung cancer cases decreased or stabilised); activity of cancer preven-tion and control programmes; implementing new, modern, and accurate RT technologies; chang-ing treatment techniques and recommendations; the preference of the physician for one therapeutic option over alternatives; internal policy of health institutions and benchmarking; etc.
In Lithuania there were 3.7 linacs per million inhabitants. It does not meet the guidelines as de-veloped by IAEA (20) and ESTRO (8, 9). West-ern European countries reached this index ten years ago (21). However, according to the data of the HERO study (19), Lithuania surpasses such Eastern European countries as Estonia and Po-land, but falls behind the Czech Republic, Hunga-ry, and Slovenia.
ESTRO recommends that Lithuania has 4.6 lin acs per million population (9), which is 14 units. Only 79% of this level were reached in 2014. How ever, the overview of the latest reports and recom mendations for linac workload (11, 16) concludes that the number of treatment units within Lithuania does not ensure accessibility of RT services and treatment quality.
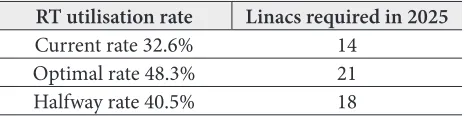
For planning RT needs for 2025, three linacs demand scenarios were estimated based on the RT utilisation rate (Table 3). This prognosis was made on the basis of the Australian principal calculation criteria (15, 16). We did not find an official national prognosis of new cancer cases, so we used the Glob-ocan database (17). It predicted a significant reduc-tion of new cancer cases in 2025. This raises some suspicion. In order to make more precise linac re-quirements in the future, more accurate calculations are required, including cancer trends for each can-cer site.
Table 3. Number of linacs required in Lithuania in 2025
RT utilisation rate Linacs required in 2025
Current rate 32.6% 14
Optimal rate 48.3% 21
Halfway rate 40.5% 18
The workload of linacs during recent years has been significantly reduced due to the increasing number of machines. But the workload exceeds the median number in European countries (419 treatment courses per MV unit) (12), international recommendations, and the data of other countries (18, 21–23) (Table 4).
Table 4. The workload of linear accelerator (patients per year)
Recommendation Facts
ESTRO
UK, 2002 Spain, 2007
Th
e N
et
her
la
nd
s,
2010
Po
la
nd
, 2011
Li
th
ua
ni
a, 2014
1 per 450 456 476 451 678 567
The cost of RT depends on treatment modali-ty, treatment intent (for cure or palliation), local-isation of the primary site of cancer, stage, and other factors. In this survey, we calculated the av-erage RT treatment costs in RT centres per calen-dar year. Our result is much lower than the average cost calculated by other studies, e. g. Ploquin and Dunscombe performed cost metaanalysis in which the mean normalized cost in 2005 was EUR 3.239 (14); in the recent Ireland study, the cost of tradi-tional RT for rectal cancer in 2012 was EUR 3.609 (24). Certainly, there are calculation errors due to methodological differences, but we can see com-mon tendencies and make a comparison and come to preliminary conclusions. The investigation data shows that the reimbursement system in Lithuania is improper and does not cover treatment expenses. So, health institutions are not willing to provide RT services, and this could be one of the reasons for the low RT utilisation rate.
capital investment and has high on‐going operating costs. Consequently, radiation treatment should be centralized in regional cancer centres (with more than 1,000 RT pts/year), especially for mid-dle income countries as Lithuania and where dis-tances to RT centres are not longer than 200 km.
In conclusion, during the recent thirteen years, RT services in Lithuania have dramatically improved, but we are still behind the average of European coun-tries and benchmark rates. This potential need for ad-ditional new equipment and the workforce required to support it represents a significant challenge over the coming years and needs to feed into trust capital planning and workforce strategies as early as possi-ble. The reimbursement system in the country is not in favour of RT centres. In order to raise the RT utili-zation rate, the reimbursement mechanism has to be reviewed and optimised. We think that this overview of the Lithuanian RT infrastructure will help to as-sess the current situation and continue the successful development of the RT services by increasing their accessibility and high quality.
Received 1 February 2016 Accepted 21 March 2016
References
1. Lithuanian Cancer Registry [Internet]. Vilnius: Na-tional Cancer Institute [cited 2015 Jun 23]. Availa-ble from: http://www.nvi.lt/index.php?-1413089819 2. Official Statistics Portal [Internet]. Vilnius: Statis-tics Lithuania [cited 2015 Jun 16]. Available from: http://osp.stat.gov.lt/en/home
3. Round CE, Williams MV, Mee T, Kirkby NF, Coop-er T, Hoskin P, Jena R. Radiotherapy demand and activity in England 2006–2020. Clin Oncol. 2013; 25: 522–30.
4. Mackillop WJ, Kong W, Brundage M, Hanna TP, Zhang-Salomons J, McLaughlin PY, Tyldesley S. A comparison of evidence-based estimates and empirical benchmarks of the appropriate rate of use of radiation therapy in Ontario. Int J Radiat Oncol Biol Phys. 2015; 91: 1099–107.
5. Borras JM, Barton JM, Grau C, Corral J, Verho-even R, Lemmens V, et al. The impact of cancer incidence and stage on optimal utilization of ra-diotherapy: Methodology of a population based analysis by the ESTRO-HERO project.
Radioth-er Oncol. 2015 Jul; 116(1): 45–50. doi: 10.1016/j. radonc.2015.04.021. Epub 2015 May 19.
6. Delaney G, Jacob S, Featherstone C, Barton M. The role of radiotherapy in cancer treatment: es-timating optimal utilization from a review of evi-dence-based clinical guidelines. Cancer. 2005; 104: 1129–37.
7. Barton MB, Jacob S, Shafiq J, Wong K, Thomp-son SR, Hanna TP, Delaney GP. Estimating the de-mand for radiotherapy from the evidence: a review of changes from 2003 to 2012. Radiother Oncol. 2014; 112: 140–4.
8. Slotman BJ, Cottier B, Bentzen SM, Heeren G, Lie-vens Y, van den Bogaert W. Overview of national guidelines for infrastructure and staffing of radio-therapy. ESTRO-QUARTS: Work package 1. Radio-ther Oncol.2005; 75: 349–54.
9. Bentzen SM, Heeren G, Cottier B, Slotman B, Glimelius B, Lievens Y, van den Bogaert W. To-wards evidence-based guidelines for radiotherapy infrastructure and staffing needs in Europe: the ES-TRO QUARTS project. Radiother Oncol. 2005; 75: 355–65.
10. Norlund A. Costs of radiotherapy. Acta Oncol. 2003; 42: 411–5.
11. Radiotherapy Services in England 2012 [Internet]. Department of Health Cancer [cited 2015 Jul 28]. Available from: http://ncat.nhs.uk/sites/default/ files/work-docs/Radiotherapy-Services-in-Eng-land-2012.pdf
12. Grau C, Defourny N, Malicki J, Dunscombe P, Bor-ras JM, Coffey M, et al. Radiotherapy equipment and departments in the European countries: Final results from the ESTRO-HERO survey. Radiother Oncol. 2014; 112: 155–64.
13. Lievens Y, van den Dogaert W, Kesteloot K. Activi-ty-based costing: a practical model for cost calcula-tion in radiotherapy. Int. J Radiat Oncol Biol Phys. 2003; 57: 522–35.
14. Ploquin NP, Dunscombe PB. The cost of radiation therapy. Radiother Oncol. 2008; 86: 217–23.
16. Radiotherapy Services in NSW Strategic Plan to 2016 [Internet]. NSW Department of Health; 2010 [cited 2015 Jul 11]. Available from: http://www. health.nsw.gov.au/pubs/2010/pdf/radiotherapy_ services_plan.pdf
17. Globocan 2012: Estimated Cancer Incidence, Mor-tality and Prevalence Worldwide in 2012 [Internet]. WHO [cited 2015 May 2]. Available from: http:// globocan.iarc.fr/
18. Slotman BJ, Vos PH. Planning of radiotherapy ca-pacity and productivity. Radiother Oncol. 2013; 106: 266–70.
19. Borras JM, Lievens Y, Dunscombe P, Coffey M, Malicki J, Corral J, et al.The optimal utilization pro-portion of external beam radiotherapy in European countries: An ESTRO-HERO analysis. Radiother Oncol. 2015 Jul; 116(1): 38–44. doi: 10.1016/j.ra-donc.2015.04.018. Epub 2015 May 14.
20. International Atomic Energy Agency. Setting Up a Radiotherapy Program: Clinical, Medical Phys-ics, Radiation Protection and Safety Aspects. Vi-enna: IAEA; 2008.
21. The Royal College of Radiologists (Great Britain). Equipment, workload and staffing for radiother-apy in the UK 1997–2002. BFCO (03)3. London: Royal College of Radiologists; 2003.
22. Palacios Eito A, Espinosa Calvo M, Manas Rue-da A, de Las Heras M. Radiation oncology: Future needs and equipment. Current situation in Spain. Clin Transl Oncol. 2008; 10: 478–85.
23. Reinfuss M, Byrski E, Malicki J. Radiotherapy facil-ities, equipment, and staffing in Poland: 2005–2011. Rep Pract Oncol Radiother. 2013; 18: 159–72. 24. Hanly P, Ó Céilleachair A, Skally M, O’Neill C,
Sharp L. Direct costs of radiotherapy for rectal cancer: a microcosting study. BMC Health Serv Res. 2015; 15: 184.
Ramunė Mineikytė, Ernestas Janulionis, Vydmantas Atkočius, Laimonas Jaruševičius, Aista Plieskienė, Jonas Gečas
LIETUVOS SPINDULINĖS TERAPIJOS POKYČIAI: INFRASTRUKTŪRA, TAIKYMO DAŽNIS, IŠLAIDOS
Tyrimo tikslas – įvertinti Lietuvos spindulinės terapijos (ST) pajėgumus, produktyvumą ir išlaidas.
Tyrimo medžiaga ir metodai. Parengtas ir į visus ša-lies ST centrus išsiųstas elektroninis klausimynas. Rinkti ir pateikiami 2011–2014 m. duomenys. Ankstesni duo-menys apie ST infrastruktūrą buvo gauti iš QUARTS pro-jekto (2001 m.).
Rezultatai. 32,6 % naujai diagnozuotų onkologinių atvejų gavo išorinį ST gydymą (išskyrus nemelanominio odos vėžio ir gerybinius onkologinius atvejus). 2014 m. ST dažniausiai taikyta krūties ir prostatos vėžiui gydy-ti – atitinkamai 23 ir 20 %. Šalyje veikė 11 linijinių grei-tintuvų (LG), t. y. 1 mln. gyventojų teko 3,7 LG. Visuose keturiuose Lietuvos ST centruose taikomas standartinis metodas – 3D konforminė ST. IMRT buvo taikoma tri-juose centruose, volumetriškai moduliuoto intensyvumo ST ir stereotaktinė ST – dviejuose. Nors 73 % LG turėjo IGRT galimybę, bet tik 27 % LG turėjo kūginio pluošto kompiuterinius tomografus. Su vienu LG per 2014 m. vidutiniškai buvo gydoma 567 pacientų. LG apkrova, palyginti su 2011 m. duomenimis, sumažėjo 10 %. ST gydymo išlaidos vienam pacientui per dešimt metų išau-go 7,6 karto – nuo 129 iki 974 Eur, tačiau gydymo kom-pensavimo sistema Lietuvoje nepalanki taikyti spindulinę terapiją – gydymo įstaigos, taikydamos šį metodą, patiria finansinių nuostolių.
Išvados. Per pastaruosius 13 metų Lietuvos ST paslau-gos pagerėjo, tačiau vis dar atsiliekame nuo Europos ša-lių vidurkio ir standartų. Todėl būtina tęsti ST paslaugų optimizaciją ir pradėtus mokslinius tyrimus vertinant ir planuojant ST infrastruktūrą.