spine shape should be assessed three-dimensionally (Perdriolle, Borgne, Dansereau, de Guise, & Labelle, 2001). The studies provided only outcomes of thoracic kyphosis and lumbar lordosis curvatures in the sagittal plane. Lateral deviation in the frontal plane was not measured; 2) more statistical data than mean and stan-dard deviation was provided rarely. To our knowledge, only Keller et al. (2005) provided the values of skew-ness and kurtosis and Boulay et al. (2006) showed a normal distribution of spinal variables; 3) the negative effect of radiography has been concerned repeatedly (Doody et al., 2000; Ronckers et al., 2010). Thus it is ethically disputable to load the normal population with a radiographic examination only in order to establish the spinal shape distribution in them. To overcome this obstacle non-radiographic methods for measurement of spine shape have been called (Patias, Grivas, Kaspiris, Aggouris, & Drakoutos, 2010). We developed and vali-dated one of such method based on the determining
Introduction
To detect the pathologic shape of the spine it is nec-essary to know the age, gender, culture, and possibly sport dependent characteristics of the normal spine. The measurement of the “healthy population” of a certain age needs to be repeated on a regular basis (up-graded). The most accurate methods available for such a study are based on radiographic measure-ment (Boulay et al., 2006; Keller, Colloca, Harrison, Harrison, & Janik, 2005; Legaye, Duval-Beaupère, Hecquet, & Marty, 1998; Mac-Thiong, Berthonnaud, Dimar, Betz, & Labelle, 2004; Vaz, Roussouly, Ber-thonnaud, & Dimnet, 2002; Vialle et al., 2005). The limitations of the above mentioned studies are: 1) the
* Address for correspondence: Jakub Krejčí, Department of Natural Sciences in Kinanthropology, Faculty of Physical Cul-ture, Palacký University Olomouc, třída Míru 117, 771 11 Olo-mouc, Czech Republic. E-mail: [email protected]
Spinal shape analysis in 1,020 healthy young adults aged from 19 to 30 years
Jakub Krejčí
1,* and Jiří Gallo
21Faculty of Physical Culture, Palacký University Olomouc, Olomouc, Czech Republic; and 2Faculty of Medicine and
Dentistry, Palacký University Olomouc, Olomouc, Czech Republic
Copyright: © 2016 J. Krejčí and J. Gallo. This is an open access article licensed under the Creative Commons Attribution License (http://creativecommons.org/licenses/by/4.0/).
Background: A number of studies on diseased spine have been published; however, there is a relative paucity of stud-ies investigating spine shape characteristics in healthy populations. Such characteristics are needed for diagnostics of spine disorders and assessment of changes in the spinal shape that may have been caused by influence of the modern life style or intensive sport activity. Objective: The aim of the study was to determine characteristics of the spine shape in a large sample of healthy young adults. Methods: Population cross-sectional study. A non-radiographic surface method (system DTP-3) was used for the assessment of spine shape in the sagittal and frontal planes. A total of 1,020 participants (440 men, 580 women) took part in the study, their mean (± SD) age was 21.8 ± 1.9 years (range 19.1–29.7) for men and 21.9 ± 1.8 years (range 19.3–29.7) for women. All data were checked for normality and are presented as means, standard deviations, ranges, skewness, and kurtosis. Differences between the sexes were assessed with the two-sample t-test. Results: The average sagittal spinal shape was C3 – 12.9° – C7 – 43.0° – T10 – 27.1° – L5 for men and C3 – 12.1° – C6 – 44.5° – T11 – 34.1° – L5 for women. Men showed a significantly smaller thoracic kyphosis and lumbar lordosis curvatures than women. The average curvature due to the lateral deviation in the frontal plane was 6.1° for both sexes, the curvature was larger than 10° in 9.1% of men and 8.8% of women. We found left lateral deviation in 72.5% of men and in 63.6% of women. Conclusions: The study provides characteristics of the spine shape in a large sample of healthy young adults. Such characteristics should be part and parcel of determining the cut-off level for physiological spinal shape. Based on the results of the study, we suggest a lateral deviation of 10° as the maximum for a curvature to be still considered non-pathological.
the three-dimensional coordinates of points on the skin surface by means of an electromechanical position sen-sor (Krejčí, Gallo, Salinger, & Štěpaník, 2012).
The shape of the spine as well as the criteria for its evaluation can change during the time for instance as a response to changing habits in society or availabity of the new therapeutic or diagnostic methods. Therefore, it is necessary from time to time re-define data charac-terizing normal shape of the spine in order to enable the physicians to understand the variability in observed spine. The objective of this study was to determine the spinal shape in a healthy young population of Cauca-sian origin and with Central European habits.
Methods
Participants
From September 28th 2009 to May 6th 2011 we gradu-ally measured the spinal shape in 1,020 volunteers (440 men, 580 women). The group included 643 students (328 men, 315 women) of the Faculty of Physical Cul-ture and 377 students (112 men, 265 women) of the Faculty of Medicine and Dentistry, Palacký University Olomouc. All students attended a full-time study pro-gram. Inclusion criteria were as follows – a consent with the measurement, age between 18 and 30, no known significant spinal problems and scoliosis up to
Cobb’s angle 10°. Statistics of age, weight and height are presented in Table 1. A total of 19 volunteers were excluded from the study. The reasons were as follows: 1) weight over 110 kg (4 subjects), as the spinous pro-cesses could be palpated only with difficulty; 2) medi-cal history of Scheuermann’s disease (3 subjects), other types of hyperkyphosis (4 subjects), hyperlordosis (2 subjects), and scoliosis exceeding Cobb’s angle 10° (6 subjects). The scoliotic patients underwent the DTP-3 examination but these results were not processed in this study. For information purpose the values of lat-eral deviation were 14.5, 14.9, 18.8, 21.2, 21.4, and 31.3 degrees.
Procedures
This study was approved by the Institutional Research Ethics Committee. All of the subjects participating in the study were volunteers and had given their written informed consent. Measurement of spinal shape was done using the DTP-3 system (Palacký University Olomouc, Olomouc, Czech Republic). This method enabled non-radiographic contact-type assessment of spinal shape in the sagittal and frontal planes based on determining the three-dimensional coordinates of points on the skin surface by means of an electrome-chanical position sensor. Technical accuracy of the sen-sor expressed as standard error was 0.5 mm (Krejčí, Gallo, Salinger, & Štěpaník, 2012). In order to increase
Table 1
Statistics of age, anthropometric and spinal shape variables
Variable Sex Mean SD Min Max Skew Kurt p1 Diff p2
Age (years) Men 21.8 1.9 19.1 29.7 1.03 1.07 < .001 –0.1 .465
Women 21.9 1.8 19.3 29.7 0.80 0.68 < .001
Body weight (kg) Men 76.7 8.3 54.0 103.0 0.29 0.40 < .001 15.0 < .001
Women 61.7 7.6 42.0 86.0 0.53 0.15 < .001
Body height (cm) Men 180.6 6.6 163.0 199.0 0.10 –0.05 .006 11.9 < .001
Women 168.7 6.3 151.0 186.0 0.02 –0.25 < .001
CL curvature (deg) Men 12.9 6.8 0.2 39.6 0.48 0.41 .146 0.8 .071
Women 12.1 7.6 0.1 39.4 0.61 0.03 < .001
TK curvature (deg) Men 43.0 7.5 19.2 69.6 0.08 –0.02 .516 –1.5 .001
Women 44.5 7.3 21.5 65.8 0.00 –0.04 .944
LL curvature (deg) Men 27.1 7.4 7.3 48.9 0.07 –0.15 .958 –0.7 < .001
Women 34.1 8.8 5.3 62.9 0.03 0.09 .867
Lateral deviation (deg) Men 6.1 2.6 1.4 14.7 0.66 0.11 < .001 0.0 .812
Women 6.1 2.7 1.0 15.5 0.96 0.97 < .001
Frontal pelvic tilt (deg) Men 0.5 2.0 –6.7 6.0 –0.06 0.33 .643 –0.1 .819
Women 0.6 1.9 –6.7 7.4 –0.17 0.70 .079
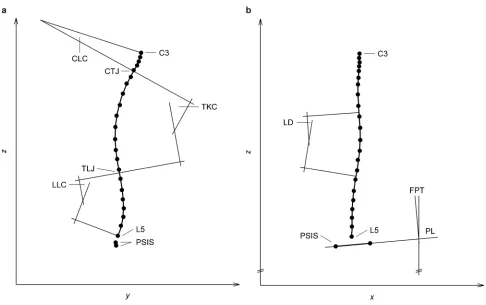
points C3–CTJ, CTJ–TCJ, and TCJ–L5, respectively. The angular curvature of each section was calculated (Figure 1). Additional information about the method was published by Krejci, Gallo, Stepanik, & Salinger (2012). In the frontal plane the polynomial produced various number of inflexion points which split the spine into several sections. If no inflexion point was present the whole C3–L5 segment was considered as a one section. Each spine showed lateral deviation, though small. No spine was linear within the DTP-3 system accuracy, i.e. mediolateral positions of the spi-nous processes deviated from the line by more than 0.5 mm. For the purposes of this study, any small lat-eral deviation was processed, the limit of 10° was not applied. If there were more lateral arcs, the one with the largest deviation was selected for further process-ing. The position of the pelvis was described with the frontal pelvic tilt – angle between the line connecting posterior superior iliac spines and the horizontal line.
Statistical analysis
All data were checked for normality using a Kol-mogorov-Smirnov test and are presented as ranges (min–max), means, standard deviations, skewness, and reliability of the spinal examination each subject was
examined in a special fixation frame that efficiently reduced postural sways. The usage of the fixation frame did not affect the spinal variables in terms of the systematic error (Krejci, Gallo, Stepanik, & Salinger, 2012; Phiri, Krejčí, & Salinger, 2009). Before using the DTP-3 system, the skin projections of the following anatomic points were palpated and marked – the poste-rior supeposte-rior iliac spines and the spinous processes of the vertebrae C3–C7, T1–T12, and L1–L5. After posi-tioning the subject in the fixation frame, the marked points were scanned by touching them with the sen-sor tip. Examination of the spinal shape was repeated three times and average shape was used for subsequent processing.
DTP-3 software was used to evaluate the spinal shape. The basis of the algorithm was fitting a six-degree polynomial to the measured spinous processes. In the sagittal plane the polynomial produced two inflexion points which were interpreted as a cervico-thoracic junction (CTJ) and a thoracolumbar junction (TCJ). These junctions split the spine into three sec-tions: cervical lordosis (CL), thoracic kyphosis (TK), and lumbar lordosis (LL) which were defined between
kurtosis. Sample differences between the sexes were identified with a two-sample t-test. The significance level was set at p < .05. All statistical analyses were per-formed using the MATLAB (Version 8.2; MathWorks, Natick, MA, USA) and STATISTICA (Version 12.0; StatSoft, Tulsa, OK, USA).
Results
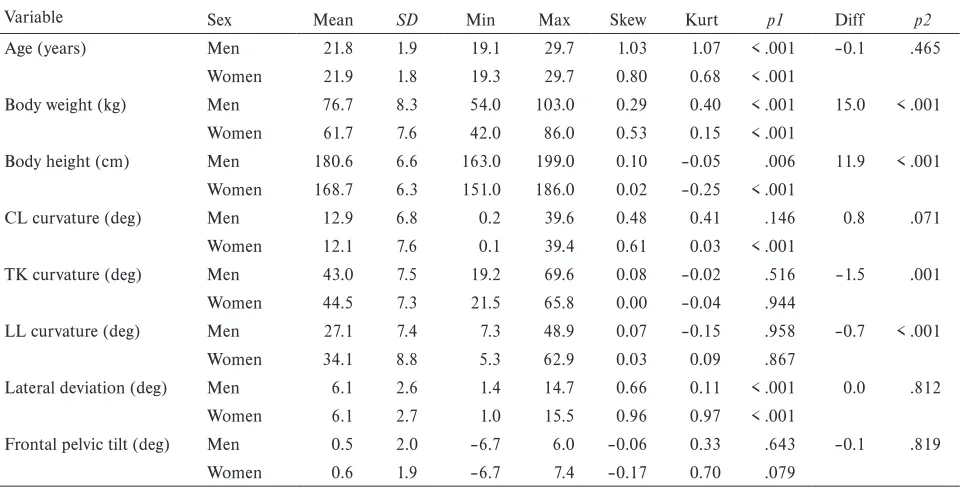
As shown in Table 1, no statistically significant differ-ence of age between men and women was found. The age was not of normal distribution, which was the result of the age structure of students participating in our study. The differences in weight and height were significant.
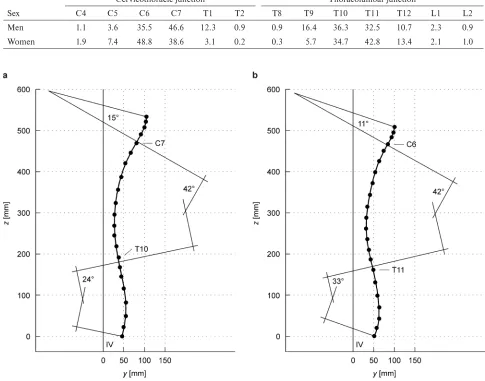
The sagittal spinal shape with the average values (Tables 1, 2) for a man can be described as follows: C3 – 12.9° – C7 – 43.0° – T10 – 27.1° – L5; and for a woman as follows: C3 – 12.1° – C6 – 44.5° – T11 – 34.1° – L5. Please note that the boundary vertebrae (C3 and L5) were given by the DTP-3 measuring pro-cedure. Cases that were the closest to the average shape of the spine are shown in Figure 2. As shown in Table 1, the probability distribution of CL curvature for women significantly differed from the normal distribution. Probability distribution of other variables could be con-sidered as normal. Men showed greater CL curvature (not statistically significant), significantly smaller TK curvature and significantly smaller LL curvature than women. Thus, it can be noted that there were ences between the sexes and the most noticeable differ-ence was manifested in LL.
Figure 2. Typical cases of sagittal spinal shape of a man (a) and a woman (b). Typical case was chosen as a shape of one subject whose spinal variables were closest to average values presented in Table 1. IV = vertical line erected from the centre of the connecting line between the calcanei.
Table 2
Percentage of cervicothoracic and thoracolumbar junctions occurrences
Sex
Cervicothoracic junction Thoracolumbar junction
C4 C5 C6 C7 T1 T2 T8 T9 T10 T11 T12 L1 L2
Men 1.1 3.6 35.5 46.6 12.3 0.9 0.9 16.4 36.3 32.5 10.7 2.3 0.9
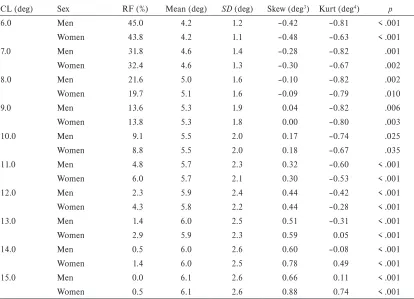
The frontal spinal shape can be described as fol-lows: average lateral deviation was 6.1° for both sexes, the difference between the sexes was not significant (Table 1). 9.1% of men and 8.8% of women exceeded the deviation of 10° (Table 3). 72.5% of men and 63.6% of women had left lateral deviation. Location of main lateral curve in men (women in parentheses) was as follows – thoracic-lumbar 36.4% (35.4%), cervical-thoracic 30.5% (33.6%), cervical-thoracic 28.6% (27.9%), and cervical-thoracic-lumbar 4.5% (3.1%). Probability dis-tribution of lateral deviation significantly differed from the normal distribution. The distribution was shifted to the right side, which was documented by the posi-tive value of the skewness (Table 1). Table 3 shows the behaviour of statistics if the subgroup of lateral devia-tion values up to a predefined limit was selected from the entire set. It is obvious that for the limit of 9° the skewness was close to zero, thus the distribution for this subgroup was the most symmetrical. However, the distribution did not resemble normal distribution, which was documented by the negative value of the kurtosis (–0.82 or –0.80, whereas the normal distribu-tion’s value is 0). Table 3 shows that distribution for all subgroups significantly differed from the normal
distribution. The closest to the normal distribution was the subset with the limit value of 10°, which was docu-mented by the highest achieved p value of Kolmogorov-Smirnov test. Based on these considerations we set a threshold of 10° and we divided the probability distri-bution of entire group into two parts. The first part had a symmetrical distribution near a normal distribution. This part included participants with a tiny deviation in range from 0 to 10° and contained 90.9% of men and 91.2% of women. We regarded these participants as physiological because such deviations occurred frequently in healthy population. The second part was considered as a right tail of probability distribution of the entire group. This part included participants with a deviation above 10° and contained 9.1% of men and 8.8% of women. We regarded these participants as non-physiological.
Discussion
The data of the spinal shape were obtained empirically from the population sample. This, however, does not mean neither that such a shape is optimal for the given
Table 3
Statistics of lateral deviation in subgroup truncated by means of cut-off level for lateral deviation
CL (deg) Sex RF (%) Mean (deg) SD (deg) Skew (deg3) Kurt (deg4) p
6.0 Men 45.0 4.2 1.2 –0.42 –0.81 < .001
Women 43.8 4.2 1.1 –0.48 –0.63 < .001
7.0 Men 31.8 4.6 1.4 –0.28 –0.82 .001
Women 32.4 4.6 1.3 –0.30 –0.67 .002
8.0 Men 21.6 5.0 1.6 –0.10 –0.82 .002
Women 19.7 5.1 1.6 –0.09 –0.79 .010
9.0 Men 13.6 5.3 1.9 0.04 –0.82 .006
Women 13.8 5.3 1.8 0.00 –0.80 .003
10.0 Men 9.1 5.5 2.0 0.17 –0.74 .025
Women 8.8 5.5 2.0 0.18 –0.67 .035
11.0 Men 4.8 5.7 2.3 0.32 –0.60 < .001
Women 6.0 5.7 2.1 0.30 –0.53 < .001
12.0 Men 2.3 5.9 2.4 0.44 –0.42 < .001
Women 4.3 5.8 2.2 0.44 –0.28 < .001
13.0 Men 1.4 6.0 2.5 0.51 –0.31 < .001
Women 2.9 5.9 2.3 0.59 0.05 < .001
14.0 Men 0.5 6.0 2.6 0.60 –0.08 < .001
Women 1.4 6.0 2.5 0.78 0.49 < .001
15.0 Men 0.0 6.1 2.6 0.66 0.11 < .001
Women 0.5 6.1 2.6 0.88 0.74 < .001
population nor that it points to how the shape should be (Keller et al., 2005).
Comparison between this study and other studies – sagit-tal plane
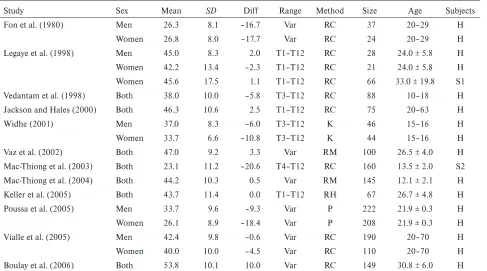
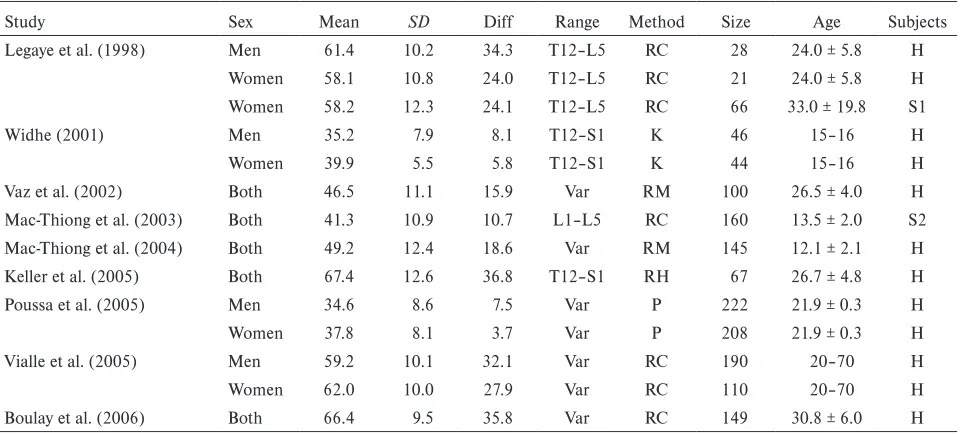
The sagittal shape of the spine has been studied. The results for TK are summarized in Table 4 and results for LL are summarized in Table 5. None of available studies analysed CL.
The TK curvature values do not differ from the values obtained in this study by more than 5° (Jack-son & Hales, 2000; Keller et al., 2005; Legaye et al., 1998; Vaz et al., 2002; Vialle et al., 2005), which can be considered as insiginificant difference (Kotwicki, 2008). Boulay et al. (2006) and Fon, Pitt, and Thies (1980) differ from this study by 10° or more. The above mentioned studies assessed TK using radiography and included normal adult subjects. Adolescent subjects were also assessed. Mac-Thiong et al. (2004) are in compliance with this study, whereas Vedantam, Lenke, Keeney, and Bridwell (1998) differed from this study. Non-radiographic methods were also used (Poussa et al., 2005; Widhe, 2001), both studies give values of
TK curvature by more than 5° below this study. It is not clear whether it may be caused only due to a dif-ferent method of calculating the curvature. Debrunner kyphometer, Spinal pantograph and the DTP-3 system each uses their own original method for the calculation of spinal curvature and these different methods cannot be simply comparable (Patias et al., 2010). The sagittal profile of scoliotic patients was assessed using radi-ography, Legaye et al. (1998) do not differ from this study, whereas Mac-Thiong, Labelle, Charlebois, Huot, and de Guise (2003) differ from this study by more than 20°. So, data about sagittal profile of scoliotic patients is not consistent. A question remains unan-swered, whether scoliotic patients show significantly different sagittal profile from the healthy population. Here, we believe that the spine with scoliosis should be examined and assessed three-dimensionally (Perdriolle et al., 2001).
The LL curvature values were assessed in healthy and scoliotic subjects using radiography (Boulay et al., 2006; Keller et al., 2005; Legaye et al., 1998; Mac-Thiong et al., 2004; Mac-Mac-Thiong et al., 2003; Vaz et al., 2002; Vialle et al., 2005). These studies differ from this
Table 4
Review of thoracic kyphosis curvatures(in degrees) in other studies
Study Sex Mean SD Diff Range Method Size Age Subjects
Fon et al. (1980) Men 26.3 8.1 –16.7 Var RC 37 20–29 H
Women 26.8 8.0 –17.7 Var RC 24 20–29 H
Legaye et al. (1998) Men 45.0 8.3 2.0 T1–T12 RC 28 24.0 ± 5.8 H
Women 42.2 13.4 –2.3 T1–T12 RC 21 24.0 ± 5.8 H
Women 45.6 17.5 1.1 T1–T12 RC 66 33.0 ± 19.8 S1
Vedantam et al. (1998) Both 38.0 10.0 –5.8 T3–T12 RC 88 10–18 H
Jackson and Hales (2000) Both 46.3 10.6 2.5 T1–T12 RC 75 20–63 H
Widhe (2001) Men 37.0 8.3 –6.0 T3–T12 K 46 15–16 H
Women 33.7 6.6 –10.8 T3–T12 K 44 15–16 H
Vaz et al. (2002) Both 47.0 9.2 3.3 Var RM 100 26.5 ± 4.0 H
Mac-Thiong et al. (2003) Both 23.1 11.2 –20.6 T4–T12 RC 160 13.5 ± 2.0 S2
Mac-Thiong et al. (2004) Both 44.2 10.3 0.5 Var RM 145 12.1 ± 2.1 H
Keller et al. (2005) Both 43.7 11.4 0.0 T1–T12 RH 67 26.7 ± 4.8 H
Poussa et al. (2005) Men 33.7 9.6 –9.3 Var P 222 21.9 ± 0.3 H
Women 26.1 8.9 –18.4 Var P 208 21.9 ± 0.3 H
Vialle et al. (2005) Men 42.4 9.8 –0.6 Var RC 190 20–70 H
Women 40.0 10.0 –4.5 Var RC 110 20–70 H
Boulay et al. (2006) Both 53.8 10.1 10.0 Var RC 149 30.8 ± 6.0 H
study by more than 10° (Table 5). None radiographic study is as close to this study as for the TK curvature. The mutual differences between the studies may be explained by a different age structure and different evaluation of the radiographic scan. Additionally, such a large difference between the above studies and this study could also result from the fact that the surface curve of end points of the spinous processes for LL does not copy the central line of vertebrae as well as for TK. Lumbar vertebrae are bigger than thoracic vertebra and in the LL area the soft tissues are thicker than in the TK area. Simultaneously, there is greater segmental curvature within one vertebra segment in LL than in TK, which impairs the transition of curvature of the internal structure to skin surface. Non-radiographic methods were used by Poussa et al. (2005) and Widhe (2001). The findings of both studies are closer to this study in comparison with studies using radiography. As a result it seems, that related to TK this study is closer to studies using radiography and in case of LL this study is closer to studies using surface non-radio-graphic methods.
Comparison between this study and other studies – fron-tal plane
The meta-analysis by Fong et al. (2010) covered 34 studies, which assessed the prevalence of scoliosis greater than 10° using Cobb’s method. The prevalence
ranged from 0.10% to 7.45% and the highest value is close to the value in this study. The meta-analysis by Grivas, Vasiliadis, Mouzakis, Mihas, and Koufopoulos (2006) covered 20 studies and worked with a hypothe-sis that prevalence of scoliohypothe-sis depends on geographical latitude. The prevalence ranged from 0.93% to 12.0% and the highest value exceeds the value in this study. Kratěnová, Žejglicová, Malý, and Filipová (2007) and Nissien et al. (2000) published a prevalence of 10.44%, and 9.20%, respectively and the values are close to the results of this study. Therefore, the results of this study are in concordance with the results of other studies despite that the range of published prevalence seems to be relatively large. The reasons for such variability could lie in: 1) different age structure of the study groups – scoliosis is most often assessed and reported for child and adolescent populations; 2) the spinal deformity in adulthood may be the result of negative factors such as long lasting incorrect sitting habits (Kratěnová et al., 2007) or unilateral sports overload (Omey, Micheli, & Gerbino, 2000); 3) studies included in the meta-analyses most frequently assess idiopathic scoliosis – structural deformity with rotation of ver-tebrae, however, this study could cover the so-called lateral curves with a spine shifted in the frontal plane but without the rotation of vertebrae. According to our opinion the lateral deviation up to 10° should not be considered pathological scoliosis and we agree with Table 5
Review of lumbar lordosis curvatures (in degrees) in other studies
Study Sex Mean SD Diff Range Method Size Age Subjects
Legaye et al. (1998) Men 61.4 10.2 34.3 T12–L5 RC 28 24.0 ± 5.8 H
Women 58.1 10.8 24.0 T12–L5 RC 21 24.0 ± 5.8 H
Women 58.2 12.3 24.1 T12–L5 RC 66 33.0 ± 19.8 S1
Widhe (2001) Men 35.2 7.9 8.1 T12–S1 K 46 15–16 H
Women 39.9 5.5 5.8 T12–S1 K 44 15–16 H
Vaz et al. (2002) Both 46.5 11.1 15.9 Var RM 100 26.5 ± 4.0 H
Mac-Thiong et al. (2003) Both 41.3 10.9 10.7 L1–L5 RC 160 13.5 ± 2.0 S2
Mac-Thiong et al. (2004) Both 49.2 12.4 18.6 Var RM 145 12.1 ± 2.1 H
Keller et al. (2005) Both 67.4 12.6 36.8 T12–S1 RH 67 26.7 ± 4.8 H
Poussa et al. (2005) Men 34.6 8.6 7.5 Var P 222 21.9 ± 0.3 H
Women 37.8 8.1 3.7 Var P 208 21.9 ± 0.3 H
Vialle et al. (2005) Men 59.2 10.1 32.1 Var RC 190 20–70 H
Women 62.0 10.0 27.9 Var RC 110 20–70 H
Boulay et al. (2006) Both 66.4 9.5 35.8 Var RC 149 30.8 ± 6.0 H
the threshold of 10° recommended by the Scoliosis Research Society (Kotwicki, 2008).
Study limitations
The most important limitation could be the selection bias because the recruitment of subjects from the age, gender, culture, and sport-related population was not random. Another source of weakness could be associ-ated with DTP-3 system that does not allow determin-ing the rotation of vertebrae and thus it is not capable of differentiating between structural scoliosis and a lateral deviation.
Conclusions
This study provided statistical data of spine shape in a group of healthy young adults in age between 19 and 30 years. Such statistical analysis should be part and parcel of determining the cut-off level for physiologi-cal spinal shape. This study provided empiriphysiologi-cal basis for determining the deviation of 10° as maximal non-pathological lateral deviation. Discrepancies between studies larger than 5° occurred. It is still unclear that it can be explained solely by using a different method for spinal shape measurement. Standardization of spinal shape measurement needs more work.
Acknowledgment
This study was supported by a grant from the Czech Science Foundation (GACR), No 202/09/P029, enti-tled “Creation of model and population norms of spine shape diagnosis using DTP-3 system in selected peer group”.
Conflict of interest
There were no conflicts of interest.
References
Boulay, C., Tardieu, C., Hecquet, J., Benaim, C., Mouille-seaux, B., Marty, C., … Pélissier, J. (2006). Sagittal align-ment of spine and pelvis regulated by pelvic incidence: Standard values and prediction of lordosis. European Spine Journal, 15, 415–422.
Doody, M. M., Lonstein, J. E., Stovall, M., Hacker, D. G., Luckyanov, N., & Land, C. E. (2000). Breast cancer mor-tality after diagnostic radiography: Findings from the U.S. Scoliosis Cohort Study. Spine, 25, 2052–2063.
Fon, G. T., Pitt, M. J., & Thies, A. C. (1980). Thoracic kyphosis: Range in normal subjects. American Journal of Roentgenology, 134, 979–983.
Fong, D. Y., Lee, C. F., Cheung, K. M., Cheng, J. C., Wah, B. K., Lam, T. P., … Luk, K. D. (2010). A meta-analysis of the clinical effectiveness of school scoliosis screening. Spine, 35, 1061–1071.
Grivas, T. B., Vasiliadis, E., Mouzakis, V., Mihas, C., & Koufopoulos, G. (2006). Association between adolescent idiopathic scoliosis prevalence and age at menarche in dif-ferent geographic latitudes. Scoliosis, 1, 9.
Jackson, R. P., & Hales, C. (2000). Congruent spinopelvic alignment on standing lateral radiographs of adult volun-teers. Spine, 25, 2808–2815.
Keller, T. S., Colloca, C. J., Harrison, D. E., Harrison, D. D., & Janik, T. J. (2005). Influence of spine morphology on intervertebral disc loads and stresses in asymptomatic adults: implications for the ideal spine. Spine Journal, 5, 297–309.
Kotwicki, T. (2008). Evaluation of scoliosis today: Examina-tion, X-rays and beyond. Disability and Rehabilitation, 30, 742–751.
Kratěnová, J., Žejglicová, K., Malý, M., & Filipová, V. (2007). Prevalence and risk factors of poor posture in school children in the Czech Republic. Journal of School Health, 77, 131–137.
Krejčí, J., Gallo, J., Salinger, P., & Štěpaník, P. (2012). Ověření přesnosti systému DTP-3 určeného pro neinva-zivní vyšetření tvaru páteře prostřednictvím rtg vyšetření [Validation of the DTP-3 System for noninvasive spinal shape measurement by comparison with X-Ray examina-tion]. Acta Chirurgiae Orthopaedicae et Traumatologiae Čechoslovaca, 79, 255–262.
Krejci, J., Gallo, J., Stepanik, P., & Salinger, J. (2012). Opti-mization of the examination posture in spinal curvature assessment. Scoliosis, 7, 10.
Legaye, J., Duval-Beaupère, G., Hecquet, J., & Marty, C. (1998). Pelvic incidence: A fundamental pelvic parameter for three-dimensional regulation of spinal sagittal curves. European Spine Journal, 7, 99–103.
Mac-Thiong, J. M., Berthonnaud, É., Dimar, J. R., Betz, R. R., & Labelle, H. (2004). Sagittal alignment of the spine and pelvis during growth. Spine, 29, 1642–1647.
Mac-Thiong, J. M., Labelle, H., Charlebois, M., Huot, M. P., & de Guise, J. A. (2003). Sagittal plane analysis of the spine and pelvis in adolescent idiopathic scoliosis accord-ing to the coronal curve type. Spine, 28, 1404–1409. Nissien, M. J., Heliöwaara, M. M., Seitsamo, J. T., Könönen,
M. H., Hurmerinta, K. A., & Poussa, S. (2000). Develop-ment of trunk asymmetry in a cohort of children ages of 11 to 22 years. Spine, 25, 570–574.
Omey, M. L., Micheli, L. J., & Gerbino, P. G., II (2000). Idiopathic scoliosis and spondylolysis in the female ath-lete. Tips for treatment. Clinical Orthopaedics and Related Research, 372, 74–84.
Perdriolle, R., Borgne, P. L., Dansereau, J., de Guise, J., & Labelle, H. (2001). Idiopathic scoliosis in three dimen-sions. Spine, 26, 2719–2726.
Phiri, P. D., Krejčí, J., & Salinger, J. (2009). Assessment of the influence of examination postures on postural stability by means of the DTP-3 diagnostic system. Acta Universita-tis Palackianae Olomucensis. Gymnica, 39(2), 43–52. Poussa, M. S., Heliöwaara, M. M., Seitsamo, J. T., Könönen,
M. H., Hurmerinta, K. A., & Nissinen, M. J. (2005). Development of spinal posture in a cohort of children from the age of 11 to 22 years. European Spine Journal, 14, 738–742.
Ronckers, C. M., Land, C. E., Miller, J. S., Stovall, M., Lonstein, J. E., & Doody, M. M. (2010). Cancer mor-tality among women frequently exposed to radiographic examinations for spinal disorders. Radiation Research, 174, 83–90.
Vaz, G., Roussouly, P., Berthonnaud, E., & Dimnet, J. (2002). Sagittal morphology and equilibrum of pelvis and spine. European Spine Journal, 11, 80–87.
Vedantam, R., Lenke, L. G., Keeney, J. A., & Bridwell, K. H. (1998). Comparison of standing sagittal spinal align-ment in asymptomatic adolescents and adults. Spine, 23, 211–215.
Vialle, R., Levassor, N., Rillardon, L., Templier, A., Skalli, W., & Guigui, P. (2005). Radiographic analysis of the sag-ittal alignment and balance of the spine in asymptomatic subjects. Journal of Bone and Joint Surgery. American Vol-ume, 87, 260–267.