O'Connor, N., Farag, K and Baines, R. 2016. What is Food Poverty? A Conceptual Framework. British Food Journal, 118 (2), pp.429-449.
What is Food Poverty? A
Conceptual Framework
by
O'Connor, N., Farag, K.W, and Baines, R.N.
Copyright, Publisher and Additional Information:
Author’s accepted manuscript published by Emerald in the British Food Journal
DOI:
10.1108/BFJ-06-2015-0222
A note on versions:
For Review Only
What is Food Poverty? A Conceptual Framework
Journal: British Food Journal
Manuscript ID: Draft
Manuscript Type: General Review
Keywords: food poverty, food security, food policy
For Review Only
What is Food Poverty? A conceptual Framework
12
1 Introduction
3As an issue which has seen increased recognition in recent years, food poverty
4
within the United Kingdom (UK) has been subject to public, private and
5
governmental interest. Loopstra & Tarasuk (2013, p.1316) stated that “household
6
food insecurity is increasingly being recognised as a serious public health problem in
7
high income countries”. A high level of inflation on essential goods and services,
8
coupled with lower disposable income has increased pressure upon households in
9
achieving an adequate diet. Meanwhile the use of food banks has escalated with all
10
regions affected; consumers have expressed apprehension about food affordability
11
and have petitioned for the issue to be debated in the House of Commons (HC Deb,
12
2013). Businesses and charities such as Kellogg’s, Tesco, Oxfam and Red Cross,
13
have identified the problem and responded proactively by engaging in research,
14
providing support and partnering with food distribution schemes. With these
15
concerns in place, the government has instigated investigations through groups such
16
as; the All Party Parliamentary Group (APPG) and the Department for Environment,
17
Food and Rural Affairs (DEFRA).
18
Dowler & O Connor (2012) considered food poverty from a rights based perspective,
19
in the role of the government and food systems in the provision and security of
20
adequate food for a nutritionally satisfactory diet. By providing a strong emphasis
21
upon UN agreements for health and nutrition, it was made evident that the
22
government holds responsibility in ensuring that the UK population achieve an equal
23
ability in achieving an adequate diet, particularly in the circumstance where
24
individuals are unable to meet this need. The question of whether this is currently
25
For Review Only
satisfactory was raised, particularly as national intervention is argued to be less
26
effective than that of local or targeted practices. De Schutter (2009) shared this view
27
stating that “Save in situations of natural disasters or civil strife, the right to food is
28
not the right to be fed; it is the right to feed oneself in dignity’. This has occurred
29
within the UK wherein changes to purchasing behaviour saw households substitute
30
products for lower quality, less nutritious goods which were more calories dense
31
(Griffith, et al., 2013a).
32
The purpose of this study is to improve understanding of food poverty within the UK
33
through a meticulous examination and synthesis of the dimensions of existing
34
literature in order to provide scope for further research. To achieve this, the review
35
initially develops a comprehensive definition of food poverty and then utilises this to
36
investigate UK food poverty within an international context. A discussion of both
37
points provided an overall insight of the issue, wherein a UK specific definition
38
supports examination of the development of food poverty and how it is currently
39
understood. The comparable international exploration of food poverty furthers the
40
definition on a global scale and contextualises the situation in the UK against that of
41
other countries by highlighting similarities and differences.
42
43
2 Review Strategy
44An exploratory approach utilising secondary research was conducted to assemble
45
sufficient information to ensure an extensive examination, consisting of several
46
sources inclusive of academia, government, and non-governmental organisations.
47
The literature was screened for relevance following a broad search which primarily
48
focused upon UK publications, with the exception of national data relevant to
49
For Review Only
specified countries of USA, Canada, Yemen and United Republic of Tanzania
50
(Tanzania). Key literature included national economic data consisting of the
51
consumer price index (CPI) to represent national inflation of goods and services.
52
Additionally studies conducted on behalf of government such as: Lambie Mumford,
53
et al (2014), APPG (2014) are highly relevant to this topic given the scope of the
54
studies, relevance to the UK and their timeliness, it is also demonstrative of the rising
55
interest in food poverty by the government. Prior to this, much of the available
56
literature was produced independently by charitable organisations (e.g. Trussell
57
Trust and Oxfam), some of these studies have been incorporated despite a lack of
58
subjection to a peer review process, as they were produced by reliable
59
organisations.
60
Timeliness was a crucial factor in the construction of this paper, given the extent of
61
studies conducted in recent years which has increased knowledge of food security
62
and food poverty issues, also given the propensity for change due to economic and
63
national circumstances. As a result of this, 64% of literatures utilised were published
64
between 2013-2014, with 8% published prior to 2005. The parameters of this review
65
were restricted given the breadth of the subject matter, which limited alternative
66
discussion points, including individual knowledge and capabilities, physical access
67
and perceived availability, consumer attitudes, causal linkages with social welfare
68
and sanctions and dietary health needs. These limitations were imposed to enabled
69
a broader discussion of the subject and illustrates the role in which a comprehensive
70
definition can be utilised to encompass the constituents of food poverty.
71
72
For Review Only
3 Defining Food Poverty
73
Maslen, et al. (2013) discussed that the definition of UK food poverty developed over
74
time as understanding advanced and yet there remains no consensus for a standard
75
definition, an impediment for the comprehension and conceptualisation of the issue.
76
This disunity is problematic for several reasons including: as an obstacle in
77
academic and political examination, difficulty in ascertaining the quantity or
78
characteristics of individuals classified as such and constraints in addressing related
79
demands.
80
A number of widely utilised definitions were examined to distinguish areas of
81
weakness and compatibility and to enable creation of an appropriate definition.
82
These definitions display similarities between food poverty and food security in the
83
corresponding principles to the pillars of food security: access, availability, utilisation
84
and stability. It is important to note that food insecurity can exist without food poverty
85
as a contributing influence however food poverty cannot exist without food insecurity,
86
as illustrated by figure 1. Furthermore it is possible for food insecurity to develop as a
87
result of pressures to an individual pillar, while food poverty is driven by a
88
combination of the pillars. The distinction for food poverty can be identified wherein
89
economic access is the predominant component, although it is not the sole
90
characterising element. This is supported by APPG (2014) who identified the key
91
drivers as: unemployment, debt and reliance on social welfare, in addition to other
92
causes such as: access to information and poor skills. Furthermore Coe (2013,
93
p.332) stated that “food poverty does not simply occur due to a lack of money but
94
also develops as a result of a number of other factors, such as a lack of knowledge,
95
skills or equipment to prepare healthy foods”. The positioning of food poverty within
96
food insecurity is attributed to the role of the individual pillars wherein economic
97
For Review Only
access was determined to be the predominant influence and availability of goods the
98
lowest impact.
99
100
Placement of Figure 1 Relationship between food poverty and food security 101
102
The relationship between food poverty and food insecurity can be identified through
103
the similarities in definition of these terms. Food security is defined as “Fwhen all
104
people, at all times, have physical and economic access to sufficient, safe and
105
nutritious food to meet their dietary needs and food preferences for an active and
106
healthy life (FAO,1996). This definition was expanded by FAO (2002) to incorporate
107
social access, acknowledging its vital role within the concept. Due to a lack of
108
consensus for a food poverty definition, a range of definitions utilised in the UK were
109
investigated to identify and illustrate the diversity of terminology, definitions identified
110
within Maslen, et al. (2013) were explored, in addition to definitions by authors
111
including; Anderson (1990), Moore (2012) and Food Ethics Council (2013). Food
112
poverty is the inability;
113
“Fto afford, or to have access to, food to make up a healthy diet” (Department of
114
Health, 2005, p.7)
115
“...to access a nutritionally adequate diet and the related impacts on health, culture
116
and social participation” (Friel & Conlon, 2004, p.120)
117
“.. of individuals and households to obtain an adequate and nutritious diet, often
118
because they cannot afford healthy food or there is a lack of shops in their area that
119
are easy to reach” (Food Standards Agency, 2014)
120
For Review Only
Furthermore while not specific to food poverty, a frequent term utilised to define food
121
poverty is; “Hunger is the inability to acquire or consume an adequate quality or
122
sufficient quantity of food in socially acceptable ways, or the uncertainty that one will
123
be able to do so’ (Radimer, et al. 1992).
124
The following common features were identified in the majority of the terminology;
125
economic access, quality, quantity, duration and social dimension. Based upon these
126
elements the proposed concise definition was constructed as; food poverty is the
127
insufficient economic access to an adequate quantity and quality of food to maintain
128
a nutritionally satisfactory and socially acceptable diet.
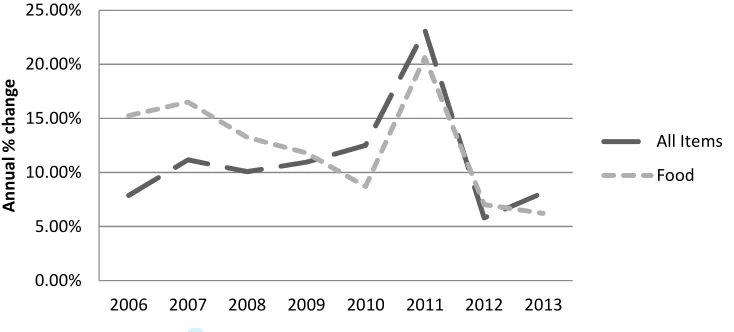
129
3.1 Components of Food Poverty
1303.1.1 Economic access 131
As previously stated, this principle component is essential as income and price
132
determine the ability to procure food and governs the extent to which an individual
133
can achieve the additional elements, to obtain an adequate quantity and quality of
134
food for a nutritious diet, to ensure that this can be achieved immediately and for the
135
foreseeable future and the role of social attributes. Low income consumers place
136
price as a crucial determinant in food expenditure with other influences including
137
demographic, behavioural and lifestyle characteristics (Burns, et al. 2013 and Lee, et
138
al. 2011).
139
3.1.2 Adequate quality 140
Food should be nutritionally satisfactory without being inferior in terms of production,
141
manufacturing or preparation. Products targeted at low income consumers can be
142
substandard comparatively, both in nutrition and condition with Dowler & O Connor
143
(2012) arguing that food poverty had advanced from insufficient economic access to
144
nutritionally poor food choices, as “cheap” food targeted toward low income
145
For Review Only
consumers can be high in fat, sugar and salt (Dowler, 2008). It has been found that
146
consumers altered expenditure towards products with higher calorie content and fail
147
to meet dietary recommendation, particularly relating to fruit and vegetable
148
consumption (DEFRA, 2013). Price can be an impediment to achieving a healthy
149
diet, however it is conceivable to acquire nutritional sound goods within a lower
150
budget, as demonstrated by Cooper & Nelson (2003) where six basic products were
151
evaluated and found to have higher nutritional value than premium counterparts.
152
3.1.3 Adequate quantity 153
Multiple studies have established that many consumers cut back on food purchases
154
and skipped meals as a result of inadequate income (Cooper & Dumpleton, 2013
155
and McHardy, 2013). It is believed that 36% of retired households cut back on food
156
purchases and 1 in 5 mothers regularly skipped meals to ensure their children could
157
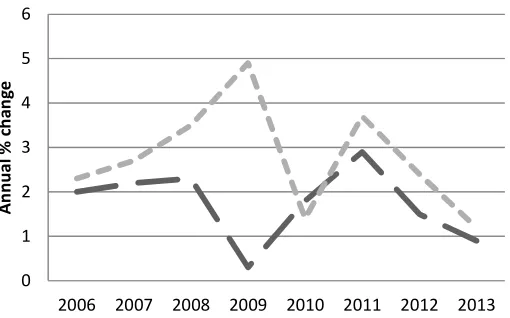
eat (Cooper & Dumpleton, 2013). Increased cost of food has impacted upon
158
purchasing behaviour where consumers between 2007-2012 purchased 7% less
159
food, despite a rise in food expenditure of approximately 20% (Cooper & Dumpleton,
160
2013). Regardless of sufficient quality, an adequate volume is required to achieve an
161
appropriate diet.
162
3.1.4 Duration 163
The classification of Food insecurity as chronic or transitory affects the causes, risks,
164
and solutions and was exemplified through food aid provision where the users of
165
food banks in the UK were identified primarily as experiencing a transitory difficulty,
166
whereby there was a short term, temporary need (Sosenko, et al. 2013). Alternative
167
services such as free school meals and soup kitchens offer continual assistance,
168
providing aid to chronic food insecurity sufferers. The duration and severity of an
169
insufficient diet can impact health as expressed by Martin & Lippert (2012) who
170
contested that low food security is related to being overweight, whereas very low
171
For Review Only
food security is related to being underweight. This is concerning given the increase
172
in malnutrition of 19% between 2013-2014 and estimates that 25% of population was
173
obese in 2012 (Faculty of Public Health, 2014 and OECD, 2014).
174
3.1.5 Social dimension 175
A difference between existing definitions is whether social acceptability is a criterion
176
for inclusion, as several authors excluded the term. It is well established that food
177
serves a purpose beyond nutrition, satisfying emotional, social and cultural needs.
178
Social acceptability is central to food purchasing behaviour as “...the urban food
179
environment shapes and reinforces social stratification” Cannuscio, et al. (2014,
180
pp.18). Burns, et al. (2013) investigated the role of social acceptability within food
181
purchasing behaviour among low income households and found that these decisions
182
were motivated by four goals, to obtain sufficient food to satiate hunger, to acquire
183
desired food products, to gain adequate food when money ran out and to gather food
184
with positive emotional connection. Additionally it was identified that comfort food
185
was purchased regardless of whether sufficient income was available for other
186
expenditure. This is supported by Lee, et al. (2011) who reviewed multiple studies to
187
surmise that additional factors in food purchasing include ethnic background,
188
convenience, habit and body image. Furthermore education and skills can
189
contribute towards risk factors as a higher education level is associated with better
190
diet while the reduction of at home cooking has negatively impacted the
191
intergenerational transmission of these skills meals (Smith, et al., 2014 and Ricciuto,
192
et al., 2006).
193
4 Food Poverty: International Perspectives
194Between 2005- 2008, global food prices rose by 83% with basic agricultural
195
commodity prices such as wheat, rice, corn and soybean achieving record highs
196
For Review Only
(UN, 2011 and Mittal, 2009). A study conducted by Seale, et al. (2003) of 114
197
countries found that low income countries were approximately twice as responsive to
198
changes to food prices as middle or high income countries. Nord, et al. (2014) stated
199
that an increase in the relative price of food compared to CPI of 1% was associated
200
with 0.6% increase in prevalence of food insecurity. Organisation for Economic
Co-201
operation and Development (OECD) countries were found to experience significantly
202
lower inflation, with a peak of 7% in 2008, compared with 23% in Africa (Economist,
203
2014). This is illustrated by the range of volatility experienced by the countries
204
examined, with the exception of the USA where data was unavailable, as shown in
205
table 1. Conversely, volatility in the UK exceeded that of Tanzania at several
206
conjectures, demonstrating the extent of volatility which impacted the UK.
207
208
Placement of Table 1 Annual domestic food price volatility index (FAO, 2014a) 209
210
Net food consumers in developing countries spend a large percentage of
211
expenditure on food, estimated between 60-80%, contrasted with 10-20% in wealthy
212
countries (UNCTAD, 2008). Within urban areas in developing countries, there are
213
fewer food producers, and households are reliant upon market systems to access
214
food, leaving them susceptible to the price volatility (Tacoli, et al., 2013 and Mittal,
215
2009).
216
As a result of the food price spike, poverty rates measured as US$1p/day increased
217
by 4.5% in low income countries (Ivanic & Martin, 2008). This is supported by Wodon
218
& Zaman (2009) who found that higher prevalence of poverty in Sub Saharan Africa
219
was attributable to the negative effect of inflation on consumer purchasing power.
220
For Review Only
Internationally it is estimated that 68million additional individuals fell below the
221
poverty line as a direct consequence of rising food prices in 2007-08 (World Bank,
222
2011). In 2012, 28.2% of Tanzania were classified as below the national poverty
223
line, with 43.5% had an income lower than $1.25 a day and 73% below $2per day
224
(World bank, 2014), The food price spike of 2007-08 increased poverty levels in
225
Yemen by 44%, with 45% of the population below the poverty line (UNICEF & WFP,
226
2014). Extreme poverty is less prevalent in developed countries, given higher levels
227
of household income; however relative poverty remained comparatively stable. In
228
2013, 14.5% of American and 11.9% of Canadian population were classified as
229
experiencing relative poverty, in comparison to 15% of the UK population BHC
230
(DeNavas-Walt & Proctor, 2014 and OECD, 2014).
231
An inability to afford food increases susceptibility to health risks due to an
232
inadequate diet, such as malnutrition, nutrition deficiencies and stunting (Tacoli, et
233
al., 2013 and UN, 2011). Internationally 805million individuals were estimated to be
234
chronically undernourished in 2012-2014, the majority of whom are resident in
235
developing countries, approximately 790.7million individuals, the remaining 15
236
million individuals are in developed countries (Food and Agriculture Organisation
237
(FAO), 2014b). Despite food insecurity pressures overall the volume of individuals
238
reported as malnourished internationally has reduced from 18.7% in 1990/92 to
239
11.3% in 2012/14.
240
Economic accessibility of food is vital to national security and insufficient access can
241
result in extreme reactions, as demonstrated by the food price riots of 2007-2008
242
where many countries experienced civil unrest and violent protests (Berazneva &
243
Lee, 2013). there were a number of underpinning circumstances which contributed
244
towards the food riots of 2007-08, which were explored by Berazneva & Lee (2013),
245
For Review Only
whereby causal linkages were found between the likelihood to particpate in food riots
246
and economic, demographic and political elements related to poverty, urbanization,
247
oppressive political structures, and higher civil liberties in addition to coastal location
248
and food availability and access.
249
4.1 Case Studies: Developing Countries
250Tanzania was ranked as 159 of 187 countries in 2014 UNDP human development
251
index, due to the extent of poverty and deprivation, with 19% of the population living
252
below the food poverty line in 2007 and 43% of households not consuming enough
253
calories in 2010-11 World Food Programme (WFP) (2013). Comparatively, Yemen
254
was graded as 154 but was the 8th most food insecure country in the world (Von
255
Grebmer, et al., 2014) with 10.6 million individuals, 41% of the population food
256
insecure in 2014 (UNICEF & WFP, 2014). Attributable to food security risks relating
257
to socioeconomic problems aggravated by 07-08 price spike and 2011 politic crisis,
258
in addition to resource depletion and environmental threats (UNICEF & WFP, 2014).
259
While the causes of food insecurity in Tanzania are inclusive of drought, high food
260
and oil prices, insufficient infrastructure, seasonal shortages and lack of dietary
261
diversity. Both countries recorded high levels of chronic and acute health concerns
262
relating to malnutrition, stunting and dietary deficiencies, in Yemen, 46.6% of
263
children were stunted or chronically malnourished (SOFI, 2014), with just 12.4%
264
meeting WHO’s dietary diversity recommendations (UNICEF & WFP, 2014). In
265
Tanzania 34.6% of children were malnourished between 2012-2014 (FAO, 2014b).
266
Food price inflation is above that of average inflation rates, and significantly higher
267
than that in developed countries. Given that a higher percentage of expenditure in
268
these areas is attributable to food purchases, any increase in prices can create
269
reduction in affordability. High inflation contributed towards diminished food security
270
For Review Only
in both countries, with food prices in Tanzania volatile and consistently above
271
inflation rates with both countries experiencing a significant increase, although
272
political unrest in Yemen contributed to the sharp incline in 2011, as shown in figures
273
2 and 3.
274
275
Placement of Figure 2 CPI in Tanzania, 2010= 100. (derived from National Bureau of Statistics, 2014) 276
277
Placement of Figure 3 CPI in Yemen, 2008=100. (derived from Central Statistical Organisation, 2014; 278
Central Statistical Organisation, 2010) 279
280
It is evident that both countries were subject to poor government coping strategies,
281
and as such were reliant on external aid. More than half the population of Yemen,
282
14.7million individuals relied on humanitarian assistance in 2014 according to the
283
Yemen humanitarian response plan, with approximately 6million individuals reached
284
through WFP’s main programme (UNICEF & WFP, 2014). Less physical food aid is
285
provided to Tanzania where WFP supplies food approximately 1.6million individuals
286
through programmes such as food for education, food for assets and maternal and
287
child health programme. These countries have been experiencing severe food
288
security risks, of which food poverty, driven by reduced purchasing power and
289
inflation is one of many contributing elements.
290
4.2 Case Studies: Developed Countries
291In Canada, food insecurity has been consistently monitored and has shown a steady
292
increase from 2005. In 2012, approximately 13%, 4 million individuals were food
293
insecure (Tarasuk, et al., 2014). Similarly in America, food insecurity was found to
294
rise substantially between 2008- 2013, from 36.2 million in 2007 to 49.1million
295
(approximately 15%), with 6.8million recorded as in very low food insecurity
296
For Review Only
(Coleman-Jensen, et al., 2014). However Weinfield, et al. (2014) argued that
297
17.6million were food insecure, which highlights the disparity in preferred
298
measurement systems.
299
Coping strategies for food shortages were similar between these countries, and differ
300
dependant on duration, with the most utilised options including delaying bills, rent
301
and selling possessions (Weinfield, et al., 2014 and Loopstra & Tarasuk, 2013b). In
302
America, it was found that 96% of respondents substituted products, while 88%
303
reduced the volume used, while 79% purchased unhealthy inexpensive food, 40%
304
watered down food and drink (Feeding America, 2012). Whereas in food insecure
305
households in Canada, 98.1% stated they had reduced portion size or skipped
306
meals, 83.1% relied on low cost food for children’s meals (Tarasuk, et al., 2014).
307
Additionally there are charitable and governmental services which provide aid to food
308
insecure households. Federally assisted programmes in America have an uptake of
309
approximately 60% amongst food insecure households of at least one programme.
310
In spite of this in 2012, 27% of the food insecure were ineligible for federal
311
assistance as household income was above the required criteria (Weinfield, et al.,
312
2014). Due to this, there is reliance upon alternate food assistance, of which there is
313
an extensive system that is partially supported by Feeding America, who provide
314
food for an estimated 46.5million individuals per year, equating to approximately
315
62% of national food aid distribution (Weinfield, et al., 2014). Comparatively a survey
316
of 4,743 food banks in Canada were found to assist 833,098 individuals in March
317
2013, an increase of 23% from March 2008 (Food Banks Canada, 2013), although
318
just ¼ of food insecure Canadians are believed to avail of this, due to preference or
319
inaccessibility. With food banks usually providing 5 days were of food to each
320
individual, this is suggestive that approximately 3,500,000 meals were distributed.
321
For Review Only
Additionally it was recorded that 4,341,659 meals were provided by other services
322
such as soup kitchens, breakfast clubs and shelters (Food Banks Canada, 2013).
323
Volatile food prices contributed to reduced purchasing power, food prices exceeded
324
the average rate of inflation. Figures 4 and 5 show the difference in CPI for Canada
325
and USA, where the initial peak in food prices was experienced first by USA, both
326
countries saw a significant drop the subsequent years as reactive measures were
327
enacted.
328
329
Placement of Figure 4 CPI Canada, 2002=100. (derived from Statistics Canada, 2014) 330
331
Placement of Figure 5 CPI USA, 2005=100. (derived from Crawford & Church, 2014) 332
333
5 Food Poverty: UK
334From a historical perspective, in the UK gross disposable household income (GDHI)
335
was relatively high in 2013 yet in real terms from 2009, income had reduced to levels
336
of 2002-03 (Office of National Statistics (ONS), 2014a and Levy, 2013). Equivalised
337
income levels developed at different rates for socio economic groups, and in the
338
period 2007/08-2012/13 the greatest reduction in income was experienced by the top
339
quintile (5.2% reduction of £3300); comparatively the bottom quintile experienced an
340
increase of 3.5% (£400) (ONS, 2014a). There is an unequal distribution of income
341
between locations, as demonstrated by GDHI per person in 2012 in table 2 where
342
London the highest levels were recorded in London at 27.7% above the national
343
average, whereas the lowest income was found in Northern Ireland at 17.2% below
344
(ONS, 2014b).
345
For Review Only
346Placement of Table 2 GDHI per head 2012, (data from ONS, 2014b) 347
348
Lee, et al. (2014) found that much of UK poverty is centralised to cities and that
349
areas with relatively low poverty rates, retain “concentrations of deprivation”, which
350
illustrates location based inequality. From 2008, individuals who had been suffering
351
from poverty have experienced greater levels of deprivation, while more people have
352
become increasingly vulnerable due to economic stagnation, increased living costs
353
and public service reductions (Oxfam, 2012 and Joseph Rowntree Foundation,
354
2013a). Following 2007; households have also been subjected to benefit cuts, lower
355
disposable income and unemployment, furthering financial pressures (Coe, 2013).
356
In 2012, 13 million people were estimated to be in relative poverty after housing
357
costs (figure 6) with 21% of the population were estimated to be in relative poverty in
358
2012/13 (Department Work and Pensions (DWP), 2012). Comparatively before
359
housing costs, relative poverty was recorded at a lower level (6% lower in 2012/13),
360
indicating that this fixed cost can increase vulnerability to poverty.
361
362
Placement of Figure 6 Percentage of individuals in relative poverty. (data from ONS, 2014) 363
364
In a study of multiple deprivation ONS (2013) identified that approximately 1/3 of the
365
population were unable to cope with unexpected financial expenses, however
366
Gordon, et al. (2013) stated that almost half the UK population are experiencing
367
financial insecurity, with 18million people unable to afford adequate housing
368
conditions and 4million improperly fed. There was a 10% increase in the percentage
369
For Review Only
of the country unable to cope with unexpected financial costs from 2007-11 which
370
demonstrates a rise in households inability to adapt to shocks (table 3).
371
Placement of Table 3 Percentage of population unable to afford specific items 05-11. (data from DWP, 372
2012) 373
374
Increased inflation can exacerbate pressure on household budgets and CPI annual
375
rate of inflation shows volatility within the previous decade, with peaks in 2008 and
376
2011, comparable to international trends. Inflation was inconsistent across
377
expenditure categories (figure 7) where overall between 2007-2014, CPI increased
378
by 21.5% while food (35.9%), alcohol (43.9%) and housing & fuel (34.1%) all
379
demonstrated significantly higher increases in price.
380
381
Placement of Figure 7 Difference in CPI 2007-2014. (data from ONS, 2014a) 382
383
It is important to note that food inflation regularly exceeded CPI for all items (figure 8)
384
and that food prices in 2014 remained at similar levels to the previous year which
385
contrasted to the volatility shown in the earlier stages. Within this category, all items
386
increased in price from 28% for milk, egg and cheese to 47.8% for oils and fats, as
387
shown in figure 9. Inflation affected all food goods and occurred at separate points
388
during the 2007-2014 period. The greatest annual increase in price occurred in 2008,
389
with highs of 17.2% for oils and fats and 15.1% for milk, egg and cheese.
390
391
392
Placement of Figure 8 CPI UK, 2006=100. (data from ONS, 2014a) 393
394
For Review Only
395Placement of Figure 9 Growth in CPI inflation 2007-14. (data from ONS, 2014a) 396
397
Food accounts for 17.5% of total household expenditure on average, succeeded by
398
fuel and housing. Increased inflation of this category affects available funding for
399
other expenditure categories (Griffith, et al., 2013a). Low income households are
400
particularly susceptible to food price increases as argued by Lang & Schoen (2014),
401
Revoredo-Giha, et al., (2009) and Downing, et al., (2014). A study of consumer
402
perception found that increased cost, particularly of food was a particular concern to
403
consumers with 37% of respondents stating that they were finding it difficult to afford
404
the variety of food they wanted, a figure which increased to 50% for households with
405
income below £14000 (Dowler, et al., 2011)
406
One change in consumer purchasing behaviour has been product substitution,
407
reflected in the growth of discount retailers such as Aldi and Lidl, where consumers
408
have elected to move from national brands towards cheaper products. Consumer
409
studies have found that as a result of “economic stagnation”, consumer behaviour
410
has altered, with lower levels of brand loyalty, with greater focus upon price (Lamey,
411
2014). As discount retailers offer a means to reduce food expenditure, they have
412
experienced growth as a result. Reduced purchasing power is linked to the growth of
413
both hard and soft discount retailers (Lamey, 2014). Grocery discount retailers grew
414
by 33.4% between 2008 and 2011 with 6.2% of grocery sales in 2014, with this trend
415
predicted to continue with sales estimations of 10.9% in 2019 while supermarket own
416
label products have grown by 9.3% annually (Institute of Grocery Distribution (IGD),
417
2014 & Keynote, 2013). This behaviour change illustrates that people are changing
418
where they shop, away from where they would normally go, driven partially by price.
419
For Review Only
6 Discussion
420
Through an examination of existing literatures on the subject, food poverty has been
421
defined as the insufficient economic access to an adequate quantity and quality of
422
food to maintain a nutritionally satisfactory, socially acceptable diet. This brief,
423
comprehensive term encompasses five elements which are popularly utilised within
424
the current knowledge of the issue, yet differentiates itself in several ways. First this
425
definition was developed specific for UK application with an awareness of the
426
influential role of household finance in meeting dietary requirements. Secondly,
427
simple terminology was employed to enable multi level use and understanding.
428
Thirdly, the role of a social dimension is recognised as a pertinent factor to individual
429
requirements given the influence of factors such as education, skills, culture,
430
preferences, and emotional relationship with products.
431
Definitions which discuss food poverty have been widely utilised in the UK, however
432
it is argued that these established definitions are insufficient to describe food
433
poverty. Faults in established definitions include misrepresentation wherein quotes
434
have been taken out of context (Radimer, et al., 1992), overly generalised, where the
435
term is descriptive of food security rather than focussed upon food poverty
436
(Anderson, 1990) and incomplete terminology, in that all contributing factors to food
437
poverty have not been included (Department of Health, 2005).
438
6.1 UK Food Poverty
439Food prices in the UK were found to increase higher and persist longer than other
440
OECD countries and this prolonged experience increased the cumulative effect upon
441
individuals, worsening their circumstances (Griffith, et al., 2013a). Purchasing power
442
reduced due to a decline in real income and increased inflation, for example median
443
real income for parents with dependent children fell 7.5% between 2007-2011
444
For Review Only
(Griffith, et al., 2013a). Food, as a relatively flexible expense allows consumers to
445
reduce expenditure on this category. Griffith, et al. (2013b) explored the difference in
446
consumer purchasing behaviour between 2005-07 and 2010-12 and found that all
447
households reduced real expenditure on food and on average, households reduced
448
real expenditure on food (into the home) by 8.5% and reduced purchased calories by
449
3.6%, equating to a lower expenditure per calorie of 5.2%. However Coe (2013)
450
found that the lowest income households spent 17% more on food between 2007-11,
451
and received 3.2% less products.
452
The increased pressure upon households has increased reliance upon food
453
assistance, as demonstrated with the growth of Trussell Trust which showed growth
454
of 32,350% between 2005-06 to 2013-14, with 913,138 people utilising the service in
455
2013-14 (figure 10). There have been several publications relating to food parcel
456
distribution; Lambie-Mumford, et al. (2014), Maslen, et al. (2013), Downing, et al.
457
(2014) and Lyall, (2014), which found a growing demand for food assistance
458
throughout the country however data on demand for other services is unavailable,
459
and figures for food bank usage is reliant upon Trussell Trust data although there are
460
multiple food assistance resources available which have yet to be examined. While
461
this information may be indicative of national growth experienced by food parcel
462
providers, Sosenko, et al. (2013) identified that Trussell Trust was not necessarily
463
the dominant provider of food aid in all areas. Comparatively, it was believed that
464
Trussell Trust provided approximately two thirds of food parcels for Dundee and
465
20% in Glasgow (Sosenko, et al., 2013).
466
467
468
For Review Only
Placement of Figure 10 Percentage growth in Trussell Trust reliance. (data from Trussell Trust, 2014) 469
470
6.2 UK and International Comparison
471A fundamental dissimilarity expressed by Nord (2009) that starvation is a rare
472
occurrence in developed countries, with a more likely outcome to be a reduction in
473
quality and quantity of food amongst low-middle income households. Dowler & O
474
Connor (2012) supported this belief, stating that as a result of diminished affordability
475
the frequency of food consumption and the nutritional quality of food had reduced.
476
Evidenced by the prevalence of malnourishment and nutrient deficiency in
477
developing countries and obesity and over nutrition in developed countries.
478
Darmon & Drewnowski (2008) found a correlation in developed countries between
479
income and obesity and micronutritient deficiency, with the causal mechanisms
480
between diet quality and low income consumers consisting of food prices & diet
481
costs, food access, education & culture while Ricciuto, et al. (2006) and Smith, et al.
482
(2014) found that knowledge, skills, time and available funds contribute towards
483
individuals diets, with low income consumers purchasing less raw ingredients such
484
as fruit and vegetables, in favour of ready to eat and calorie dense products.
485
The development of inflation within the case study countries examined, table 4
486
shows that inflation was significantly higher and more volatile in developing
487
countries, yet the UK regularly exceed inflation for the other developed countries,
488
consistent with food price volatility.
489
Placement of Table 4 CPI annual percentage change. (Data from Crawford & Church, 2014; Statistics 490
Canada, 2014; Central Statistical Organisation, 2014; Central Statistical Organisation, 2010 and World 491
Bank, 2014b) 492
Reliance upon food aid was found to increase in developed countries, however at a
493
lower growth rate than the UK, while physical food aid towards developing countries
494
For Review Only
has fallen. Reliance upon food banks in developed countries is significant with
495
millions of meals distributed each year. Despite established measures available to
496
address this demand, the level of support following the reduction in food affordability
497
failed to completely meet the needs of individuals, in most developed or developing
498
countries.
499
The volume of users has been monitored for these services in many countries, a
500
matter which has not been possible within the UK, as there is currently no cohesive
501
body to track this development. Similarly, food poverty has been explored in depth
502
within the case study countries, providing a foundation upon which to compare the
503
UK situation however further research is required in the uk to ascertain nationally
504
specific understanding. This is emplefied by the countries examined who held
505
measurement toolkits to determine the quantity of indivuals classified as food
506
insecure or as food impoverished, such methods have not been undertaken within
507
the uk.
508
Other food insecurity risks which occur concurrently increase the risk of food poverty,
509
as seen in developing areas, yet within the UK, the affordability of food is the
510
predominant concern. The cumulative impact of food poverty can reduce resilience
511
and prolong the negative consequences for individuals.
512
7 Conclusion
513Food poverty is not a new problem as a result of food price spikes of 2007/08, as
514
evidenced by a history of food aid. However increases in food and energy prices
515
reduced food affordability for almost all socio economic groups around the world with
516
the lowest income households impacted most severely. As an area with numerous
517
For Review Only
gaps in research, there is broad scope for further study to fully understand the extent
518
of the situation both internationally and within the UK.
519
An identification of the components of food poverty through an examination of the
520
existing terminology enables the creation of a definition which encompasses all
521
contributing factors. The advantage in ascertaining this information is to promote
522
unity in discussion and examination by all interested stakeholders, where previously
523
discord and misunderstanding impeded discussion and examination of the subject.
524
Establishing a definition facilitated examination of the UK and international
525
environment, in addition to empowering further research and minimising current gaps
526
in knowledge.
527
Comparative to the countries examined, the UK has significant gaps in
528
understanding inclusive of; numbers and classification of individuals experiencing or
529
vulnerable to food poverty, causes and symptoms of food poverty, methods of
530
alleviation, short and long term consequences associated with transitory and chronic
531
food poverty, impact upon consumer behaviour and coping strategies employed.
532
These are areas which have been analysed in other regions with recognisable
533
parallels; however there are limited academic studies which are UK specific. Utilising
534
available knowledge from areas with substantial expertise, these issues are
535
recommended for further research, to improve understanding of the subject relevant
536
to the UK.
537
Despite indications that UK food poverty is an escalating problem, due to limited
538
measurement studies, this cannot be presented with certainty, as such the creation
539
and application of measurement indicators would be beneficial to quantify individuals
540
classified as in food poverty. Furthermore, there is a general lack of knowledge
541
For Review Only
regarding identification of vulnerable individuals particularly amongst minority
542
groups, and whether any correlation exists with influences such as; ethnicity, religion
543
and education. In addition to ascertaining the severity of this problem, it would
544
improve the ability to target vulnerable individuals.
545
As a subject which has been acknowledged as a significant concern to society, it
546
would be advantageous to determine the extent of national food poverty, both in the
547
short term (to identify and meet the needs of vulnerable individuals) and in the long
548
term (to determine the long term impacts of the present problem and to forecast
549
likely trends). By investigating food poverty from a broad focus, it was found that this
550
was not exclusive to the UK, and as an ongoing challenge it appears to be
551
escalating, both nationally and internationally.
552
553
For Review Only
References 554
555
Anderson, S. A. (1990) Core Indicators of Nutritional State for Difficult-to-Sample
556
Populations, Journal of Nutrition, Nov 1990, vol.120, pp. 1559-1600
557
558
All Party Parliamentary Group on Hunger and Food Poverty (APPG) ( 2014) Feeding
559
Britain; A Strategy for Zero Hunger in England, Wales, Scotland and Northern
560
Ireland, the Children’s Society, London, 8.12.2014
561
562
Berazneva, J. & Lee, D.R. (2013) Explaining the African Food Riots of 2007–2008:
563
An Empirical Analysis, Food Policy, vol. 39, pp. 28-39
564
565
Cannuscio, C.C., Hillier, A., Karpyn, A. & Glanz, K. (2014) The Social Dynamics of
566
Healthy Food Shopping and Store Choice in an Urban Environment, Social Science
567
and Medicine, Vol. 122, pp. 13-20
568
569
Central Statistical Organisation (2014) Statistical Yearbook 2013, 22.07.2014,
570
available at: http://www.cso-yemen.org/
571
572
Central Statistical Organisation (2010) Statistical Yearbook 2009, 13.06.2010,
573
available at: http://www.cso-yemen.org/
574
575
Coe, S. (2013) Feeding the Family, Are Food Prices Having an Effect, British
576
Nutrition Foundation, Nutrition Bulletin, vol. 38, pp 332-336
577
578
Coleman-Jensen, A., Gregory, C., & Singh, A. (2014) Household Food Security in
579
the United States in 2013, EFF-173, US Department of Agriculture, Economic
580
Research Service, Washington, Sept 2014
581
582
Cooper, N. & Dumpleton, S. (2013) Walking the Breadline; the Scandal of Food
583
Poverty in 21st Century Britain, Oxfam & Church Action on Poverty, Manchester, May
584
2013
585
586
For Review Only
Cooper, S. & Nelson, M. (2003) Economy Line Foods From Four Supermarkets and
587
Brand Name Equivalents; a Comparison of their Nutrient Contents and Costs,
588
Journal of Human Nutrition and Dietetics, vol. 16, no. 5, pp.339-347
589
590
Crawford, M. & Church, J. (2014) CPI Detailed Report, US Bureau of Labour
591
Statistics, Washington, Aug 2014
592
593
Darmon, N. & Drewnowski, A. (2008) Does Social Class Predict Diet Quality?
594
American Journal of Clinical Nutrition, Vol. 87, pp.1107-1117
595
596
DEFRA (2013) Family Food 2012, Family Food Statistics, DEFRA, London,
597
12.12.2013
598
599
Department of Health (2005) Choosing a Better Diet: A Food and Health Action Plan,
600
NHS, London, 09.03.2005
601
602
Department of Work & Pensions (DWP) (2012) Households Below Average Income.
603
An Analysis of the Income Distribution 1994/95 – 2010/11, London, June 2012
604
605
DeNavas-Walt, C. & Proctor, B.D. (2014) Income and Poverty in the United States:
606
2013, US Census Bureau, Current Population Reports, Washington, Sept 2014
607
608
De Schutter, O. (2009) The Right to Food and the Political Economy of Hunger,
609
Twenty-sixth McDougall Memorial Lecture, Opening of the 36th Session of the FAO
610
Conference
611
612
Dowler, E (2008) Policy Initiatives to Address Low-Income Households’ Nutritional
613
Needs in the UK, Proceedings of the Nutrition Society, vol. 67, pp. 289-300
614
Dowler, E, Kneafsey, M, Lambie-Mumford, H., Inman, A., Collier, R (2011) Thinking
615
About Food Security, Engaging With UK Consumers. Critical Public Health, Vol. 21,
616
No. 4, pp. 403-416
617
618
For Review Only
Dowler, E. & O'Connor, D (2012) Rights Based Approaches to Addressing Food
619
Poverty and Food Insecurity in Ireland and UK, Social Science and Medicine, Vol.
620
74, pp. 44-51
621
622
Downing, E., Kennedy, S. & Fell, M. (2014) Food Banks and Food Poverty, House of
623
Commons Briefing Paper, London, 09.04.2014
624
625
FAO (2014a) Food Security Indicators; Domestic Food Price Volatility, 17.11.2014,
626
available at: www.fao.org
627
628
FAO (2014b) The State of Food Insecurity in the World, FAO, IFAD & WFP, Rome,
629
16.09.2014
630
FAO (2002) The State of Food Insecurity in the World 2001. Rome
631
FAO (1996) Rome Declaration on World Food Security and World Food Summit Plan
632
of Action, World Food Summit, 13-17 November 1996, Rome
633
Feeding America (2012) In Short Supply; American Families Struggle to Afford
634
Everyday Essentials, Chicago, available at:www.feedingamerica.org
635
636
Food Banks Canada (2013) Hunger Count, Food Banks Canada, Toronto
637
638
Friel, S. & Conlon, C. (2004) Food Poverty and Policy Ireland: Combat Poverty
639
Agency, Dublin, April 2004
640
641
Food Standards Agency (2014) Food Poverty, available at: www.food.gov.uk
642
643
Griffith, R., O’Connell, M. & Smith, K. (2013a) Food Expenditure and Nutritional
644
Quality over the Great Recession, IFS Briefing Note BN143, ESRC, Nov 2013
645
646
Griffith, R., Lluberas, R. & Lührmann, M. (2013b) Gluttony in the UK? Long-Term
647
Change in Diet, IFS Briefing Note BN142, Nov 2013
648
649
For Review Only
Gordon, D., Mack, J., Lansley, S., Main, G., Nandy, S., Patsios, D. & Pomati, M.
650
(2013) The Impoverishment of the UK, Poverty and Social Exclusion, ESRC,
651
28.03.2013
652
653
House of Commons Hansard Debates, 18.11.2013, col. 806
654
655
Institute of Grocery Distribution (IGD) (2014) UK Grocery Market to be Worth £203bn
656
by 2019, 30.06.2014
657
658
Ivanic, M. & Martin, W. (2008) Implications of Higher Global Food Prices for Poverty
659
in Low-Income Countries. World Bank Policy Research Working Paper, No. 4594
660
Washington, World Bank. April 2008
661
662
Keynote (2013) Discount Retailing Market Update 2013, available at:
663
www.keynote.co.uk
664
665
Lamey, L. (2014),"Hard Economic Times: A Dream for Discounters", European
666
Journal of Marketing, Vol. 48, no. 3/4 pp. 641-656
667
668
Lang, T. & Schoen, V. (2014) UK Food Prices, Cooling or Bubbling. Food Research
669
Collaboration
670
671
Lee, J H, Ralston, R.A. & Truby, H (2011) Influence of food Cost on Diet Quality and
672
Risk Factor for Chronic Disease: A Systematic Review. Nutrition and Dietetics, vol.
673
68, pp. 248-261
674
675
Lee, N., Sissons, P., Hughes, C., Green, A., Atfield, G., Adam, D. & Rodriguez-Pose,
676
A. (2014) Cities, Growth and Poverty; A Review of Evidence. Joseph Rowntree
677
Foundation, Feb 2014
678
679
Loopstra, R .& Tarasuk, V. (2013) Severity of Household Food Insecurity is Sensitive
680
to Change in Household Income and Employment Status Among Low Income
681
Families, American Society for Nutrition, Journal of Nutrition, vol. 113, 12.06.2013
682
683
For Review Only
Martin, M. A. &Lippert, A (2012) Feeding her Children, but Risking her Health: The
684
Intersection of Gender, Household Food Insecurity and Obesity, Social Science and
685
Medicine, vol. 74, no. 11, pp. 1754-1764
686
687
Maslen, C., Raffle, A., Marriot, S and Smith, N (2013) Food Poverty, What Does the
688
Evidence Tell Us, Appendix, Bristol City Council, July 2013
689
690
McHardy, F. (2013) Surviving Poverty, The Impact of Loan Parenthood, Research
691
into Impacts of Poverty on Lone Parents in Rural Fife, Poverty Alliance
692
693
Mittal, A (2009) The 2008 Food Price Crisis: Rethinking Food Security Policies, G-24
694
Discussion Paper Series, UNCTAD, No. 56, June 2009
695
696
Moore, R (2012) Definitions of Fuel Poverty, Implications for Policy, Energy Policy,
697
Vol. 49, pp. 19-26
698
699
National Bureau of Statistics (2014) Annual Average Inflation Rates for the Past Five
700
Years from 2009 – 2013, Dar es Salaam, Tanzania, 08.01.2014
701
702
Nord, M., Coleman-Jensen, A. & Gregory, C. (2014) Prevalence of U.S. Food
703
Insecurity is Related to Changes in Unemployment, Inflation, and the Price of Food,
704
USDA, Economic Research Report Number 167, Washington, June 2014
705
706
Nord, M (2009).Food Spending Declined and Food Insecurity Increased for
Middle-707
Income and Low-Income Households from 2000-2007, Economic Information
708
Bulletin, No. 61, United States Department of Agriculture, Economic Research
709
Service, Washington, Oct 2009
710
711
OECD (2014) Obesity And The Economics Of Prevention: Fit Not Fat, Key Facts –
712
England, Update 2014, 27.05.2014, available at: www.oecd.org
713
714
ONS (2014a) Consumer Price Indices - CPI indices: 1988 to 2014, Dataset,
715
accessed 01.08.2014, available
at:http://www.ons.gov.uk/ons/datasets-and-716
tables/data-selector.html?cdid=D7BT&dataset=mm23&table-id=1.1
717
For Review Only
718ONS (2014b) Regional Gross Disposable Household Income 2012, ONS, London,
719
04.06.2014
720
721
ONS (2013) Poverty and Social Exclusion in the UK and EU 2005-11, ONS, London,
722
16.01.2013
723
724
Radimer, K. L., Olson, C. M., Green, J. C., Campbell, C. C. & Habicht, J. P. (1992).
725
Understanding Hunger and Developing Indicators to Assess it in Women and
726
Children, Journal of Nutrition Education, Vol.24, no.1, pp. 36-44
727
728
Revoredo-Giha, C., Leat, P., Kupiec-Teahan, B., Lamprinopoulou, C. & Cacciolatti,
729
L. (2009) Assessing the Effect of the Rise in Food Prices on the Purchasing Power
730
of Consumers in Scotland, Project Report, Scottish Agricultural College
731
732
Ricciuto, L., Tarasuk,V. & Yatchew, A. (2006) Socio-demographic Influences on
733
Food Purchasing Among Canadian Households, European Journal of Clinical
734
Nutrition, vol. 60, pp. 778–790
735
736
Seale, J., Regmi, A. & Bernstein, J. (2003) International Evidence on Food
737
Consumption Patterns, Technical Bulletin 1904, Washington, United States
738
Department of Agriculture
739
740
Smith, L.P, Ng, S.W. & Popkin, B.M (2014) Resistant to the Recession: Low-Income
741
Adults’ Maintenance of Cooking and Away-From-Home Eating Behaviors During
742
Times of Economic Turbulence, American Journal of Public Health, Vol. 104, no. 5,
743
pp. 840-846
744
745
Sosenko, F., Livingstone, N. & Fitzpatrick, S. (2013) Overview of Food Aid Provision
746
in Scotland, Edinburgh, Scottish Government
747
748
Statistics Canada, (2014) Consumer Price Index, Table 326-0021, available at:
749
http://www5.statcan.gc.ca/cansim/a47
750
751
For Review Only
Tacoli, C., Bukhari, B., & Fisher, S. (2013) Urban Poverty, Food Security and
752
Climate Change, Human Settlements Working Paper No.37, Rural-Urban
753
Interactions and Livelihood Strategies, International Institute for Environment and
754
Development, March 2013
755
756
Tarasuk, V., Mitchell, A. & Dachner, N, (2014) Household Food Insecurity in Canada
757
2012, Research to Identify Policy Options to Reduce Food Insecurity (PROOF),
758
Toronto
759
760
UNICEF & WFP (2014) Comprehensive Food Security Survey, WFP, Yemen,
761
November 2014
762
763
Von Grebmer, K., Saltzman, A., Birol, E., Yohannes, Y., Menon, P., Thompson, J.,
764
Wiesmann, D., Prasai, N., Yin, S. and Sonntag, A. (2014) Global Hunger Index, The
765
Challenge of Hidden Hunger, IFPRI, 30.10.2014
766
767
Weinfield, N., Mills, G., Borger, C., Gearing, M., Macaluso, T., Montaquila, J. &
768
Zedlewski, S. (2014) Feeding America, Hunger in America 2014, National Report,
769
Washington, August 2014
770
771
Wodon, Q. & Zaman, H. (2009) Higher Food Prices in Sub-Saharan Africa: Poverty
772
Impact and Policy Responses. World Bank Research Observer Vol.25 no.1, pp.157–
773
176
774
775
World Bank (2014), World Development Indicators, Poverty Headcount Ratio,
776
available at: www.data.worldbank.org
777
778
World Bank (2014b) World Development Indicators, Inflation; Consumer Prices,
779
available at: www.data.worldbank.org
780
781
World Bank (2008) Global Food Prices for Poverty in Low-Income Countries, World
782
Bank Policy Research Working Paper, No. 4594, Washington, World Bank, April
783
2008
784
785
For Review Only
World Bank (2011) Food Price Watch, World Bank Washington, February 2011
786
787
WFP (2013) Comprehensive Food Security and Vulnerability Analysis, Tanzania
788
2012, WFP, Sep 2013
789
790
For Review Only
FiguresFigure 1 Relationship between food poverty and food security
Access
Stability
Availability
Utilisation
Food
Poverty Food Security
For Review Only
Figure 2 CPI in Tanzania, 2010= 100. (derived from National Bureau of Statistics, 2014)0 5 10 15 20 25
2009 2010 2011 2012 2013
a
n
n
u
a
l
%
c
h
a
n
g
e
All items
Food
For Review Only
Figure 3 CPI in Yemen, 2008=100. (derived from Central Statistical Organisation, 2014; Central Statistical Organisation, 2010)
0.00% 5.00% 10.00% 15.00% 20.00% 25.00%
2006 2007 2008 2009 2010 2011 2012 2013
A
n
n
u
a
l
%
c
h
a
n
g
e
All Items
Food
For Review Only
Figure 4 CPI Canada, 2002=100. (derived from Statistics Canada, 2014)0 1 2 3 4 5 6
2006 2007 2008 2009 2010 2011 2012 2013
A
n
n
u
a
l
%
c
h
a
n
g
e
All Items
Food
For Review Only
Figure 5 CPI USA, 2005=100. (derived from Crawford & Church, 2014)-1 0 1 2 3 4 5 6 7
2006 2007 2008 2009 2010 2011 2012 2013 2014
A
n
n
u
a
l
%
c
h
a
n
g
e
All Items
Food
For Review Only
Figure 6 Percentage of individuals in relative poverty. (data from ONS, 2014) 0
5 10 15 20 25 30
in
d
iv
id
u
a
ls
i
n
p
o
v
e
rt
y
(
%
)
Before Housing Costs After Housing Costs
For Review Only
Figure 7 Difference in CPI 2007-2014. (data from ONS, 2014a) -20.0
0.0 20.0 40.0 60.0 80.0 100.0
%
For Review Only
Figure 8 CPI UK, 2006=100. (data from ONS, 2014a)-2 0 2 4 6 8 10
2006 2007 2008 2009 2010 2011 2012 2013 2014
A
n
n
u
a
l
%
c
h
a
n
g
e
Year
All items
Food
For Review Only
Figure 9 Growth in CPI inflation 2007-14. (data from ONS, 2014a) 0
5 10 15 20 25 30 35 40 45 50
C
P
I
in
fl
a
ti
o
n
% change 2007-2014