Inzinerine Ekonomika-Engineering Economics, 2011, 22(1), 5-13
Sustainable Urban Transport System Development Reducing Traffic Congestions
Costs
Arturas Kersys
Kaunas University of Technology
Kestucio str. 27, LT-44312, Kaunas, Lithuania e-mail: arturas.kersys@ktu.lt
Traffic congestions are formed due to irrational city facilities in communication terms and improper traffic system’s facilities; improper crossings of streets with intense traffic; absence of high-speed continuous traffic
main streets; no passenger traffic parking lots in the largest routs. In consequence of congestions there arises increasing pollution, impairment of people health and economic loss.
Investigation of traffic flows is complex multidimensional task, solution complication of which depends on complexity extent of transport network. In order to analyze the particularity of forming congestions, investigation describing in details the interaction of vehicles and road facilities are necessary.
The main research purpose is to determine vehicle‘s waste of time with flow close to system overcrowding or moving in congestion. In order to evaluate congestions expenses and rare occasional loss many parameters and assumptions are necessary, because these parameters are expressed by physical expressions. The most important of them are: value of travel time is used to convert time loss and/or reduced reliability and comfort into monetary units; variation of demand, defining reaction of possible consumers to internalization of exterior expenses of congestions.
Expenses evaluation methods used are based on the evaluation of travel time. To this end lots of investigations have been performed in various European countries. Actually experts are inclined to use general VOTvalues for public and goods traffic. Traffic flow intensity is determined by specified averages traffic flow speeds in separate sectors, travel time and, the main thing, defining sector throughput. Flow particularity has been determined, as well, i.e. impact of a number of lanes and evaluated wasted time with different intensity of vehicles flow.
Having data on traffic flows, it is possible to determine frequency of arriving and outgoing vehicles and time intervals between them and evaluate situation in a crossing. Schemes of vehicles movement were formed, projecting the arrival of vehicles one by one or by blocks, and data on flows directions and intensity collected. According to queue extent it is possible to judge about quality of traffic control system and loading of crossing with transport and forecast possible congestions.
After the analysis of some transport flows in the city traffic, investigation of traffic congestions reasons, these conclusions could be made: there is no methodical
facilities development programme of the city streets; roads with intense traffic crossings of the city are old-fashioned,
and their throughput is three or four times smaller than streets throughput and traffic flows intensity; there is no high speed public traffic service created and this becomes a pretext to use an individual transport, increasing traffic intensity and traffic congestions; there is no reverse lanes in the streets with intense traffic, what could increase road throughput and no public transport traffic lights before crossings, which at least would reduce, congestions of this traffic.
Sustainable urban traffic system development reducing congestions costs shall be based on long term “sustainable people and goods mobility vision“.
Keywords: urban transport, sustainable development, traffic congestions, external costs.
Introduction
In a most important European economy parts - transport sector about 7 % of CIP there is produced and more than 5 % of EU working places are guaranteed (2009). Admitting transport importance in order to achieve social and economic cohesion of regions, European and world, assuring European industry ability and realizing Lisbon’s objectives, it could be stated that some fields of European transport system still do not meet the objectives of sustainable development.
Mobility and transport activity scale is growing in the world due to the increment of population and improvement of life quality (Cruzado, 2005, Ciegis, 2009, Kazlauskaite, 2008, Kilijoniene, 2010, Startiene, 2009). Amount of motorcars in the world might increase from approximately 700 mln at present up to more than - 3 mlrd in 2050 and if there are no vehicles less polluting environment or quite environment-friendly ones and a new mobility conception is not developed, big harmony and husbandry problems will arise.
In urban traffic policy till now there was the most important aspect – to meet traffic request, even a new request. Traffic needs were developed, because, firstly subsidies in economic aspect were granted to individual motor vehicles, economic division of labor was supported just taking into account the possibility of getting cheap oil and producing places and settlements.
and organizational control of traffic flows (Bickel, 2006): “Exterior expenditure of internalization realization strategy“, “Mobility actions plan in the city“, “Road traffic 2020“.
While preparing new mobility conception it is important to investigate comprehensively the problems of the formation of traffic flows and compulsory mobility. Discussion on the nature of stable development strategy is necessary, because in this strategy till now traffic policy there was integrated insufficiently, thus ensuring possibility for future generations of using mobility freedom (Ciegis, 2009, Litman, 2001, Zuidgeest, 2006).
Research problem: investigation of possibilities to reduce factors conditioning forming of traffic jams in urban traffic network and costs caused by them.
Research objectives: to perform investigation of traffic congestions in urban traffic network and to find out part of congestions costs, evaluating waste of time and fuel consumption.
Research subject: traffic flows, congestions expenses, sustainable development of urban traffic system.
Research methods: natural traffic flows investigation, systemic analysis of scientific literature, statistical data grouping and comparative analysis.
Reasons of traffic congestions formation in an urban transport system
The main problem in Lithuania, as in all countries, there exists traffic congestions, formed because of these reasons (Butkevicius, 2005, Ilgakojyte-Bazariene, 2005, Jakimavicius, 2009, Guzys, 2006): irrational city facilities in communication terms and improper traffic system’s facilities; improper crossings of streets with intense traffic;
absence of the main streets of high-speed continuous
traffic; no passenger traffic parking lots in the largest routs;
irrational usage of streets with intense traffic driving part.
In consequence of congestions there arises increasing pollution, impairment of people health, and economic loss.
Every working day morning and afternoon traffic
congestions are formed on the main city roads and they last
one, two, sometimes even three hours. Subject to traffic
intensity, crossings throughput, compatibility of traffic
regulation, accidents, every car spends in congestions from some minutes to some tens of minutes. Some drivers in the
congestions get into damage situations or traffic accidents, and the situation becomes heavier.
Irrational urban facilities in communication terms
Typical urban structure attributes:
– Central city part with narrow streets surrounding blocks of flats, buildings of administrative, cultural purpose – architecture monuments.
– Medium city part with broader streets, bigger blocks of flats, industrial and administrative buildings. – Asymmetric city dwelling and industrial
micro-districts formed in the last century.
Concentration of working places in the central zone of the city or in opposite sides of dwelling districts forms pulsatory flows of passengers in the morning and afternoon hours.
Figure 1. Zones of working places in Kaunas city (Andersson, 2006)
This statement is confirmed by traffic flows in Kaunas city investigation presented in this work, demonstrating that there exist pronounced asymmetrically located,
„sleeping“ zones in the city suburbs (Silainiai, Eiguliai,
Kalnieciai, Dainava), and working places are concentrated
in the city centre and in the eastern city part. Therefore in the morning passengers and traffic flows move urban centre and through centre by transit to other part, and in the evening they return back.
People’s choice to live away from the city pollution, industrial and traffic noise is quite natural. To decentralize
working places is not so simple, since sanitary standards do not permit building industrial plants in dwelling districts.
Irrational usage of streets with intense traffic
At present in Kaunas city there is one street (Vytauto Didziojo Bridge) with reverse traffic lane. Reverse traffic lanes themselves effectively reduce jams on the roads and crossings. To use this lane with the lane for public traffic and mounting a public traffic lights at the crossing, allows large effect in improvement of passengers traffic.
No effective high speed public traffic service
Use of public traffic is too little because of low average driving speed, insufficient comfort of service, idle time in
congestions, as well because that there are no car parking lots in the beginning of routes (park-and-ride system).
Improper facilities of traffic system
For the analysis of the facilities of the urban traffic system, facilities of streets, crossings and traffic control and traffic structure of transport, taking part in traffic, are accentuated.
In order to secure safe, rhythmical and continuous traffic, facilities of streets and crossings has to meet intensity of passengers and traffic flows. The analysis of throughput of streets and crossings demonstrated, that the throughput of streets, crossing in one-level crossings, is used just by quarter, so, conclusion should be done, that reason of traffic congestions is not an insufficient throughput of streets, but too small throughput of the crossings.
Big impact on traffic intensity and traffic congestions
Statistical traffic researches data illustrate, that using of cars with average just 1.5 of passenger is the largest (even 69%) (Andersson, 2006). At the same time amount of buses, trolleys and microbuses, in total, makes up just 13.3%, though during congestions at least on an average 50 passengers go by them.
No high-speed continuous traffic main streets
While analyzing the main streets with intense traffic, no street with continuous traffic flow was found. High-speed and continuous traffic is possible just in the streets with two-level crossings, at least, and pedestrian traffic isolated or organized perfectly. An absence of continuous high-speed traffic the main streets force drivers to choose not the best driving routes, and this increases possibility of congestions.
No motor-less traffic facilities
Bicycle transport is one of ecological traffic, as communication means, usage possibilities. Another bicycle advantage is that people have good chance to improve in health. Therefore bicycle paths should be laid not by roads, but within flat blocks away from motorcars traffic flows. Then this traffic type will be more attractive and be in service in reducing traffic congestions on roads (Wang, 2008).
After the analysis of Kaunas urban public traffic routes (buses, trolleys and microbuses) and traffic flows (Figure 2), the conclusion should be stated, that the main corridors are the same – both for public traffic, and for individual - it is northern city part - centre .
The largest traffic flows in Kaunas city are at exits and entries to the centre, where streets of high throughput with large traffic intensity meet together– Savanoriu av., Jonavos st. and Karaliaus Mindaugo av., Veiverių st. Cars’ flows moving by them distribute among some Senamiestis streets of smaller throughput (Sv. Gertrudos, Gimnazijos, Birstono, Saukliu st.), making jams in them (especially during peak hours).
Figure 2. Scheme of Kaunas urban public transport routes and traffic flows (Andersson, 2006)
Evaluation of expenses for urban traffic congestions
The main research purpose – to determine vehicle‘s waste of time with flow close to system overcrowding or moving in congestion.
In order to evaluate congestions expenses and rare occasional loss many parameters and assumptions are necessary, because these parameters are expressed by physical expressions. The most important of them are (Armelius, 2005, Grant-Muller, 2007, Verhoef, 2004):
− value of travel time is used to convert time loss and/or reduced reliability and comfort into monetary units;
− speed-flow relations, describing additional vehicle impact on transport system and, herewith, expenses of other consumers and society;
− variation of demand, defining reaction of possible consumers to internalization of exterior expenses of congestions.
Expenses evaluation methods used are based on evaluation of travel time. To this end lots of investigations have been performed in various European countries (Cordis, 2000, Doll, 2002, Johansson, 1997). Actually experts are inclined to use general VOTvalues for public and goods traffic.
Marginal exterior congestions costs for concrete traffic level are calculated (Bilbao-Ubillos, 2008, Maibach, 2008, Safirova, 2007):
( )
( )
( )
Q Q v Q v
Q VOT Q
MSCsp δ
δ
× ×
= 2 , (1)
here MSCsp- marginal exterior congestions costs; VOT-
value of time (Lt./vh.h.); Q- existing traffic level (vh./h.);
( )
Qv - function of traffic flow (km/h.).
Exterior costs are the difference between social (appearing due to usage of traffic facilities – wear of facilities, congestions, environmental pollution, traffic accidents) and internal costs (conditioned by traffic user – wear of vehicle, energy expenditure, time expenditure, transport taxes and tariffs).
Function of speed-flow depends on facilities’ features, topography, weather conditions, network structure, possible travel alternatives, various traffic regulations (speed control, embark/loading procedures and so on) and driving habits.
All estimation steps depend considerably on dynamics of variation of transport system, quality of data available, and time evaluation. There are two groups in evaluation methodology (De Palma, 2005, Goodwin, 2003, Luo, 2007, Stathopoulos, 2002): congestions of narrow places, forming in road crossings and mostly prevailing in towns and settlements; congestions of flows, referring to exceeding possibilities of transit in concrete sections.
Investigation of traffic flows is a complex multidimensional task, solution complication of which depends on complexity extent of a transport network. In order to analyze the particularity of forming of congestions, investigation describing in details interaction of vehicles and road facilities are necessary.
While researching traffic flows, generalization problem is encountered. Firstly, it is a problem of vehicle’s individuality. Together with a driver vehicles are separate subjects with unique features, therefore in flows they depend on other vehicles, since they cannot move absolutely freely. Modern vehicles are designed to meet requirement to stand up in traffic flow, i.e. sustain normal dynamics of traffic flow.
It is rather complicated to evaluate individuality of all vehicles to investigate, therefore vehicles classification with some changes is used for research: cars, light trucks and microbuses, trucks of an average loading capacity, magistral trucks and trackers, buses.
This classification reflects particularity of vehicles moving in the city (vehicles of bigger size move slower in narrow streets), their acceleration and deceleration characteristics. Because of dynamics particularity (transportation of people), moving restrictions (required standings in stops) and impact on other vehicles, public traffic is excluded as a specific task.
Congestions of “flows” and “narrow places” are accentuated in investigation. Congestions of the first type appear, when street sector or part of traffic system is traffic-overloaded because arriving and outgoing vehicles flows are inadequate. Arriving vehicles’ flow is defined by oncoming sector throughput, outgoing – by throughput of the sector itself and existing behind it one.
The throughput of a street sector is evaluated by the parameter of traffic intensity – amount of vehicles for time unit. If an average vehicle speed in a sector is known:
v k L
v I
v⋅ +
= , (2)
Here kv =0.3−0.5,v– speed in sector [km/h]; L– length
of a car.
The main feature is an average vehicle speed in the sector, depending on facilities elements, traffic intensity, and vehicle characteristics. These parameters are associated, because, when approaching congestion making limit, cars’ interaction appears. Traffic flow intensity is determined with specified averages traffic flows speeds in separate sectors, travel time and, the main thing, in defining the sector throughput. Flow particularity has been determined, as well –impact of number of lanes and evaluated wasted time with different intensity of vehicles flow. Having data on traffic flows, it is possible to determine frequency of arriving and outgoing vehicles and time intervals between them and evaluate situation in a crossing. Schemes of vehicles movement were formed, projecting arriving of vehicles one by one or by blocks, and data on flows directions and intensity collected. According to queue extent it is possible to judge about quality of traffic control system and loading of crossing with transport and forecast possible congestions.
Traffic flow is not ideal – single drivers are unable to keep the minimal permitted distance between vehicles. In four-lanes streets crossings where duration of green traffic
lights signal is 30 s, with permitted speed 40 km/h in a
sector, 30–34 vehicles pass a crossing. Kaunas city crossings with three-lanes streets prevailing were chosen for the investigation. Wasted time (extra time to pass a sector) in them is calculated for one maneuver to change a lane under ideal conditions (all the drivers behave especially well-wishingly) till complete restoring of flow, subject to unspoiled traffic flow speed, varies from 6.6 s, with speed 18 km/h, up po 13 s, with speed 72 km/h.
It is necessary to specify traffic circumstances when flows are approaching to a throughput limit of the traffic system sector. When a sector without any holdup is getting longer, an average speed of vehicle increases, but, while moving in a flow, additional factors appear: in long sectors vehicles start re-forming, occupying more convenient positions, drivers go at uneven speed, that is why there in long sectors an average speed has a tendency to decrease.
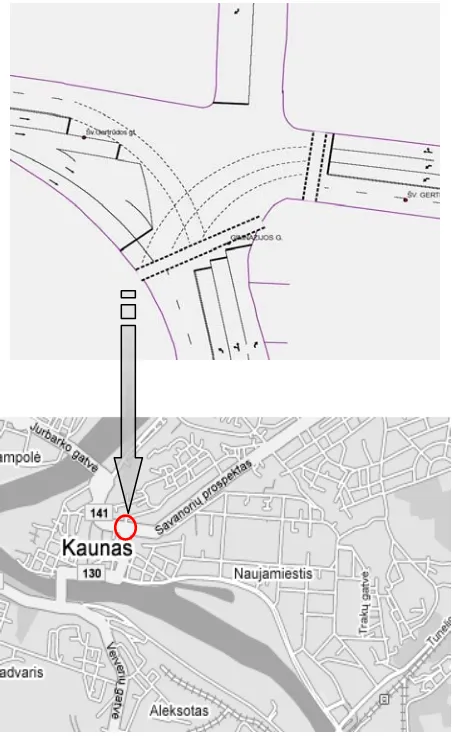
Traffic directions in the crossing: 1– Mackeviciaus st. – Sv. Gertrudos st., 2– Saukliu st. – Sv. Gertrudos st., 3– Birstono st. – Sv. Gertrudos st., 4 – Laisves al. – Sv. Gertrudos st. (Figure 3).
0 200 400 600 800 1000 1200 1400 1600 1800
a b c d e f g h i j k l
1800
q,
veh./h
1200 1000 800
600 400
200 0
6 7 8 9 10 11 12 13 14 15 16 17 18
Day time, h
4 3
2
1
Figure 4. Amount of vehicles in the crossing Sv. Gertrudos st. – Gimnazijos st. during a day
To evaluate probability of congestions, dependencies of traffic intensity during 24 hours are used. In accordance with traffic intensity Karaliaus Mindaugo av.- Birstono st. (Figure 4) 58 vh./min for this crossing is marginal value. Congestions here formed on the average 10.5×4/7=6 h/24 h and during 24 hours 3500×6=20000 vehicles were involved. Large traffic intensity was found out in six (1-3,9,10,18) sectors. On the supposition, that congestions length in separate sectors proportional to flow intensity (an
average factor of six sectors is 0,838), flow unevenness during year (1+0.8+0.7+0.6+0.4)/6=0.583, we get, that during 24 hours 20000×6×0.838×0.583=58632 vh./24h wasted time in congestions. In 2005 in Kaunas city 21533 motorcars there were registered, 19890 of them of M1 class, 69 of M2 class, 90 of M3 class, 882 of N1 class, 206 of N2 class and 396 of N3 class. With an assumption, that cars driving in the city groups composition was similar, and one motorcar wasted in jams on the average 0.25 h, duration of time-waster is obtained.
Calculations were performed for the situation of 2010 year. In order to define congestions loss, the assumption, that traffic flows in Kaunas city increased by 5 percent every year (information of Kaunas city Transport department) was done. According to „Regitra“ registration data, there was no essential change in vehicles composition, but since 2005 every year 6 percent of cars of M1 class used fluid fuel. It is necessary to take into account additionally, that traffic intensity in the main and country roads in Kaunas city has increased by 20-30 percent and approached the flow intensity in city streets. This increases probability of congestion in cities.
Trucks in urban flows made up to 25 percent of a common traffic flow (Birstono st., Karaliaus Mindaugo av., Savanoriu av., Parodos st., Tvirtoves al., Ateities r., T. Masiulio st., Veiverių st., Raudondvario r., Zemaiciu r.).
1 table Expenses of traffic congestions in the crossing of Sv. Gertrudos st. – Gimnazijos st.
Cars vehicles Goods transport Public Coaches Mikrobuses Total
Shuttle Other
Wasted vehicles/day 5090 156 396 46 1068 374 7130
Wasted hours 1542 47.7 120 14.3 324 113 2161
Hour cost, Lt./h 16.73 6.5 40.92 20.5 6.5 6.5
Waste-time cost, Lt. 25798 310 4910 293 2106 734 34151
An average amount of people in a
car 1.5 1.0 40 20 8.0 1.0
Wasted people hours 2313 47.7 4800 286 2592 113 10152
Fuel expenditures per hour, l 4.0 6.5 6.0 6.0 5.0 5.0
Total fuel expenditures, l 6168 310 720 85.8 1620 565 9469
Total fuel expenditures, Lt. 24055 1209 2808 336 6318 2203 36929
Total congestions expenses per day in the crossing, Lt. 71080
Impact of sustainable urban traffic system development on the reduction of congestions expenses
Traffic ecological, economic ones and other problems associated with traffic can be solved just with a complex implementation of the whole group of means and radical changes of traffic facilities, which include correction of passengers’ flows.
There are rather many means to solve traffic congestions issue, but they are of not equally efficient, and their realization calls for huge funds and financing
possibilities (De Palma, 2005, Greenwood, 1996, Liedtke, 2005, Van Woensel, 2009).
Additional traffic lanes
after the crossing in a narrowed down road. That is why it is not quite attractive and impossible to realize everywhere, but very often used as partial measure of reduction of traffic congestions.
Green wave
Another more efficient measure of reduction of traffic congestions in all street crossings and crosswalks is a coordinated traffic regulation by “Green wave”. This measure reduces driving time, probability of traffic accidents, pollution, if transport traffic intensity does not exceed throughput of crossings, regulated by “Green wave” (Daunoras, 2008). Unfortunately, its disadvantage is that it does not increase throughput of crossings, because this requires big initial and operational costs. In road and crossing with „Green wave” left turn would be limited, and varying traffic intensity on the road would remain – streets throughput would not be used to end. In order to achieve traffic by “Green wave” without any troubles, duration of a green signal on traffic lights in all the crossings of this road shall be set in accordance with maximum traffic flow on the road. Therefore this traffic regulation measure is usable only in those roads, throughput of which is three – five times bigger than predictable calculated maximum value of varying traffic intensity period.
Reverse traffic lane, traffic lights of public transport
In streets of intense traffic it is reasonable to arrange of reverse traffic lanes, capable to increase the amount of traffic lanes in required direction during congestion hour, secure undisturbed public traffic between crossings. An additional traffic lane and traffic lights regulating public transport traffic should secure undisturbed public transport traffic in crossings.
Crossings of different levels
The best traffic congestions prevention measure might be roads nods of different levels in streets with intense traffic. They would secure continuous traffic flow in the roads, make possibility to use streets designed throughput completely and 3–5 times increase their actual throughput, considerably decrease probability of traffic accidents, negative impact on peoples health, driving time, pollution due to cars, fuel and time expenditures.
Now in all Lithuania cities there are no high speed public transport routes without intermediate stops and with traffic lights controlled by transmitter mounted in it.
Popularity of such traffic would grow considerably having organized high speed transit of part of public transport traffic, improved driving conditions in it, arranged parking-lots for cars and bicycles at the beginning of route. Some part of passengers of an individual transport would choose high speed public transport, and therefore traffic amount would decrease itself in congestion hours.
If at least one third of passengers using individual transport had ran away with public transport, then vehicles amount of public transport (in examined zone) would have increased just by 12–13 pc., and total amount of transport vehicles would have decreased even at 400 pc., or about 22%. Such vehicles amount in one traffic lane would extend for two and half kilometers, and by removing this amount of cars from congestions the problem would have been solved completely or by great part, at least.
City arterial streets, evaluation of their classes according to traffic intensity conformity with requirements of standard acts have to be listed exactly in the city general plan.
It is necessary to use existing facilities optimally, new and better informational and communication technologies are needed for this, the “advanced and integrated logistics system“ has to be implemented, new ideas, firstly speaking about city traffic, are required. It is important to improve coordination of various transport vehicles and stimulate the choice of more ecological transport vehicles and apply technologies with less amount of exhaust and so on.
Conclusions
In order to make public service more efficient, it is centralized gradually. The distance between citizens and service conveyor is increasing. Plants, as well, follow this tendency – amount of the centers of production, storage and distribution is reduced. Activity is concentrated because of deteriorative accessibility conditions, so partially mobility is forced.
Travels and distances are conditioned by personal, political and business solutions. Cost value shall for some distance is very important. In the future a lot should be changed in this field, because stock cost will be increased (firstly of mined out fuel), exterior expenditures will be internalized, public funds for facilities will decrease and so on. But nevertheless clear political solutions on conclusions what should be done are missing. While carrying resolutions on facilities, it should be necessary to more extensively take into account stable development. It should be necessary to take into account not only the improvements of links, efficiency and less time expenditures, but related ecological and social expenditures, as well.
After the analysis of some transport flows in the city traffic analysis, the investigation of traffic congestions reasons, and conclusions could be done:
there is no methodical facilities development
programme of the city streets;
roads with intense traffic crossings of the city are old-fashioned, and their throughput is by three, four times smaller than streets throughput and traffic flows intensity; there is no high speed public traffic service created in the, what becomes a pretext to use an individual transport,
and this increases traffic intensity and traffic congestions;
there are no continuous traffic roads of radial directions in the city, therefore the largest traffic
congestions are city centre;
there is no reverse lanes in the streets with intense traffic, what could increase roads throughput and no public transport traffic lights before crossings, which would
reduce, at least, congestions of this traffic.
References
A Sustainable Future for Transport - Towards an Integrated, Technology-Led And User-Friendly System. (2009). Publications Office of the European Union Directorate – General For Energy And Transport.
Andersson, P. G., & Fredriksson, L. (2006). Project of Kaunas Public Transport. Trivector Traffic AB.
Armelius, H. (2005). An Integrated Approach to Urban Road Pricing. Journal of Transport Economics and Policy (1), 75-92.
Baltrenas, P., & Kazlauskiene, A. (2009). Sustainable Ecological Development Reducing Negative Effects of Road Maintenance Salts. Technological and Economic Development of Economy (1), 178-188.
Button, K. J., & Hensher, D. A. (2005). Handbook of Transport Strategy, Policy and Institutions. Oxford: Elsevier Ltd. Bickel, P. (2006). Developing Harmonised European Approaches for Transport Costing and Project Assesment
(HEATCO). Deliverable D6: Case Study Results: IER, University of Stuttgart.
Bilbao-Ubillos, J. (2008). The Costs of Urban Congestion: Estimation of Welfare Losses Arising From Congestion on Cross-Town Link Roads. Transportation Research A (42), 1098-1108.
Butkevicius, J., & Lingaitis, L. P. (2005). The Problems of Urban Public Transport and Their Solution Trends.
Proceedings of the 11th International Conference “Urban Transport XI: Urban Transport and the Environment in the
21st Century”. Southampton: WIT Press, 85-93.
Ciegis, R., Ramanauskiene, J., & Martinkus, B. (2009). The Concept of Sustainable Development and its Use for Sustainability Scenarios. Inzinerine Ekonomika-Engineering Economics(2), 28-37.
Ciegis, R., Ramanauskiene, J., & Startiene, G. (2009). Theoretical Reasoning of the Use of Indicators and Indices for Sustainable Development Assessment. Inzinerine Ekonomika-Engineering Economics(3), 33-40.
Cygas, D., Jasiuniene, V., & Bartkevicius, M. (2009). Assesment of Special Plans and Technical Designs with Regard to Traffic Safety. Journal of Civil Engineering and Management 15(4), 411-418.
CORDIS. TransPriceProject. (2000). A European Study of Various Pricing Strategies for Reducing Urban Traffic Congestion and Air Pollution Emissions.
Cruzado, I. (2005). Sustainable Transportation Systems. Proceedings of the 11th International Conference “Urban
Transport XI: Urban Transport and the Environment in the 21st Century”. Southampton: WIT Press, 343-349.
Daunoras, J., Bagdonas, V., & Gargasas, A. (2008). City Transport Monitoring and Routes Optimal Management System.
Transport 23(2), 144-149.
De Palma, A., Lindsey, R., & Proost, S. (2006). Research Challenges in Modelling Urban Road Procing. Transport Policy
(13), 149-161.
De Palma, A., Kilani, M., & Lindsey, R. (2005). Congestion pricing on a road network: a study using the dynamic equilibrium simulator METROPOLIS. Transportation Research A (39), 588-611.
Doll, C. (2002). Unification of Accounts and Marginal Costs for Transport Efficiency (UNITE). Deliverable 7: User Cost and Benefit Cast Studies Leeds: ITS.
Ilgakojyte-Bazariene, J., Marksaitis, D., & Sapragonas, J. (2005). Estimation of the Public Transport System in Kaunas city. Proceedings of the 11th International Conference “Urban Transport XI: Urban Transport and the Environment in
the 21st Century”. Southampton: WIT Press, 105-111.
Jakimavicius, M., & Burinskiene, M. (2009). A Gis and Multi-Criteria-Based Analysis and Ranking of Transportation Zones of Vilnius City. Technological and Economic Development of Economy 15(1), 39-48.
Johansson, O. (1997). Optimal Road Pricing: Simultaneous Treatment of Time Losses, Increased Fuel Consumption, and Emissions. Transportation Research D (2), 77-87.
Goodwin, P. (2003). The Economic Cost of Congestion when Road Capacity is constrained. 6th International Symposium
on Theory and Practice in Transport Economics.
Grant-Muller, S., & Laird, J. (2007). International Literature Review of the Costs of Road Traffic Congestion. Scottish Executive.
Greenwood, I.,D., & Bennett, C. R. (1996). The Effects of Traffic Congestion on Fuel Consumption. Road & Transport Research (2), 18-31.
Guzys, A., Ilgakojyte-Bazariene, J., & Sapragonas, J. (2006). Assessment of the Sustainability of the Street Network in Kaunas City. Proceedings of the 4th International Conference “The Sustainable City IV: Urban Regeneration and
Sustainability”. Southampton: WIT Press, 631-636.
Kazlauskaite, R., & Buciuniene, I. (2008). The Role of Human Resources and Their Management in the Establishment of Sustainable Competitive Advantage. Inzinerine Ekonomika-Engineering Economics(5), 78-84.
Liedtke, G., Shmedding, D., & Marouda, T. (2005). Cost Benefit Analysis for Urban Policy Measures Related to Economic Transport. Proceedings of the 11th International Conference “Urban Transport XI: Urban Transport and
the Environment in the 21st Century”. Southampton: WIT Press, 895-905.
Litman, T. (2001). Generated Traffic: Implications for Transport Planning. ITE Journal (4), 38-47.
Luo, Q., Juan, Z., Sun, B., & Jia, H. (2007). Method Research on Measuring the External Costs of Urban Traffic Congestion. Journal of Transportation Systems Engineering and Information Technology (5), 9-12.
Maibach, M., Schreyer, C., & Sutter, D. (2008). Handbook on Estimation of External Cost in the Transport Sector: Produced within the study Internalization Measures and Policies for All external Cost of Transport (IMPACT). CE, Delft.
Safirova, E., Gillingham, K., & Houde, S. (2007). Measuring Marginal Congestion Costs of Urban Transportation: Do Networks Matter? Transportation Research Part A: Policy and Practice (8), 734-749.
Schneider, F., Nordmann, A., & Hinterberger, F. (2002). Road Traffic Congestion: The Extent of the Problem. World Transport Policy & Practice (1), 34-41.
Startiene, G., & Remeikiene, R. (2009). The Influence of Demographical Factors on the Interaction between Entrepreneurship and Unemployment. Inzinerine Ekonomika-Engineering Economics(4), 60-70.
Stathopoulos, A., & Karlaftis, M. G. (2002). Modeling Duration of Urban Traffic Congestion. Journal of Transport Engineering (6), 587-590.
Van Woensel, T., & Cruz, F. R. B. (2009). A Stochastic Approach to Traffic Congestion Costs. Computers & Operations Research. (6), 1731-1739.
Verhoef, E. T., & Rouwendal, J. (2004). A Behavioural Model of Traffic Congestion: Endogenizing Speed Choice, Traffic Safety and Time Losses. Journal of Urban Economics (3), 408-434.
Wang, D., Feng, T., & Liang, C. (2008). Research on Bicycle Conversion Factors. Transportation Research A (42), 1129-1139.
Zuidgeest, M. H. P., Van., & Maarseveen M. F. A. M. (2006). Sustainable Urban Transport Development: A Modeling Approach. Proceedings of the 4th International Conference “The Sustainable City IV: Urban Regeneration and
Sustainability”. Southampton: WIT Press, 659-668.
Artūras Keršys
Spūsčių sąnaudas mažinanti darni miesto transporto sistemos plėtra
Santrauka
Pagrindinė Lietuvos, kaip ir visų pasaulio didmiesčių, problema – transporto spūstys, susiformuojančios dėl šių priežasčių: neracionali susisiekimo požiūriu miesto ir netinkama transporto sistemos infrastruktūra; netinkamos intensyvaus eismo gatvių sankryžos; nėra greitojo nenutrūkstamo eismo magistralinių gatvių; keleivinio transporto stambiausiuose maršrutuose nėra automobilių stovėjimo aikštelių; neracionaliai išnaudojama intensyvaus eismo gatvių važiuojamoji dalis.
Transporto spūsčių padariniai: didėjanti tarša, blogėjanti žmonių sveikata, ekonominiai nuostoliai. Kiekvienos darbo dienos rytą ir popietę
didmiesčių pagrindiniuose keliuose susidaro transporto spūstys ir jos užtrunka vieną, dvi, o kartais net tris valandas. Priklausomai nuo eismo intensyvumo, sankryžų pralaidumo, eismo reguliavimo suderinamumo, eismo įvykių, kiekvienas automobilis susidarius spūstims, prastovi nuo kelių iki keliasdešimties minučių. Kai kurie vairuotojai, patekęį spūstį, skubėdami sukelia avarines situacijas arba eismo įvykius, o tuo dar labiau sukomplikuoja ir taip sudėtingą situaciją.
Pagrindinis tyrimo uždavinys – transporto priemonės gaišties nustatymas judant srautui, artimam sistemos perpildymui arba spūstyje.
Spūsčių sąnaudoms bei retiems atsitiktiniams nuostoliams įvertinti būtina daug parametrų ir prielaidų, nes šie parametrai įvertinti fizikinėmis išraiškomis. Svarbiausios iš jų:
− kelionės laiko vertė naudojama laiko nuostoliams ir(arba) sumažėjusiam patikimumui bei komfortui išversti į piniginius vienetus;
− greičio-srauto ryšiai, aprašantys papildomos transporto priemonės poveikį transporto sistemai ir kitų vartotojų bei visuomenės išlaidas;
− paklausos kitimas, apibrėžiantis galimą vartotojų reakciją į išorinių spūsčių sąnaudų internalizaciją.
Tyrėjų naudojamos sąnaudų įvertinimo metodikos remiasi kelionės trukmės vertinimu. Tam tikslui atlikta daugybė tyrimų įvairiose Europos šalyse. Darbe naudojamos ekspertų siūlomos apibendrintos išorinių sąnaudų reikšmės viešajam ir krovininiam transportui (skirtumas tarp socialinių reikšmių, atsirandančių dėl transporto infrastruktūros naudojimo, – infrastruktūros nusidėvėjimas, spūstys, aplinkos tarša, eismo įvykiai), ir vidinių sąnaudų, sąlygojamų transporto naudotojo, reikšmės – transporto priemonės nusidėvėjimas, energijos sąnaudos, laiko sąnaudos, transporto mokesčiai ir tarifai.
Visi vertinimo veiksmai labai priklauso nuo transporto sistemos kitimo dinamikos ir turimų duomenų kokybės bei laiko įvertinimo. Sąnaudų įvertinimo metodikoje skiriamos dvi grupės:
− siaurų vietų spūstys, susidarančios kelių sankirtose ir labiausiai paplitusios miestuose bei gyvenvietėse;
− srautų spūstys, rodančios, kad pervežimo galimybės konkrečiose atkarpose viršytos.
Eismo srautų tyrimas yra kompleksinė daugiamatė problema, kurios sprendimo sudėtingumas priklauso nuo transporto tinklo sudėtingumo laipsnio. Spūsčių susidarymo specifikai analizuoti, būtini tyrimai, detaliai aprašantys transporto priemonių ir kelio infrastruktūros bei transporto priemonių tarpusavio sąveiką. Tyrime išskirtos ,,srautų” ir ,,siaurų vietų” spūstys. Pirmojo tipo spūstys susidaro, kai gatvės ruožas ar transporto sistemos dalis perkraunama transportu dėl to, kad neatitinka atvykstančių ir išvykstančių transporto priemonių srautai. Atvykstančių transporto priemonių srautą apibrėžia prieš tai esančio ruožo pralaidumas, išvykstančių – paties ruožo ir už jo esančio ruožo pralaidumai.
priklausomybės. Sprendžiant pagal eismo intensyvumą Karaliaus Mindaugo pr. – Birštono g. 58 aut./min. šiai sankryžai yra ribinis dydis. Spūstys čia susidarydavo vidutiniškai 10.5×4/7=6 val./parai ir buvo susijusios su per parą paliesdavo 3500×6=20000 transporto priemonių.
Transporto eismo ir su juo susijusias ekologines, ekonomines problemas įmanoma išspręsti tik kompleksiškai įgyvendinant visą aibę priemonių ir radikaliai keičiant eismo infrastruktūrą, kuri apima keleivių srautų koregavimą.
Yra gana daug priemonių transporto spūsčių problemai išspręsti, tačiau jos nevienodai veiksmingos, o jas įgyvendinti trukdo didžiulės lėšos ir finansavimo galimybės.
Viena iš priemonių, kurią naudojant būtų galima sumažinti prastovas, – prieš sankryžas ir sankryžose nutiesti tiek papildomų eismo juostų ir tokio ilgio, kurias užpildytų keliu važiuojantis transportas per šviesoforo darbo ciklo laiką. Taip būtų galima išvengti spūsčių, padidintų sankryžų pralaidumą. Tačiau šiai priemonei įgyvendinti reikia didelių papildomų plotų prieš sankryžas, pačiose sankryžose ir dar didesnių už sankryžų. Ši priemonė nepanaikina pulsuojančio eismo ir gali padidinti eismo įvykių pavojų už sankryžos susiaurėjus keliui. Dėl to ji nėra itin patraukli ir ne visur įmanoma įgyvendinti, tačiau labai dažnai naudojama kaip dalinė transporto spūsčių mažinimo priemonė.
Kita veiksmingesnė spūsčių sumažinimo priemonė visose gatvės sankryžose ir pėsčiųjų perėjose – koordinuotas eismo reguliavimas „žaliąja banga”. Ši priemonė sumažina važiavimo trukmę, eismo įvykių tikimybę, taršą, jeigu transporto eismo intensyvumas neviršija sankryžų, reguliuojamų „žaliąja banga” pralaidumo. Deja, šios priemonės trūkumai yra tai, kad ji nedidina sankryžų palaidumo, nes tam reikalingos didelės pradinės ir eksploatacinės investicijos. „žaliosios bangos“ kelyje ir sankryžose būtų ribojamas kairysis posūkis, o kelyje išliktų kintantis eismo intensyvumas – nebūtų iki galo išnaudojamas gatvių pralaidumas. Kad eismas „žaliąja banga“ vyktų be sutrikimų, visose to kelio sankryžose šviesoforų žalio signalo trukmė turi būti nustatyta pagal didžiausią transporto srautą kelyje. Todėl ši eismo reguliavimo priemonė tinkama naudoti tik tuose keliuose, kurių pralaidumas yra tris – penkis kartus didesnis už prognozuojamo kintančio eismo intensyvumo periodo skaičiuojamąją didžiausią reikšmę.
Intensyvaus eismo gatvėse racionalu įrengti reversinio eismo juostas, dėl kurių galėtų padaugėti kurios galėtų padidinti eismo juostų skaičius reikiama kryptimi spūsties valandą, taip pat galėtų būti užtikrinamos viešojo transporto netrukdomas eismas tarp sankryžų. Sankryžose netrukdomą viešojo transporto eismą turėtų užtikrinti papildoma eismo juosta ir viešojo transporto eismą reguliuojantis šviesoforas.
Bene geriausia transporto spūsčių prevencijos priemonė – skirtingų lygių kelių mazgai intensyvaus eismo gatvėse. Jie užtikrintų nepertraukiamą transporto srautą keliuose, sudarytų galimybę iki galo išnaudoti gatvių projektinį pralaidumą ir 3–5 kartus padidinti faktinį jų pralaidumą, gerokai sumažintų eismo įvykių tikimybę, neigiamą poveikį žmonių sveikatai, važiavimo trukmę, automobilių taršą, degalų ir laiko sąnaudas.
Šiuo metu visuose Lietuvos didmiesčiuose nėra nei vieno greitojo viešojo transporto maršruto, kuriame nebūtų tarpinių stotelių, o sankryžų
šviesoforai būtų valdomi jame sumontuotu siųstuvu. Organizavus greitąjį tranzitinį dalies viešojo transporto eismą, pagerinus jame važiavimo sąlygas, maršruto pradžioje įrengus lengvųjų automobilių ir dviračių stovėjimo aikšteles, tokio transporto populiarumas gerokai padidėtų. Nemaža dalis individualaus transporto keleivių pasirinktų greitąjį viešąjį transportą, o dėl to savaime sumažėtų transporto kiekis spūsties valandomis.
Jeigu bent trečdalį individualiu transportu besinaudojančių keleivių pavyktų suvilioti naudotis viešuoju transportu, tai viešojo transporto priemonių skaičius (nagrinėjamoje zonoje) padaugėtų tik 12–13 vnt., o bendrai transporto priemonių skaičius sumažėtų net apie 400 vnt., arba apie 22 %. Toks automobilių skaičius vienoje eismo juostoje nusidriektų per pustrečio kilometro, o pašalinus tiek automobilių iš spūsties problema būtų išspręsta visiškai arba bent iš dalies.
Miesto bendrajame plane turi būti tiksliai įvardytos miesto arterinės gatvės, jų kategorijos pagal eismo intensyvumą atitikties norminių aktų reikalavimams vertinimas.
Būtina optimaliai naudoti esamą infrastruktūrą. Tam reikalingos naujos ir geresnės informacinės ir ryšių technologijos, turi būti įdiegta „pažangi ir integruota logistikos sistema“, reikalingos naujos idėjos, visų pirma kalbant apie miesto transportą, reikia gerinti įvairių transporto priemonių derinimą ir skatinti rinktis ekologiškesnes transporto priemones bei taikyti mažesnį išlakų kiekį išskiriančias technologijas ir kt.
Raktažodžiai:miesto transportas, darni plėtra, eismo spūstys, išorės sąnaudos.