ISSN 1392-2785 ENGINEERING ECONOMICS. 2006. No 5 (50)
THEECONOMICCONDITIONSOFENTERPRISEFUNCTIONING
The Challenges of GHG Emission Trading for Lithuania
Remigijus
Č
iegis, Dalia Štreimikien
ė
VU Kauno humanitarinis fakultetas Muitinės g. 8, LT-44280,Kaunas
The article deals with the issues related to the im-plementation of EU emission trading scheme in Lithua-nia. The main objectives of the article are to analyse the main features and requirements of EU emission trading scheme and to assess the impact of GHG emission trad-ing on economy through the energy price increase caused by carbon restrictions on energy sector.
The aim of EU Emission trading scheme is to help member states to fulfil their Kyoto commitments at lowest costs. In Lithuania GHG emissions in 2004 amounted to 20.2 mill. t and were by 2.5 time lower Lithuania’s Kyoto commitments. The total number of allowances allocated for Lithuanian emission trading sector in both emission-trading periods was not imposed by Kyoto commitments. The main constraint for 2005-2007 is laid in Annex II criteria – not to allocate more allowances than it will be needed. The quantity of allowances member state may issue was governed by 11 common allocation criteria. While the directive does not explicitly prescribe a given number of allowances, each member state must respect the criteria, which mean that in practice their leeway is limited. The general concern of EC is that if too many allowances were issued there would be no scarcity, and no market develops.
Analysis of new Lithuanian National Allocation Plan for 2008-2012 indicated that with the growth of Lithua-nian economy CO2 emissions per GDP seeking to main-tain the average annual GHG emission level up to 2012 should be reduced by 33%. This is important challenge for Lithuanian enterprises taking into account-anticipated closure of unit 2 at Ignalina NPPP. It is fore-seen that with the reduced supply of GHG emission al-lowances in 2008-2012 because of restrictions imposed in new NAPs to GHG emission trading sectors and the fast economic growth in new member states will drive the price of allowance up to 50-60 EUR/t. This will have im-pact on increased investments in use of renewable energy sources especially of biomass in energy sector and in increase of energy efficiency.
Therefore it is very important to ensure the invest-ments of energy and industrial enterprises in moderniza-tion of energy sector. Such high prices of allowances will create the situation when previously not competitive in the energy market expensive advanced technologies be-come efficient having short payback period. However these trends will cause increase in energy prices to con-sumers. One of the possibilities to reduce the burden of GHG emission trading on economy and to mitigate GHG allowances and energy price increase is application of Flexible Kyoto mechanism which are cheaper options to
acquire GHG emission credits and to cover increased GHG emissions in the country.
In general forecast for the second trading periods is not favourable for Lithuanian economic development as carbon restriction on Lithuanian economy reduce com-petitiveness of Lithuania economy (which is low GHG emission economy comparing with old EU member states) in EU market will lead to the energy price in-crease. The additional taxes on energy and other goods may have negative impact on Lithuanian economy be-cause introduction of new environmental taxes should be implemented through the green budget reform which im-plies the rise of environmental taxes by reduction of the income, social security and value-added or profit taxes and maintaining budget revenues constant.
Positive impact of The EU emission trading for Lithuania is the promotion of use of bio fuels, CHP and other advanced energy production and consumption technologies having external benefits on society in terms of increased knowledge, skills, employment etc.
Keywords: climate change mitigation, GHG emission
trading, and flexible Kyoto mechanisms.
Introduction
The global framework for climate protection is the Framework Convention on Climate Change by the United Nations (UNFCCC) agreed in Rio in July1992. The Con-vention sets the general goal of preventing the harmful impacts of climate change, but does not fix any quantita-tive limits for emission. These were agreed in Kyoto in
December 1997, in the 3rd Conference of Parties (COP3).
The Kyoto Protocol (KP) sets, inter alia, the quantitative
emission limits for industrialised countries (so called An-nex I countries) Altogether the targets set in Kyoto would have mean 5.2% reduction in Annex I countries between 1990 and 5 years period 2008-12.
The EU has passed the Emission Trading Directive and the Linking Directive, which directly governs the
CO2 emission from the energy sector within the
commu-nity, but there are also a number of other directives and
policies that have an impact on CO2 emissions. The most
important of these directives are the directives on renew-ables and CHP, whose aim is to promote energy produc-tion with less emission than the existing. Other important initiatives are the directive on Large Combustion Plants that regulates the emission of other pollutants and which may lead to fuel switch which will also lead to lower
emissions of CO2. Also the provision in the Electricity
generators may have an impact on the emission of CO2.
The directive states that authorisation for new capacity must be given on the basis of objective, non-discriminating and known criteria, these criteria may in-clude emission levels. The new draft directive on energy end-use efficiency and energy services demands that tar-gets are set for improving the energy efficiency and that all consumers have access to energy services and infor-mation about saving possibilities. Also this directive
when passed can have an impact on the CO2 emission of
the energy sector (Vesterdal, Svedsen, 2004).
Lithuania has been participating in EU GHG emis-sion trading scheme since 2005. The results of the first trading period 2005-2007 indicated that Lithuanian com-panies have received almost twice as much as needed GHG emission allowances to cover their actual GHG emissions. The main problem is that next trading period can cause significant challenges for Lithuanian compa-nies participating in EU ETS especially heavy burden can be placed on energy sector therefore stipulating signifi-cant energy price increase in Lithuania and having nega-tive impact on the growth of Lithuanian economy. The application of flexible market based instruments in Lithuania is very new thing therefore there are just few articles dealing with this problem in Lithuania (Stre-imikiene, 2004; Stre(Stre-imikiene, Bubniene, 2004; Ciegis, Bubniene, 2006).
The aim of the article is to analyse the main chal-lenges and implications of EU GHG emission trading scheme for Lithuania. The main tasks of the article are:
• to analyse global, EU and national GHG emission
mitigation tools;
• to analyse the implications of EU GHG emission
trading scheme for member states in 2005-2007 and 2008-2012
• to analyze Lithuanian National allocation plans for
two trading periods
• to define the main challenges and implications of
GHG emission trading to Lithuania
• to make conclusions and recommendations based
on the main findings of analyses performed.
Global, EU and national GHG mitigation tools
The Kyoto Protocol (KP) sets, inter alia, the
quanti-tative emission limits for industrialised countries (so called Annex I countries). Altogether the targets set in Kyoto would have mean 5.2% reduction in Annex I coun-tries between 1990 and 5 years period 2008-12. Kyoto protocol allows trading of emission rights and reductions via so called Kyoto mechanisms. These are:
• trading between governments with their emission
rights, so called Assigned Amount Units (AAUs),
• trading between governments and/or companies
with project based emission reductions,
− Joint Implementation (JI) between Annex I
countries, project hosts thought mainly be lo-cated in Economies In Transition (EITs), the trading unit called Emission Reduction Units (ERUs) and
− Clean Development Mechanisms (CDM)
be-tween Annex I and non-Annex I (developing) countries, the trading unit called Certified Emission Reductions (CERs).
In the EU different climate policies have been set or are under consideration in order to reach the EU-15 target -8%. These are collected in European Climate Change Programme (ECCP). Emissions trading (ET) according to the ET Directive proposed in 2001 and approved in 2003 will represent nearly half of the emission reductions. The other policies concern e.g. increased use of renewable energy sources, energy efficiency at the end use and combined heat and power (CHP) production (Fischer 2005).
The Kyoto process and the Emissions Trading Scheme (ETS) of the EU have been connected with each other via so called Link Directive, which defines how the flexibility mechanisms of Kyoto Protocol can be used in the ETS. National climate policies in the EU members states both implement the EU policies and define nations’ own national measures, in order to reach the burden shar-ing targets of different EU-15 countries (see Table 1) agreed in the EU after Kyoto, in June 1998.
Table 1 Burden sharing agreement
Member states Change in emissions from 1990 to 2008-12 [%]
Portugal 27 Greece 25 Spain 15 Ireland 13 Sweden 4 France 0 Finland 0 Netherlands -6 Italy -6.5 Belgium -7.5 UK -12.5 Austria -13 Denmark -21 Germany -21 Luxemburg -28
An important challenge for the future is that the vari-ety of climate or climate-related instruments do or may interfere with each other, there may be over-lapping of instruments, or there may be even contradictions so that one instrument gives incentive to a certain direction whereas the other one to an opposite direction (Sonne-born, 2005).
supposed to cover about 46% of the EU-15’s total CO2 emissions in 2010. The Directive is a key element of the Community’s climate change policy and its objective is to promote reductions of greenhouse gas emissions in a cost-effective and economically efficient manner. It is therefore important to ensure that the emissions trading scheme has a positive environmental outcome. The na-tional allocation plans are the means to achieve this goal. The Directive 2003/87/EC defines the participants, gasses and sources of GHG emissions that are covered by the scheme. During the first period only CO2 emissions will be covered from electricity and heat production, fuel combustion installations over 20 MW, and major indus-trial sectors (iron and steel, oil reefing, glass and ceram-ics, cement, paper and pulp production. All above-mentioned emitters account for 46% of total European CO2 emissions. The other industry sectors and gases will be covered by the scheme during the following trading periods. Directive requires every emitting installation to have a permit to emit CO2 from January 1 2005. The EU trading scheme foresees emission caps for all power and energy intensive industry sectors within EU member states. Allowances will be allocated for every individual installations based on allocation formulas. Companies
will be free to choose either to use the compliance or trade. The emissions from each installation will be re-quired to match the allowances allocated. CO2 allow-ances have a value mainly due to the very simple fact that every installation where GHG emissions exceed allow-ances will need to invest in measures reducing the emis-sions or to buy allowances on the market. Installations, which reduced emissions below their allowances, will have three possibilities: to increase emissions, to sell al-lowances to another installations across EU or to bank saved allowances for next year. There are no limitations of CO2 emissions for individual installations only instal-lation has to have allowances. If instalinstal-lation does not have enough allowances it can buy them from another market participant that has a surplus of allowances be-cause has already reduced it’s emissions (Streimikiene, Bubniene, 2004).
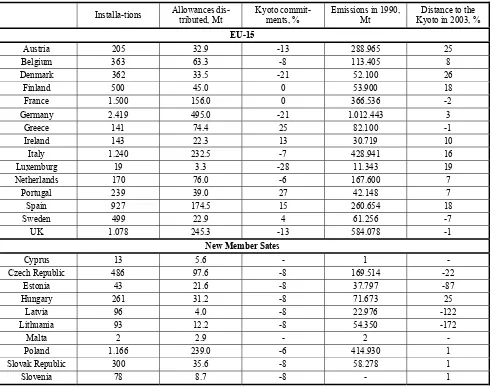
The penalty of 40 EUR/t CO2 is foreseen for the first trading period and 100 EUR/tCO2 is foreseen for the sec-ond trading period. Member States can introduce addi-tional penalties in their naaddi-tional legislation. A total 11428 installations have been reported by member states and 6572,4 Mt of CO2 emission permits were distributed among member states (Table 2.)
Table 2 Installations covered by EU ETS, CO2 emissions allowances distributed in Member States,
base year GHG emissions and distance to the Kyoto in 2003
Installa-tions Allowances dis-tributed, Mt Kyoto commit-ments, % Emissions in 1990, Mt Kyoto in 2003, %Distance to the
EU-15
Austria 205 32.9 -13 288.965 25
Belgium 363 63.3 -8 113.405 8
Denmark 362 33.5 -21 52.100 26
Finland 500 45.0 0 53.900 18
France 1.500 156.0 0 366.536 -2
Germany 2.419 495.0 -21 1.012.443 3
Greece 141 74.4 25 82.100 -1 Ireland 143 22.3 13 30.719 10
Italy 1.240 232.5 -7 428.941 16
Luxemburg 19 3.3 -28 11.343 19
Netherlands 170 76.0 -6 167.600 7
Portugal 239 39.0 27 42.148 7
Spain 927 174.5 15 260.654 18
Sweden 499 22.9 4 61.256 -7
UK 1.078 245.3 -13 584.078 -1 New Member Sates
Cyprus 13 5.6 - 1 -
Czech Republic 486 97.6 -8 169.514 -22
Estonia 43 21.6 -8 37.797 -87
Hungary 261 31.2 -8 71.673 25
Latvia 96 4.0 -8 22.976 -122
Lithuania 93 12.2 -8 54.350 -172
Malta 2 2.9 - 2 -
Poland 1.166 239.0 -6 414.930 1
Slovak Republic 300 35.6 -8 58.278 1
As one can see from Table 2 the GHG emissions of old member states in 2003 exceeded the requirements of Kyoto protocol by 272 Mt of CO2 equivalent. Even tak-ing into account the planned to acquire GHG emission credits form application of Kyoto flexible mechanisms old member states need to decrease GHG emissions by 131 Mt. Therefore for old EU member states GHG emis-sion trading can be an attractive opportunity to reduce GHG emissions comparing with more expensive meas-ures available for non trading sectors (transport, agricul-ture, households etc.). However new EU member states have surplus of GHG emission credits by 282 Mt and are potential CO2 emission allowance sellers in the first trad-ing period.
Due to the surplus of the allowances in the EU New Member States it is likely that there will be a surplus of allowances in the EU ETS. This precondition implies the low price of allowances and the little liquidity of the market in the end of trading period especially. The sur-plus of the allowances and windfall profit of the electric-ity producers decrease effectiveness of the system. Al-though following the theory, the price of the allowance shall be equal to the marginal emission reduction costs, in practice the marginal costs will be lower than the price of the allowances due to the surplus of the allowances.
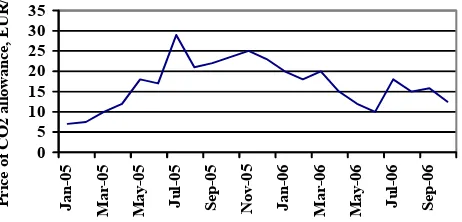
The environmental impact of the EU ETS in the trad-ing period 2005-07 will be minor (Woerdman, 2000). The EU Member States, potential buyers, will use the project based Kyoto flexible mechanisms to meet the national greenhouse gas reduction targets. The inclusion of the external credits generated by the Joint Implementation and Clean Development Mechanisms will potential re-duce the price of the allowances in the EU ETS market. The dynamics of CO2 emission allowance price is pre-sented in Figure (Point Carbon, TemaNord, 2004).
0 5 10 15 20 25 30 35
Jan
-05
Ma
r-05
Ma
y-05
Ju
l-05
Se
p-05
No
v-05
Jan
-06
Ma
r-06
Ma
y-06
Ju
l-06
Se
p-06
P
ri
ce
o
f CO
2 a
ll
owa
n
ce
, E
U
R/
t
Figure. Forward prices of EU allowances
The peak of CO2 allowance price was in summer of 2005. This was related to the fact that in the market the price of the good in a short time period is driven by sup-ply and there were not enough allowances in the market as member states were not well prepared for trading therefore the price of GHG emission allowances in-creased up to 30 EUR/t however companies started to trade and the supply of allowances increased in the mar-ket. This had impact on GHG emission price decrease up to 11 EUR/t in the summer of 2006 or in one year. In the forthcoming period the price of allowance should go down as analysis of first trading period indicated the sur-plus of GHG emission allowances allocated almost in all
member states, including Lithuania.
The use of Flexible Kyoto mechanisms had also im-pact on GHG emission allowance price decrease in EU ETS (Andersen, 2000). Emission reductions from joint implementation (JI) or clean development mechanism (CDM) projects can be used by the companies to fulfil their emission reduction targets. The details are regulated in a Linking Directive (2004/101/EC), which entered into force in November 2004. Starting from 2005 firms have direct access through CDM to credits from countries without targets; from 2008 JI credits will be available for countries with targets. The cost of the permits will be accounted for in the price of the products emitters sell: products with high carbon content will become more ex-pensive and buyers will respond by consuming less or switching to an alternative with less price rise (which presumably is also less carbon intensive). Hence, this approach only indirectly gives some incentive to energy savings as a means to consume less carbon intensive product without loosing the desired service level (An-drews, 2001). However, price differences between prod-uct alternatives are not only caused by carbon intensity. While it can be argued that the carbon content will be internalized in the electricity price and this will create a sufficient price signal to be passed through to consumers, even this short-term impact of the EU ETS on electricity prices will depend on a plethora of factors (Bertoldi at al, 2005). The method of allowance allocation, the allowance price, the extent to which additional costs are passed on to consumers rather than to e.g. shareholders, the carbon intensity of the electricity generation system as a whole, and the elasticity’s that operate on behavior (in relation to price, substitution, and income), are among these factors. In addition the demand side of the energy sector is rarely as responsive to price incentives as economic theory pre-dicts. These would probably make negligible the effect on energy efficiency of a possible price increase driven by the EU ETS (Langniss, Praetorius, 2003).
EU GHG emission trading in 2008-2012 The first allocation process, for the 2005-2007 pe-riod, yielded many important lessons which have been reflected in the Commission’s December 2005 guidance for the second trading period. Important from the first trading period is that the NAPs for the first trading period were too complex and not sufficiently transparent. Com-plexity makes it hard for companies and other market actors to understand a NAP and thereby creates uncer-tainty. Also, a lack of transparency makes it very difficult for stakeholders to understand and form a view on plans. To ensure greater transparency, the Commission has drawn up a number of standardised tables to summarise key information contained in NAPs.
the end of 2006, well before the second trading period starts. The second trading period under the ETS coincides with the five-year period – known as the ‘first commit-ment period’ – in which the EU and member states must meet their targets for limiting or reducing emissions of greenhouse gases under the Kyoto Protocol on climate change. For many Member States the NAPs for 2008-2012 are likely to play an important part in ensuring their targets are achieved. The Commission will check NAPs for their conformity with a set of 12 criteria laid down in the directive that establishes the ETS. For the first ETS trading period (2005-2007), only 11 of the criteria were relevant. The application of the criteria and lessons learnt from the first trading period are further explained in two guidance communications from the Commission. The first of these was issued in January 2004 and the second, focusing on NAPs for the second trading period, in late December 2005.
Under the first of the 12 criteria, it will be necessary to assess whether a Member State’s NAP, together with other policies and measures, will guarantee the achieve-ment of its Kyoto target. Member States relying on gov-ernment purchases of emission credits obtained through the Protocol’s mechanisms to promote emission-savings projects in third countries – known as Joint Implementa-tion (JI) and the Clean Development Mechanism (CDM) – will need to substantiate their intentions more thor-oughly than for the first trading period and demonstrate progress in making these purchases. Similarly, Member States relying on additional policies and measures will need to substantiate the effects better and demonstrate progress in implementing or adopting them. There are also criteria that seek to ensure non-discrimination be-tween companies and bebe-tween the different sectors as well as compliance with the EU's competition and state aid rules. Other criteria relate to provisions in the plan for new entrants, the accommodation of early reduction ef-forts and clean technology (Streimikiene at al, 2006).
The final criterion, which was not in place for the 2005-2007 trading period, requires NAPs to specify the maximum amount of JI and CDM credits that may be used for compliance purposes by installations under the ETS. Once the Commission has approved a plan, or the amendments requested have been undertaken, the alloca-tion process is completed with a final allocaalloca-tion decision at national level and the allocation of allowances in the Member State’s electronic registry. For the second trad-ing period the deadline for the final allocation decision is 31 December 2006.
If a member state were over-generous in issuing al-lowances, its NAP would fail to comply with these crite-ria. The Commission’s December 2005 guidance sets out a methodology for calculating a benchmark for the caps by Member State for the 2008-2012 trading period. It is based on analysis of the combined effect of annual eco-nomic growth and carbon intensity (i.e. the quantity of greenhouse gases needed to produce one unit of output) over time. According to this methodology, caps should not increase in any Member State from the first to the second trading period. Member States that are well on track to meeting their Kyoto targets may maintain their first phase cap. Member States, which are not sufficiently
on track, must reduce the cap from the first to the second trading period. Overall this methodology would lower the annual EU-wide ETS cap in the second phase by some 6% compared with the first phase cap. This reduction would ensure that the EU and all Member States achieve their agreed Kyoto targets.
An amendment to the ETS directive, known as the Linking Directive, allows companies in the second trad-ing period to use credits from JI and the CDM, up to a certain proportion of their allocation of emission allow-ances, to cover their emissions. The degree of use must be supplemental to reductions achieved through domestic policy action, and needs to be fixed by each Member State in its NAP by specifying the maximum amount of such credits. Member States are free to choose whether to apply the limit individually in respect of each installation, or collectively to all installations. For greater flexibility, the Commission is recommending that Member States apply the limit for the entire trading period and collec-tively to all installations. The limit on the use of credits does not imply that a company cannot generate and sell more of them. In fact, even if the limit should be reached in a Member State, other companies in other Member States could use the credits. And even if the limit were reached in all Member States, a company could sell cred-its to governments (both in Europe and beyond) or to other companies (both in Europe and beyond), or could keep them for the next ETS trading period (Streimikiene, Mikalauskiene, 2004a).
The main problem with NAPS in second trading pe-riod is delay in submission. In the beginning of October 2006 just 11 national allocation plans for 2008-2012 pe-riod were submitted to EU instead of 27. The main fea-tures of new National allocation plans:
• Delays in submission
• Industrial processes receiving 100% of their GHG
emission needs for the second trading period
• Energy sector allocation are cut down and the
windfall profit mentioned as the main reason
• High differences in allocations for new entrance
between countries.
It is expected that market price of allowance in the second period will increase and reach 60EUR/t.
A significant share of additional EAUs could come from CDM projects, but most of the reduction would still have to be taken within ETS. Based on how the market balance can be judged from what is now known an allow-ance price in the 5-15 €/t range seems reasonable. The NAPs as they are materializing have increased the possi-bility of relatively low prices. Short-term variations in weather and activity are likely to have an impact of prices, possibly leading to a relatively volatile market.
GHG emission trading in Lithuania
Lithuania has adopted new strategy for climate change mitigation recently (Ministry of Environment, 2006a). There are few market based GHG mitigation tools applied in Lithuanian: GHG emission trading scheme due to 1 January 2005 and flexible Kyoto mecha-nisms (Streimikiene, Mikalauskiene, 2004b).
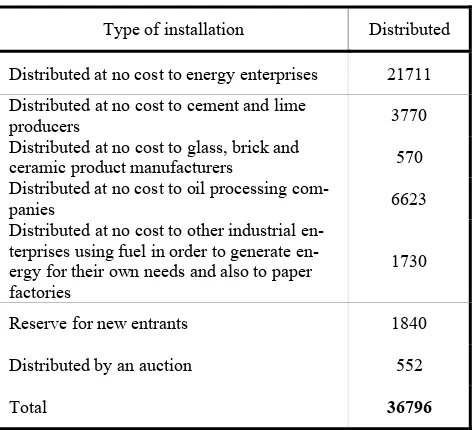
pre-pared in Lithuania sets the total amount allowances for Lithuania – 36796 MtCO2 equivalent. It is foreseen to distribute allowances free of charge to the enterprises in the following parts: 40% in 2005, 30% in 2006 and 30% in 2007. For energy enterprises in 2005-2007 21.711 MtCO2e will be allocated (Table 3).
Table 3 Number of allowances to be allocated in 2005-2007, Mt
(Ministry of Environment, 2004)
Type of installation Distributed
Distributed at no cost to energy enterprises 21711 Distributed at no cost to cement and lime
producers 3770
Distributed at no cost to glass, brick and
ceramic product manufacturers 570
Distributed at no cost to oil processing
com-panies 6623
Distributed at no cost to other industrial terprises using fuel in order to generate en-ergy for their own needs and also to paper factories
1730
Reserve for new entrants 1840
Distributed by an auction 552
Total 36796
The quantity of allowances issued to electric and thermal power generating installations, the main task of which is to supply power to the power and thermal grid and/or sell electric power to other legal or natural persons will be calculated by multiplying the amount of energy planned to supply from comparative pollution unit per one unit of energy. The comparative pollution benchmark depends on the type of an enterprise:
• The electric power planned to supply from
con-densed power stations: 0.576 t/MWh
• The electric power planned to supply from
co-generation power stations with no possibility to burn natural gases: 0.779 t/MWh
• The electric power planned to supply from other
existing co-generation power stations: 0.421 t/MWh
• The heat planned to supply when there are no
pos-sibilities to burn natural gases: 0.2885 t/MWh
• The heat planned to supply when there are
possi-bilities to burn natural gases: 0.250 MWh
The allowances for other industrial installations were based on historical GHG emissions in 1998-2002. For new installations in energy sector 2500 t of allowances were allocated for 1 MW installed electricity capacity and 600 t of GHG emission allowances for 1 MW of installed thermal capacity.
• In industrial enterprises 14.03 Mt
• In energy enterprises 22.76 Mt.
In total 36.80 Mt (approx. 12.27 per year) or 44.9 % of the total GHG in this period.
In 1998 CO2 emissions from enterprises participating
in the emission trading system accounted for:
• In industrial enterprises 3.312 Mt
• In energy enterprises 5.189 Mt.
In total 8.50 Mt (however the pollution of then oper-ating installations was not estimated). It is accounted for 35.7 % of the total greenhouse gas emissions in Lithua-nia. The foreseen increase of their share is related first of all with the closure of the first unit of Ignalina NPP and with higher production output of fossil fuel-fired power stations covered by the emission-trading scheme. 98.5% of allowances will be allocated free and 1.5% of allow-ances will be allocated by an auction. Unused allowallow-ances will be annulled.
The results of first trading year in Lithuania indicated that enterprises participating in GHG emission trading scheme has benefited (Streimikiene, 2004). In 2005 13.8Mt of CO2 allowances were allocated for Lithuanian enterprises. At the same time GHG emissions from these enterprises in 2005 amounted to 6.6 Mt of CO2 equiva-lent. Most of the surplus allowances were sold to other enterprises in EU. Mostly benefited enterprises, which have sold allowances in the summer of 2005 than the price of allowance reached 30 EUR/t. This situation is caused by the fact that the closure of the first unit at Ig-nalina NPP in 2005 had no significant impact on GHG emission increase as was predicted in NAP because sec-ond unit at Ignalina NPPP was operating very efficiently in 2005 and the time spent for regular maintenance was very short. Another factor was the increase in natural gas prices stipulated the increase of energy production costs and therefore the increase of electricity demand were covered not by increased energy production in Lithuanian power plants but by electricity import from Russia and Estonia. Lithuanian power plant covered its constant costs by selling surplus allowances on high prices. An-other important reason why Lithuanian enterprises in en-ergy sector didn‘t use allowances allocated for them was investments in biomass combustion technologies and measures to increase energy production, transmission and use efficiency.
predict that in 2008 just enterprises investing in use of renewable energy sources or increase in energy use of production efficiency will be able to sell the surplus al-lowances. The shortage of allowances will be felt in en-terprises, which will increase production comparing with 2002-2005 year period and using fossil fuel.
The national allowance allocation plan (NAP) for 2008-2012 prepared in Lithuanian in 2006 is one of the main elements of allowance trading system. The plan termines the overall allowance quota for the country, de-fines the main principles of the distribution of allowances and, in compliance with those principles, the allowances are allocated to the companies. Operators, administrating the work of devices included into the allowance trading, have been questioned in order to evaluate the pollution, reflecting the business as usual scenario. According to this scenario all the requirements of the Lithuanian legal acts and EU directives would be implemented, practice execu-tives would carry out the most economically acceptable practice (choosing the fuel used, investing and expanding the work), without evaluation of the influence on practice of marketing of circulating pollution licenses. All the de-vices have been divided into separate sectors of practice. Thus, evaluating the pollution of the devices, reflecting the business as usual scenario, the “bottom to top” method was used. Allocating separate sectors with the allowances, ad-ditional CO2 pollution reduction possibilities in separate sectors have been evaluated, choosing a more expensive, but less polluting kind of fuel, investing into a more effec-tive energy generation, transmission and transportation. There has also been foreseen that device practice execu-tives will be able to carry out their commitments to reduce pollution by investing into flexible mechanisms projected in the Kyoto protocol – joint implementation projects and clean development mechanisms implemented in other countries.
Allowances for separate sectors and installations are allocated according to the pollution in the period of 2002-2005. However, with a view to reduce the discrimination of operators, who NAP – version 30 06 2006 invested into the reduction of pollution before the end of 2005, it is intended to consider the operators’ early actions to re-duce pollution and to provide them with a bigger number of allowances. The pollution in the new installations has been evaluated doubly. The present installation operators have provided a part of the information. Also, using the “top to bottom” method, pollution in the forthcoming installations has been evaluated. It has also been evalu-ated, that in the period of 2008-2012 joint implementa-tion projects will be implemented in Lithuania. They will reduce the pollution in the installations included into the allowance system. Aiming to avoid double counting, an individual reserve for joint implementation projects has been separated. Realizing joint implementation projects in Lithuania, which indirectly reduce pollution in the in-stallations included into the allowance trading system, a certain number o allowances would be eliminated from this fund. In the second period, the allowances provided for the sectors are allocated among installations, belong-ing to the sectors, accordbelong-ing to certified, equally applied rules.
Planning a common number of allowances for all
in-stallations, EU commission additional recommendations for allowance allocation plans in the EU marketing period of emissions marketing scheme from 2008 to 2012 have been taken into consideration. It is recommended that the annual number of allocated allowances should not over-top the number of allowances allocated in the period of 2005-2007, and the influence of economy growth should be compensated by the reduction of pollution intensity.
However the oneness of Lithuanian economy is re-lated to Ignalina Nuclear Power Plant complete closure at the end of 2009. The closure of Ignalina NPP will influ-ence a much bigger load of fossil fuel fired power plants operating in Lithuania. This increase in pollution cannot be compensated by the reduction of pollution intensity.
Regarding the experience of allowance trading sys-tem implementation in the period of 2005 –2007, it can be claimed that with essential changes in the energetic economy-taking place, allowance allocation, according to the energy generation prognosis in separate installations, is very subjective. Besides, operators’ decision to gener-ate the power or not is strongly influenced by the price of allowances. With the increase of allowance price in 2005, many fossil fuels fired power plants found it more useful to refuse power generation and to sell the surplus of al-lowances. In the future, the amount of generated power will influence both the price of fossil fuel and the price of power imported from Russia.
Therefore in compliance with the experience of al-lowance trading system implementation in the period of 2005-2007, it is offered to place additional allowances, allocated by evaluating the amount of additionally gener-ated power in fossil fuel fired power plants, in the “re-serve related to the closure of Ignalina NPP” due to the prospective closure of Ignalina NPP. The allowances from this reserve would be allocated for the installations which de-facto generates considerably larger amounts of power. Thus the allowances in the “reserve related to the closure of Ignalina NPP” would be allocated using the ex-post principle. Other allowances will be allocated us-ing the ex-ante principle.
According to the draft NAP for 2008-2012 it is in-tended that in the period of 2008-2012, 46.41 Mt allow-ances will be allocated to allowance trading installations using the ex-ante method. That is approximately 9.28 Mt per year. Another 9.76 Mt will be placed in reserve for new entrants. The allowances from this reserve will only be given for new entrants. If by the end of the period 2008-2012 there are unused allowances for new entrants, they will be annulled. If there are no allowances for new entrants left, the reserve can be supplemented with the allowances, allocated for the “reserve related to the clo-sure of Ignalina NPP” or the ones intended to be sold in the auction. If there is no such option, new entrants will have to purchase the allowances on the market. Another 1.12 Mt will be placed in the reserve of joint implementa-tion projects. The allowances from the reserve of joint implementation will be annulled after implementing the joint implementation projects in Lithuania, which reduce the pollution in the installations of the allowance-trading scheme.
use or power generation which would indirectly reduce the amount of generated power in the installations of the allowance trading scheme, it is offered to use the pollu-tion factor equal to 0.634 t CO2/MWh of the electricity generated. It corresponds the average pollution of Lithua-nian power plant for one MWh of the generated electric-ity. Lithuanian power plant is the installation, which has the biggest variable costs of electricity generation; there-fore, with the decrease of the power demand on the mar-ket, the load of this power plant would decrease. Another 2.32 Mt of allowances (that is 0.47 Mt per year) will be sold in the auction.
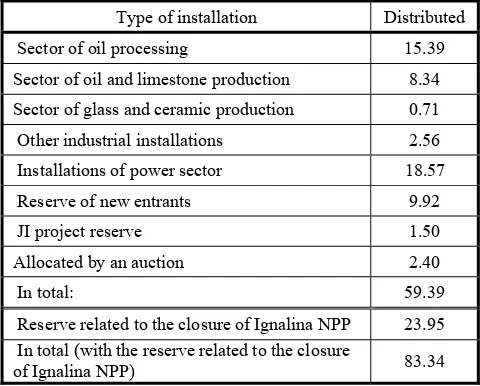
All in all, the projected number of allowances is 59.70 Mt. That is 11.94 Mt per year. In the period of 2005-2007 the annual number of allocated allowances was 12.256 Mt. In the period of 2008-2008, the annual number of allocated allowances is 2.7% smaller than the average annual number of allocated allowances in the period of 2005-2007, although the allowances are not allocated for 93 installations as in 2005-2007, but they are allocated for 134 installations. Additional 23.57 Mt allowances are placed into the “reserve related to the clo-sure of Ignalina NPP”. The allowances from this reserve will be allocated for those installations which de-facto considerably increase the power production compensating for the influence of the closure of Ignalina NPP. There-fore 83, 34 Mt of allowances were allocated in draft Na-tional allocation plan for 2008-2012 (Table 4).
Table 4 Number of allowances to be allocated in 2008-2012, Mt
(Ministry of Environment, 2006a)
Type of installation Distributed
Sector of oil processing 15.39
Sector of oil and limestone production 8.34 Sector of glass and ceramic production 0.71
Other industrial installations 2.56
Installations of power sector 18.57
Reserve of new entrants 9.92
JI project reserve 1.50
Allocated by an auction 2.40
In total: 59.39
Reserve related to the closure of Ignalina NPP 23.95 In total (with the reserve related to the closure
of Ignalina NPP) 83.34
Analysis of new NAP indicated that with the growth of Lithuanian economy CO2 emissions per GDP seeking to maintain the average annual GHG emission level up to 2012 should be reduced by 33%. This is important chal-lenge for Lithuanian enterprises taking into account-anticipated closure of unit 2 at Ignalina NPPP. It is fore-seen that with the reduced supply of GHG emission al-lowances in 2008-2012 because of restrictions imposed in new NAPs to GHG emission trading sectors and the fast economic growth in new member states will drive the price of allowance up to 50-60 EUR/t. This will have impact on increased investments in use of renewable
en-ergy sources especially of biomass in enen-ergy sector and in increase of energy efficiency (Ministry of Economy, 2006). Therefore it is very important to ensure the in-vestments of energy and industrial enterprises in mod-ernization of energy sector (Markandya at al, 2006). Such high prices of allowances will create situation than previ-ously not competitive in the energy market expensive advanced technologies will become efficient having short payback period (Streimikiene, 2005). However these trends will cause increase in energy prices to consumers. One of the possibilities to reduce burden of GHG emis-sion trading on economy and to mitigate GHG allow-ances and energy price increase is application of Flexible Kyoto mechanism which are cheaper options to acquire GHG emission credits and to cover increased GHG emis-sions in the country.
By the Order No. D1-183 Lithuanian Environmental Protection Fund (LAAIF) was appointed as responsible institution for the evaluation of concept of JI projects. The task of registry established in accordance with plementation of GHG emission trading scheme in JI im-plementation scheme is to issue ERU certification, ERU accounting and transfer between accounts of the govern-ment, legal entities and between registries of Lithuania and other registries in UNFCCC Annex I countries. To ensure complete GHG accounting, GHG registry ex-changes information with the Lithuanian Ministry of En-vironment, which is responsible fro the annual reporting obligations on GHG emissions and removals.
Therefore Lithuania has all institutional and legal ar-rangements to implement flexible Kyoto mechanisms however up to now the development of JI projects in Lithuania goes very slowly. “Baltic” JI developments of the past few years have been framed by the Regional Testing Ground Agreement for Flexible Mechanisms. On 29 September 2003, seven countries of the Baltic Sea Region – Denmark, Finland, Germany, Iceland, Lithua-nia, Norway and Sweden signed the Regional Testing Ground Agreement for Flexible Mechanisms of the Kyoto Protocol. The agreement aims at stimulating cli-mate investment projects in the Baltic Sea Region in the energy sector. The remaining regional countries are ex-pected to sign at some later date. The Testing Ground Agreement is open to other parties which have adhered to the Kyoto Protocol. Through the implementation of the agreement, participants will gain experience, develop methods and procedures, collaborate in addressing ad-ministrative and financial barriers, ensure issuance and transfer of greenhouse gas credits, and implement pro-jects early, offering credit. The objectives are to achieve cost-effective reduction in greenhouse gas emissions by international co-operation, and thus reduce the overall cost of achieving the commitments under the Kyoto Pro-tocol. The countries will ensure issuance and transfer of greenhouse gas credits related to or accruing from Joint Implementation projects, facilitate generation, minimize transaction costs, especially regarding small and medium scale JI projects.
projects aim to reduce GHG emissions by converting heating plants to the use of biofuels, and introducing effi-cient energy distribution systems in district heating plants. The total investment of the projects implemented under the Lithuanian AIJ programme is worth more than US$ 4 million, on favorable terms. Moreover, a number of projects have been carried out on energy saving and renewable energy with the support from Denmark and World Bank (Streimikiene at al, 2005).
Lithuania is now seeking JI project opportunities and investors. There is a trade-off for Lithuania country to en-courage JI projects. The benefit is increased foreign in-vestment (due to the tradable carbon credits investors will earn) in environmentally friendly projects, which contrib-ute to local economic and sustainable development.
The downside is that Lithuania transfers Kyoto-eligible carbon credits outside its country from all such projects, thus increasing its own burden of meeting Kyoto commitments equal to the number of tones “exported” through JI. However, Lithuania has a clear “cushion” that makes it attractive to get involved in international carbon markets. Moreover, recent experience in other countries suggests that there is sufficient demand for JI projects.
As far as the expected consequences of the Linking Directive are regarded, one can summarize that careful JI project design, adequate contractual provisions and early registration of JI projects are required – to make sure that they are accounted for in the reserve pool – in combina-tion with the overall good investment climate of EU ac-cession countries mean that JI is still an attractive option for carbon credit buyers. However, non-Accession coun-tries such as Romania, Bulgaria, Russia, Ukraine and Croatia may become stronger competitors.
Conclusions
1. Lithuania has implemented GHG emission
trad-ing scheme and participates in application of flexible Kyoto mechanism. The results of first trading year in Lithuania indicated that enter-prises participating in GHG emission trading scheme benefited. In 2005 13.8 Mt of CO2 al-lowances were allocated for Lithuanian enter-prises. At the same time GHG emissions from these enterprises in 2005 amounted to 6.6 Mt of CO2 equivalent. Most of the surplus allowances were sold to other enterprises in EU.
2. Some enterprises in Lithuania have sold
allow-ances in the summer of 2005 than the price of al-lowance reached 30 EUR/t and generated profits.
3. The surplus of allowances in Lithuania was
caused by the fact that the closure of the first unit at Ignalina NPP in 2005 had no significant impact on GHG emission increase as was predicted in NAP because second unit at Ignalina NPPP was operating very efficiently in 2005 and the time spent for regular maintenance was very short.
4. Another factor was the increase in natural gas
prices stipulated the increase of energy produc-tion costs and therefore the increase of electricity demand were covered not by increased energy production in Lithuanian power plants but by
electricity import from Russia and Estonia.
5. Another important reason why Lithuanian
enter-prises in energy sector didn‘t use allowances al-located for them was investments in biomass combustion technologies and measures to in-crease energy production, transmission and use efficiency.
6. Analysis performed indicated that in 2005 just 3
installations from total 93 installations included in GHG emission trading scheme emitted into atmosphere more than emission allowances they have been allocated for. Such situation created the opinion between Lithuanian enterprises that GHG emission trading scheme is the form of EU subsidy to Lithuanian enterprises instead of obli-gation to reduce GHG emissions.
7. However since 2008 Lithuanian enterprises
should be prepared for more difficult times. Ac-cording to the requirement of EC the allocated allowances for installations in 2008-2012 should not exceed the annual allocated allowances in the first period therefore the increase of GHG emis-sions because of economic growth should be mitigated by increased energy efficiency.
8. In the end of 2009 than the second unit at
Ig-nalina NPP will be closed just two alternatives will be available for Lithuania: to buy high amounts of electricity from Russia or to increase load of thermal power plants and satisfy re-quirements of Directive 2003/ 87/EC) by buying allowances from other EU member states.
9. It is easy to predict that in 2008 the enterprises
investing in use of renewable energy sources or increase in end-use energy efficiency will be able to sell the surplus allowances. The shortage of allowances will be felt in enterprises which will increase production comparing with 2002-2005 year period and use the fossil fuel.
10. Therefore the solution of this problem will be the
increased investments in energy efficiency measures and promotion of new technologies in energy sector. This should be emphasized in all main energy policy documents and should be the guiding principle of energy sector development in Lithuania.
References
1. Andersen, M. S. Designing and introducing green taxes: institutional dimensions. In Market-based instruments for environmental man-agement. Politics and Institutions. Andersen, M.S. and Sprenger, R.-U. (ed.). Cheltenham: Edward Elgar, 2000.
2. Andrews, G. Market Based Instruments: Australia Experience With Trading Renewable Energy Certificates. In Proceedings of the UNFCCC workshop on Good Practices in Policies and Measures. Copenhagen, 2001.
3. Ciegis, R. Prekybos apyvartiniais taršos leidimais sistemos eko-nominio efektyvumo didinimas: paskirstymo metodųįtaka /R. Ciegis, R. Bubniene // Ekonomika, 2006, 73, 19-33.
4. Fischer, C. Project-based mechanisms for emissions reductions: balancing trade-offs with baselines//Energy Policy, 2005, Vol. 33, is-sue 14, p. 1807-1823.
Praetorius // In Proceedings of the European Council for Energy Effi-cient Economy (ECEEE) summer study. 2003.
6. Markandya, A. Energy Efficiency in Transition Economies / A. Mar-kandya, S. Pedroso, D. Streimikiene // Energy Economics, 2006, 28, p. 121-145.
7. Ministry of Environment. Lithuania’s national allocation plan for greenhouse gas emission allowances for the period 2005 to 2007. Vilnius, 2004.
8. Ministry of Environment. National Strategy for Implementation of the UNFCCC, Vilnius, 2006a.
9. Ministry of Environment. Lithuania’s national allocation plan for greenhouse gas emission allowances for the period 2008 to 2012. Vilnius, 2006b, Draft.
10. Ministry of Economy of Republic of Lithuania. National energy strategy. Vilnius, 2006.
11. Bertoldi, B. White, green & brown certificates: How to make the most of them?/ B. Bertoldi., S. Rezessy, O. Langniss, M. Voogt // In Proceedings of the European Council for Energy Efficient Economy (ECEEE) summer study, 2005.
12. Sonneborn, C. L. Renewable energy and market-based approaches to greenhouse gas reduction—opportunity or obstacle? // Energy Policy, 2005, Vol. 32, issue 16, 1799-1805.
13. Streimikiene, D. The challenges of Kyoto commitments for Lithua-nian energy sector / D. Streimikiene, R. Bubniene //In Proceedings of 3rd European congress Economics and management of energy in in-dustry, CENERTEC, 2004.
14. Streimikiene, D., Punys, P., Burneikis, J. Review of renewable en-ergy in Lithuania / D. Streimikiene, P. Punys, J. Burneikis // Renew-able and SustainRenew-able Energy Review, 2005, February, vol. 9, issue 1, p. 29-49.
15. Streimikiene, D.Indicators for sustainable energy development in Lithuania//Natural Resources Forum, 2005, Vol. 29, issue 4, p. 322-334.
16. Streimikiene, D. Implementation of Kyoto flexible mechanisms in Lithuania / D. Streimikiene, A. Mikalauskiene //Nuclear and radia-tion technologies, 2004a, No. 2, t.4, p. 35-39.
17. Streimikienė, D. Perspectives of joint implementation projects in Lithuania / D. Streimikienė, A. Mikalauskienė //Organizacijų vadyba: sisteminiai tyrimai 2004b, Nr. 29, p. 201-213.
18. Streimikiene, D. Review of climate policies in the Baltic States // D. Streimikiene, R. Ciegis, R. Pusinaite //Natural Resources Forum,
2006, Vol. 30, issue 4, p. 288-301.
19. Streimikienė, D. Implementation of EU Emission Trading Scheme in Lithuania//Organizacijų vadyba: sisteminiai tyrimai. 2004, Nr. 30, p. 179-191.
20. TemaNord 2004:548. EU Emission Trading Scheme and the Effect on the Price of Electricity, ECON Analysis, 2004
21. Vesterdal, M. How should greenhouse gas permits be allocated in the EU? / M. Vesterdal, G. T. Svendsen // Energy Policy, Vol. 32, Issue 8, June 2004, p. 961-968.
22. Woerdman, E. Organizing emissions trading: the barrier of domestic permit allocation // Energy Policy, 2000, Vo. 28, Issue 9, p. 613-623.
Remigijus Čiegis, Dalia Štreimikienė
ES prekybos šiltnamio dujų emisijomis iššūkiai Lietuvai
Santrauka
Straipsnis analizuoja ES prekybos apyvartiniais taršos leidimais sistemos įgyvendinimo Lietuvoje problemas ir iššūkius. Pagrindinis straipsnio tikslas – įvertinti prekybos apyvartiniais taršos leidimais
įtaką energijos kainoms ir Lietuvos ūkio plėtrai, remiantis naujai parengto apyvartinių taršos leidimų paskirstymo plano 2008-2012 m. duomenimis bei prekybos pirmajame laikotarpyje pirmuoju laikotar-piu – pirmųjų metų rezultatais.
Europos Sąjungos Parlamento ir Tarybos direktyvoje 2003/87/EB, nustatančioje prekybos šiltnamio efektą sukeliančiųjų
dujų emisijomis schemą Bendrijoje, numatyta visose šalyse narėse, kurių Nacionaliniai apyvartinių taršos leidimų (ATL) planai pat-virtinti Komisijoje, nuo 2005 m. sausio 1 d. pradėti prekybą
apyvar-tiniais taršos leidimais tam tikruose apibrėžtuose pramonės sektoriu-ose, išduodant įmonėms apyvartinių taršos leidimų plane nustatytą
apyvartinių taršos leidimų kiekį. Įgyvendinant direktyvą 2003/87/EB, 2005-2007 m. 11428 įrenginiams, buvo paskirstyta 6572,4 mln. ATL. Pirmame prekybos apyvartiniais taršos leidimais etape 2005-2007 m. dalyvavo šie sektoriai, prekiaujantys tik CO2 emisijomis: energetika
(nominali galia >20 MW); naftos perdirbimas; kokso gamyba; miner-alinių medžiagų apdirbimas; cemento gamyba (> 50 t/d ir kt.); stiklo gamyba (>20 t/d); keramikos gamyba; celiuliozės, popieriaus, kar-tono gamyba; metalo ir plieno gamyba. Antrajame prekybos emisi-jomis etape, kuris prasidės nuo 2008 m. ir truks iki 2012 m., bus prekiaujama ir kitomis šiltnamio efektą sukeliančiosiomis dujomis, taip pat numatoma įtraukti kitus sektorius.
Direktyva perkelta į Lietuvos teisinę sistemą 2004 m. balandžio 29 d., priėmus Lietuvos Respublikos aplinkos ministro įsakymą Nr. D1 – 231 dėl šiltnamio dujų apyvartinių taršos leidimų išdavimo ir prekybos jais tvarkos aprašo patvirtinimo, ir 2004 m. gegužės 31 d. aplinkos ministro įsakymu Nr. D1-293, pataisius bei papildžius šilt-namio dujų emisijų leidimais Taršos integruotos prevencijos ir kon-trolės leidimų išdavimo, atnaujinimo ir panaikinimo taisykles.
Parengtas Nacionalinio apyvartinių taršos leidimų paskirstymo planas (NATLPP), patvirtintas LR Aplinkos ministro įsakymu „Dėl nacionalinio ATL paskirstymo 2005-2007 metams plano patvirtinimo 2004 m. gruodžio 27 d. (D1-686). Plane numatyta, kad 2005-2007 m. bendras apyvartinių taršos leidimų kiekis (ATL) 36796184 t CO2
ekvivalento. 2005 m. numatyta paskirstyti – 40%, 2006 m. – 30%, o 2007 – 30% CO2e apyvartinių taršos. Galima padaryti išvadą, kad
Lietuvos energetikos ir pramonės įmonėms dalyvavimas ES prekybos apyvartiniais taršos leidimais sistemoje davė nemažai naudos. Lietu-vos įmonėms 2005 metams buvo suteikta apyvartinių taršos leidimųį
atmosferą išleisti 13,8 milijonų tonų CO2. Tuo tarpu 2005 m. šių įrenginių CO2 išleidimas siekė tik 6,6 milijonus tonų. Likusius
apy-vartinius taršos leidimus įmonės galėjo parduoti kitoms ES įmonėms, kurioms apyvartinių taršos leidimų trūko. Įmonės, pardavusios apy-vartinių taršos leidimų perteklių 2006 metų pradžioje, kai rinkos kaina buvo pati aukščiausia ir siekė 20-30 eurų už apyvartinį taršos leidimą, gavo nemažų papildomų pajamų. Tokia situacija 2005 metais susiklostė visų pirma dėl to, kad Ignalinos AE I bloko uždarymas nepadarė tokios didelės įtakos taršai šiluminėse elektrinėse augti, kaip kad buvo planuojama derinant apyvartinių taršos leidimų planą
2005-2007 metams su ES Komisija. 2005 metais ypač efektingai ir patikimai dirbo antrasis Ignalinos AE blokas, jo remonto laikotarpis buvo kaip niekad trumpas, o pakilusios importuojamų gamtinių dujų
ir naftos kainos sąlygojo situaciją, kai šiluminėms elektrinėms ne-beapsimokėjo gaminti didesnio kiekio elektros energijos. 2005 metais ypač padidėjo elektros energijos importas iš Rusijos ir Estijos, o Lietuvos šiluminės elektrinės savo pastoviuosius kaštus padengė, pardavusios netikėtai pabrangusius neišnaudojamus apyvartinius taršos leidimus. Kita priežastis, dėl kurios Lietuvos įmonės neišnau-dojo apyvartinių taršos leidimų, – aktyvus energetikos ir pramonės
įmonių investavimas į biokuro naudojimą, energijos gamybos, per-davimo ir vartojimo efektyvumo didinimą.
Kadangi numatoma Lietuvos įmonių, dalyvaujančių prekyboje ATL, tarša 2005-2007 m. sudarys 36,80 Mt (pačių įmonių pateikta informacija, verifikuota LR ūkio ministerijos), tai Lietuvai paskir-stytų 36 794 184 ATL turėtų ne tik visiškai užtekti, kad įmonės galėtų efektyviai vystyti savo veiklą, nepirkdamos ATL ES rinkoje, tačiau švaresnio kuro naudojimas ir energijos gamybos efektyvumo didinimas turėtų sudaryti geras galimybes sutaupytiems ATL parduoti ES rinkoje, kur numatoma nemaža ATL paklausa, o 2005 m. ATL kainos pasiekė 30 EUR/tCO2e, tiesa, po to smuko.
2004 m. spalio 27 d. buvo priimta jungiančioji Direktyva 2004/101/EB, papildanti direktyvą 2003/87/EB, nustatančią prekybos šiltnamio efektą sukeliančių dujų emisijomis schemą Bendrijoje as-pektais, susijusiais su Kioto protokolo mechanizmais. Pagal
Jungian-čiąją direktyvą 2004/101/EB nuo 2005 m. sertifikuoti taršos mažinimo vienetai gauti, įdiegus Švarios plėtros mechanizmus (ŠPM), galės būti laisvai konvertuojami į apyvartinius taršos leidimus, o nuo 2008 m. Taršos mažinimo vienetai (TMV), gauti
įdiegus Bendro įgyvendinimo (BĮ) projektus, bus taip pat konvertuo-jami į Apyvartinius taršos leidimus (ATL) be jokių ribojimų. Remian-tis direktyvos 2004/101/EB nuostatomis bei LR aplinkos ir ūkio min-istrų 2004 m. gegužės 19 d. įsakymo Nr. D1-279/4-193 „Dėl Jung-tinių Tautų Bendrosios klimato kaitos konvencijos Kioto protokolo bendro įgyvendinimo mechanizmo įgyvendinimo strateginių krypčių
LR aplinkos ministro įsakymas dėl Bendro įgyvendinimo projektų
vykdymo taisyklių patvirtinimo. Šiose taisyklėse nustatyta, kad, į gy-vendinus BĮ projektus, gaunami taršos mažinimo vienetai yra perduo-dami investuojančiai šaliai, nepažeidžiant Jungiančiosios direktyvos nuostatų bei atsižvelgiant į priimančiosios šalies (Lietuvos) indėlį į
BĮ projekto vykdymo finansavimą.
Atlikta ATL panaudojimo 2005 m. Lietuvoje analizė parodė, kad Lietuvoje 2005 metais tik 3 įrenginiai iš 93 į atmosferą išleido daugiau CO2 nei gavo apyvartinių taršos leidimų. Tokia situacija
suformavo Lietuvos įmonių požiūrį į prekybos apyvartiniais taršos leidimais sistemą kaip į savotišką Europos Sąjungos paramos formą, bet ne įįpareigojimą. Deja, įmonės jau turėtų pradėti ruoštis sunkes-niems laikams. Nuo 2008 metų Europos Sąjungoje prasideda antrasis prekybos apyvartiniais taršos leidimais laikotarpis. Visos ES šalys, tarp jų ir Lietuva, jau parengė apyvartinių taršos leidimų paskirstymo planų projektus antrajam prekybos laikotarpiui. Visi planai dar turės būti patvirtinti ES Komisijos, kuri pastaruoju metu smarkiai sugriežtino savo poziciją ir reikalauja, kad šaliai skirtas apyvartinių
taršos leidimų kiekis turėtų būti ne didesnis nei 2005 metų patvirtin-tos šalies įmonių bendros CO2 emisijos, o ekonomikos augimo są
ly-gojamas energijos vartojimo augimas turėtų būti kompensuojamas energijos efektyvumo augimu.
Lietuva šiuo atveju atsiduria ypač nepalankioje situacijoje. 2009 metų pabaigoje uždarius Ignalinos AE antrąjį bloką, lieka tik dvi alternatyvos: arba pirkti didelius kiekius elektros energijos iš Rusijos, arba padidinti Lietuvos šiluminių elektrinių apkrovimą ir pirkti apy-vartinius taršos leidimus iš kitų Europos Sąjungos šalių. Jau dabar galima prognozuoti, kad nuo 2008 metų Lietuvoje apyvartinius taršos
leidimus galės pardavinėti tik tos įmonės, kurios iki to laiko padarys ryškias investicijas į atsinaujinančių energijos išteklių panaudojimą ir energijos ūkio efektyvumą. Su didžiausiu apyvartinių taršos leidimų
trūkumu neišvengiamai susidurs įmonės, gerokai padidinusios ga-mybą, palyginti su 2002-2005 laikotarpiu, ir energijai gaminti naudo-jančios tik gamtines dujas, naftos produktus ir kitą iškastinį kurą, nemažindamos kuro sąnaudų, tenkančių vienam gamybos vienetui.
Augant Lietuvos ūkiui, vienam BVP litui tenkanti CO2 tarša
Lie-tuvoje, siekiant išlaikyti bendrą 2005 metų taršos lygį, iki 2012 metų
turėtų sumažėti trečdaliu. Tai labai rimtas iššūkis Lietuvos įmonėms, ypačįvertinant Ignalinos AE uždarymo pasekmes. Reikia laukti, kad apyvartinių taršos leidimų kaina, sumažėjus bendram jų kiekiui Euro-pos Sąjungos įmonėse ir augant ekonomikai Rytų Europos šalyse, 2008-2012 metais gali pakilti iki 50-60 eurų ribos. Prekybos apyvar-tiniais taršos leidimais sistema ir toliau papildomai skatins įmones daugiau investuoti į atsinaujinančių energijos išteklių panaudojimą, energijos gamybos ir naudojimo efektyvumą, tačiau Lietuvos
įmonėms ši skatinimo sistema gali pradėti veikti nebe paramos forma, bet lazdos principu. Todėl labai svarbu, kad Lietuvos energetikos ir pramonės įmonės jau dabar ypač daug investuotųį energetikos ūkio modernizavimą, įgyvendinant net ir tuos projektus, kurie iki šiol atsipirkdavo per ilgesnį laikotarpį. Tai atveria dar didesnes perspek-tyvas vėjo jėgainių plėtrai Lietuvoje. Įvertinus tokias aukštas progno-zuojamas ATL kainas, šios jėgainės turėtų tapti dar patrauklesnės, palyginti su organinį kurą deginančioms elektrinėmis.
Raktažodžiai: klimato kaitos švelninimo politika, prekyba šiltnamio dujų emisijomis, lankstūs Kioto mechanizmai.
The article has been reviewed.