Using different classification models in wheat grading utilizing visual features
Zahra Basati, Mansour Rasekh*, and Yousef Abbaspour-GilandehDepartment of Biosystem Engineering, Faculty of Agricultural and Natural Resources, University of Mohaghegh Ardabili, Ardabil, Iran
Received July 11, 2017; accepted February 16, 2018
*Corresponding author e-mail: [email protected], [email protected]
A b s t r a c t. Wheat is one of the most important strategic crops in Iran and in the world. The major component that dis-tinguishes wheat from other grains is the gluten section. In Iran, sunn pest is one of the most important factors influencing the characteristics of wheat gluten and in removing it from a balanced state. The existence of bug-damaged grains in wheat will reduce the quality and price of the product. In addition, damaged grains reduce the enrichment of wheat and the quality of bread products. In this study, after preprocessing and segmentation of images, 25 features including 9 colour features, 10 morphological features, and 6 textual statistical features were extracted so as to classify healthy and bug-damaged wheat grains of Azar cultivar of four levels of moisture content (9, 11.5, 14 and 16.5% w.b.) and two lighting colours (yellow light, the composition of yellow and white lights). Using feature selection methods in the WEKA soft-ware and the CfsSubsetEval evaluator, 11 features were chosen as inputs of artificial neural network, decision tree and discri -ment analysis classifiers. The results showed that the decision tree with the J.48 algorithm had the highest classification accuracy of 90.20%. This was followed by artificial neural network classifier with the topology of 11-19-2 and discrimient analysis classifier at 87.46 and 81.81%, respectively.
K e y w o r d s: artificial neural network, bug-damaged wheat, decision tree, feature selection, image processing
INTRODUCTION
Wheat is the most important global cereal crop. Accord- ing to the World Food Organization (FAO), in 2016, global wheat production was close to 760 million tons. After harvesting, wheat grain is directly transported for food processing or stored in silos for sale at specified inter -vals. Wheat grain quality is defined by several parameters, with purity being one of the most important factors
affect-ing the purchase price of the product. The presence of seeds damaged by pests and insects is considered to be an impuri-ty (Ebrahimi et al., 2014). In Iran and many other countries, sunn pest is an important pests of cereals, especially wheat
and barley (Najafi-mirak, 2012).Tischler (1939) showed
that early attacks on wheat fields resulted in the produc
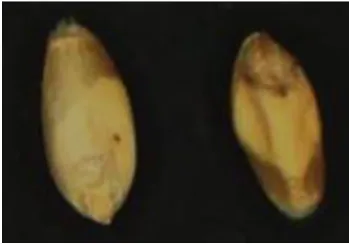
-tion of wrinkled grains, while late attacks had little effect on grain size and weight, but had the significant effect of generating the presence of dark biting spots on the affected grain with a small area around it (Fig. 1). Sunn pest damages wheat grains through reducing yield, seed germination and gluten levels (Critchley, 1998). The injection of toxic saliva into the wheat grain destroys gluten and reduces the qua- lity of the bakery flour resulting from these grains (Critchley, 1998; Every, 1990; Tischler, 1939). These damaged grains produce a sticky paste and poorly-packaged bread with low volume and unacceptable texture (Vaccino et al.,
2006). Thus, by reducing the quality of produced bread,
© 2018 Institute of Agrophysics, Polish Academy of Sciences
the resulted waste also increases. Of note, the damaging of grains by 14% reduces germination by 88% (Critchley, 1998). Therefore, in wheat, which forms the major part of the public food, the quality of wheat (unwanted mixing of bug-damaged wheat and healthy wheat) has particular importance.
Some wheat qualitative assessments are still carried out manually, depending on the percentage of damage (for example, in wheat silos and flour mills). This approach has low accuracy and it is difficult and time-consuming. The visual machine, which has recently developed rapid-ly, is a quick and visual method for identifying the good quality of agricultural products (Choudhary et al., 2008; Majumdar and Jayas, 2000b). The visual machine has become an acceptable substitute for the decision-making process based on human vision. As a result, many studies have been performed so as to determine the quality and
classification of wheat using digital imaging and clas
-sification models (Luo et al.,1999; Paliwal et al., 2001;
Zayas et al., 1986). Choudhary et al. (2008), in a study
on grains classification, used colour uniqueness, morpho
-logical features, texture and wavelet features and their combination. Subsequently, linear and quadratic
statisti-cal classifiers were used to classify the cereal grains.The
combined model of colour, morphological, texture and
wavelet features along with a linear discriminant classifi
-er w-ere recognized as the best classification model (with accuracies of 99.4, 99.3, 98.6, 98.5, and 89.4% for Canada Western Red Spring (CWRS) wheat, rye, barley, oats and the Canada Western Amber Durum (CWAD), respectively. Zapotoczny et al. (2008) used 54 morphological features to identify barley seeds. In this research, principal component analysis (PCA), linear discriminant analysis (LDA) and nonlinear discriminant analysis (NDA) were employed as
classification models. Zapotoczny et al. (2008)noted that
LDA has a higher degree of accuracy for classifying bar
-ley cultivars. In addition, Mollazade et al. (2012) employed the correlation-based feature selection (CFS) method to classify raisin products into four different classes (green non-tailed, dark non-tailed, green tailed and dark tailed), after extracting colour and shape properties to select top features. Afterwards, they applied support vector machine (SVM), artificial neural network (ANN) and decision tree
(DT) to enhance the classification. The results showed that
the ANN method (with an accuracy of 96.33%), had the
highest classification accuracy. Moreover, Ebrahimi et al.
(2014) used 52 features of colour, shape and texture, as well as a new algorithm, a combination of the imperialist competitive algorithm (ICA) and artificial neural networks (ANNs), for classifying the 4 wheat cultivars and 8 types of weed seeds found in Iran’s agricultural fields so as to find the best parameter of the features and to create a strong
classification model. Finally, Golpour et al. (2014) used 36
colour features in three colour spaces RGB, HSV and HSI to identify 5 rice cultivars in 3 forms of white rice, brown
rice and rough rice. Using a double-layered back propaga-tion neural network, the classificapropaga-tion accuracy for rough rice, brown rice, and white rice was 98.8, 100, and 100%, respectively.
As impurities in wheat (such as the presence of bug-dam-aged grains) reduce its purchase price and negatively affect bread item production, and as the germination capacity in the bug-damaged grains is also lowered, it is necessary to apply techniques that identify and classify bug-damaged and healthy grains using visual identifying factors. The aim of this study, thus, is to classify and to model wheat of four levels of moisture content and two colours of lighting, into two classes – bug-damaged and healthy, colourusing visual features (colour, morphology, and texture) and classifiers of the neural network, decision tree and linear discriminant analysis.
MATERIAL AND METHODS
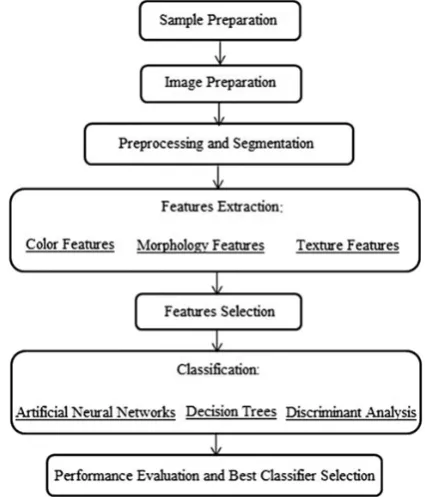
The proposed algorithm for teaching a computer visu-al system for identifying and classifying the type of wheat includes sample preparation, preparation of images, pre-processing, extraction of features, selection of effective
features and classification, which are explained, respective
-ly (Fig. 2).
In this study, after preparation of the Azar variety wheat grain, the sample was transformed to the biophysical pro- perties laboratory of the biosystems engineering depart-ment of the University of Mohaghegh Ardabili. All samples
of wheat were first manually cleaned from external sub
-stances and then were visually separated into two quality groups of healthy and bug-damaged grains.
The initial moisture content of the grain of wheat, mea-sured through a 130°C oven method for 19 h according to the standard procedures (Standard ASAE, 2002), was 9% wb. Experiments were performed at four levels of mois-ture content: 9, 11.5, 14 and 16.5% wb. To reach moismois-ture content of wheat samples to the higher values of mois-ture content and to calculate the amount of water needed to be added to the initial mass of wheat, Eq. (1) was used (Mohsenin, 1986):
(1)
where: Q is the mass of the added water (g), W is the initial mass of the sample (g), Mf is the initial moisture content of
the sample (%, wb) and Mi is the final moisture content of
the sample (%, wb).
To prepare the images of healthy and bug-damaged wheat grains, an imaging system, including a parabolic chamber made of stainless steel, a lighting system and a co- lour CCD camera of 7 MP (SONY model SC-W12), was used. Three circular LED and four fluorescent lamps were placed in the upper half of the chamber at 90o from each
other. The order of light sources and the circularity of the chamber with appropriate reflex and regular light radiation properties brought about uniform light within the entire chamber, and as a result, minimized shadow in the imag-es. For each image, 100 grains were randomly selected and placed on the background so that they did not contact with each other. Black Eschenbach paper was used as a back-ground (based on the early experiments) and histogram curves were observed in the range of gray. The camera was installed on top of the container with a distance of 30 cm from the samples and 2x zoom was used for the preparation
of images so that all grains were clearly in the frame of camera. Based on initial experiments, all images were gen-erated within a closed container, while two lighting colours of yellow and a combination of yellow and white were applied. Two types of wheat grains were tested (healthy and bug-damaged) at four levels of moisture and in two lighting colours (yellow and combinations of yellow and white). A total of 16 images were obtained. Since there were 100 grains in each image, 1600 grains were used to produce images. All images were in the JPG format with the size of 2304 x 3072 pixels. These were transferred to a personal computer (4 GB RAM and 2.3 GHz processor). MATLAB R2014b software was then used to process the images. Features extracted from images were divided into three main groups of colour, morphological and texture fea-tures. Before extracting these features, pre-processing and segmentation were performed.
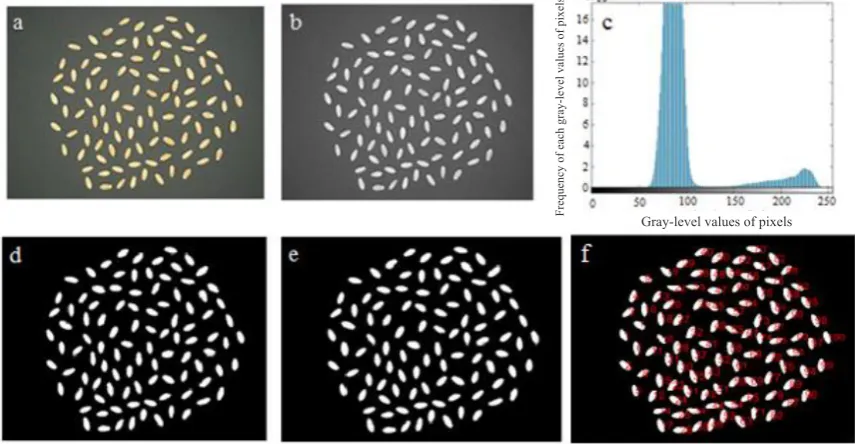
The purpose of the pre-processing and segmentation was to generate an improvement of image such that while reducing unwanted features, some image features that are important for further processing are enhanced and the image is divided into areas. The first task after calling up a colour image via the software MATLAB, was to remove the background. Figure 3a shows the initial image of the sampled grains. With regard to the proper contrast between background and the wheat grain samples, segmentation was conducted by ordering graythresh via the Otsu method (Otsu, 1979). As Fig. 3bc shows, due to the correct selec-tion of the background colour for the light source, there is good contrast between the sample and the background. Fig. 3d shows the image of grains after removing the back-ground. To remove objects that were on the periphery of the image and noise that were seen as tiny white dots, the
Fig. 3. Initial grain imagery – (a), image of greyscale - (b), histogram of gray levels – (c), Otsu background removal – (d), binary image created after removing noises and filling holes – (e), labeling grains – (f).
Gray-level values of pixels
Frequency of each gray-level values of pixels
imclearborder command and bwareaopen morphology oper-ator were used. Imclearborder suppresses structures that are lighter than their surroundings and that are connected to the image border. In other words, this function is employed to clear the image border. The resulting image can be a gray-scale or a binary image. Bwareaopen removes from a binary image all connected components (objects) that have fewer than P pixels, producing another binary image. This opera- tion is known as an ‘area opening’. Imfill command was
used then to fill cavities (Gonzalez et al., 2004). Finally,
a smooth and uniform black and white image was created that included only the grain of wheat, and the background pixels were assigned a value of zero, and the sample pixels were assigned a value of one (Fig. 3e). By applying the bwlable command to the black and white image, the indi-vidual grains were assigned a label so to distinguish each
grain (Arefi et al., 2011) (Fig. 3f).
Since the colour, morphological and texture features are considered important in identifying agricultural products (Neelamma et al., 2011) and are also the basis of seve-
ral previous studies (Arefi et al., 2011; Ebrahimi et al.,
2014; Majumdar and Jayas, 2000a; Paliwal et al., 2001), in this research, identifying healthy and bug-damaged wheat samples was performed based on colour, morpho-logical and texture features (Table 1). To identify healthy and bug-damaged wheat grains by way of colour, colour models of RGB, HSV and Lab were used.
Today, the use of colour index is more common than other components in most of commercial separation and gradation systems. In the first years of using the machine vision technique, the colour of the product was evaluated based on the gray-scale taken by a monochrome camera. Now, video cameras based on RGB are used in the prepa-ration and processing centers. A large proportion of the
T a b l e 1. Available features measured by image analysis for each wheat grain
Colour feature Morphology feature Texture feature
Colour
models Feature description Feature name Feature description Feature name Feature description
a
RGB HSV Lab
Area Number of pixel inside and including the wheat kernel boundary
Average gray level (Agl)
Mean Perimeter Algorithm calculates
the distance around the boundary of the wheat kernel
Average contrast (Ac)
Major axis length
(Majal) Llongest diameter of ellipse bounding wheat kernel
Smoothness
Minor axis length
(Minal) Shortest diameter of ellipse bounding wheat kernel
Third moment (Thm)
Excentricity It is the ratio of the distance between the foci of the ellipse and its major axis length
Uniformity
Solidity It describes the extent to which the shape is convex or concave
Entropy
Compactness 4π(area) / (perimeter)2
Circularity (perimeter)2 / area
Area ratio (Ar) area/ (major axis)(minor axis)
Aspect ratio (Asr) major axis/minor axis
a μ, z
i, p(zi), land m represent mean nth moment, random variable related to intensity, normalized histogram of intensity levels, number
colours visible to humanscolour can be created by different combinations of the three primary colours of red (R), green (G) and blue (B). Hue (H), saturation (S) and value (V) are based on cylindrical coordinates. Converting RGB to HSV involves creating equations for mapping values of RGB (in Cartesian coordinates) and modifying these to cylindrical coordinates. This conversion can be done via MATLAB software, utilizing the function of rgb2hsv. The lab colour model is based on the theory of colour contrast. In this the-ory, the human eye receptors observe colours in contrast pairs: light-dark, red-green and yellow-blue. In this work, the red-green colour dimension is indicated by the symbol of ‘a’ (Redness), while the yellow-blue colour dimension is labeled utilizing the symbol ‘b’ (Yellowness). The third dimension of colour is lightness. Herein, the symbol ‘L’ is used. To convert the RGB colour space to Lab, two orders cform = makecform (‘srgb2lab’) and Lab = applycform (~, cform) were applied. Therefore, as Table 1 shows, 9 colour features, including means of colour components (R, G, B, H, S, V, L, a and b) were extracted from individual labeled grains.
Morphology can be defined as a theory for the analy-sis of spatial structures. The objective of this scientific branch is to analyze the shape and structure of objects. In this study, 10 morphological features of wheat grains were measured. Some features were obtained in MATLAB by regionprops function and others were obtained using the functions presented in Table 1. Texture provides criteria of properties such as flatness, coarseness and regularity. One of the simplest methods used to characterize the texture is the statistical moments related to the intensity histogram of an image or objective (Gonzalez et al., 2004).
To extract four moments average gray level (Agl), avera- ge contrast (Ac), smoothness and third moment (Thm)) and two features of uniformity and entropy of each wheat grain, related codes were developed in MATLAB programming environment (Table 1). Finally, to identify healthy and bug-damaged grains, 25 colour, morphological and tex-ture featex-tures were extracted using the orders available in MATLAB software, and by employing appropriate coding.
All feature reducing methods include the two main categories, methods based on feature extraction and meth-ods based on feature selection. Methods based on feature extraction draw a multidimensional space into a smaller space. In fact, by combining the values of the existing attri-butes, they create fewer attributes such that these features have all (or a large part) the information contained in the original features. These methods are divided into linear (discrete Fourier transform, discrete wavelet transform, principal component analysis) and non-linear groups (vec-tor quantization, principal curves, regression). However, feature-based methods actually select a subset of features to enhance the prediction accuracy. In other words, it includes reducing the size of the structure without significantly reducing the classification predictive accuracy obtained using the given features (Holmes and Nevill-Manning, 1995; Koller and Sahami, 1996). Feature selection is one of the issues discussed in the topic of machine learning, as
well as in pattern statistical identification. This is important
in many applications (such as categorization) since there are a lot of features in these applications, many of which are either useless or without a great deal of information. Excluding these features does not pose a problem in terms of information, rather it raises the computational load for the desired application. In addition, a huge deal of non-use-ful information along with usenon-use-ful data, is stored (Dash and
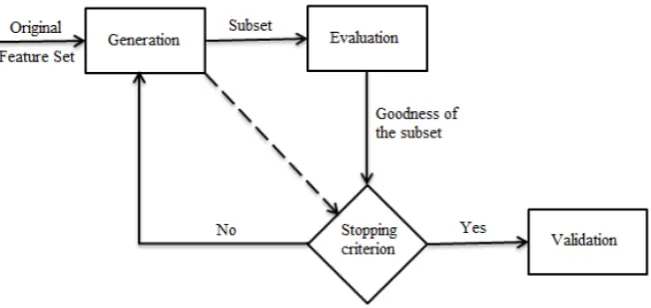
Liu, 1997). Moreover, Dash and Liu (1997) state thatthe
feature selection process in most commonly used methods is to select features based on Fig. 4.
In this study, since the large volume of input data has a negative effect on the classifier performance and causes complexity (Rahimi Ajdadi et al., 2016), instead of directly employing the 25 extracted features from the images, the used features were that which were selected out through employing the feature selection algorithms found in Waikato environment for knowledge analysis (WEKA) software. Obviously, choosing the appropriate features will have a profound effect on the good performance of the
clas-sifier. The WEKA software that was created at the Waikato
University of New Zealand is one of the most powerful
tools available for data mining, and WEKA has a variety of tools for implementing data mining algorithms. Among these are CfsSubsetEval, ChiSqaredAttributeEval, Classi- fierSubseEval and InfoGrainAttributeEval. As per current literature recommendation (Mollazade et al., 2012; Rahimi Ajdadi et al., 2016), we employed the CfsSubsetEval eva- luator. In this evaluator, the values of the parameters are assessed explicitly using correlation. In this method, the best subset of the feature is the features that have the highest correlation to predict the target attribute (class). However, the degree of correlation between the features in the subset is low, as the degree of the competency of these subsets is equal to the degree of correlation of the desired feature with existing features / degree of correlation of the desired attribute with the target feature (Hall, 1999). In addition, we utilized GreedyStepwise as a searching method (Rahimi Ajdadi et al., 2016).
Artificial neural networks (ANNs) are the extended approach to modeling complicated real-world problems by imitation of the structure and function of the human brain (Ebrahimi et al., 2014). Multi-layer perceptron (MLP) is one of the most prolific neural networks in classification. The MLP consists of three layers: input, hidden, and output (Mollazade et al., 2012). These depend on the number of input features, the complexity of the classification problem, and the number of output classes. In this study, for clas-sifying the inputs according to target classes, we applied a pattern recognition of pre-existing networks as used in the Neural Network Toolkit, the Matlab software R2014b ver-sion. Employing pre-existing networks as MLP networks can solve problems in a non-linear way. Such an approach consists of establishing a series of layers wherein the first layer is the connection of input networks. Each of the sub-sequent layers has a connection from the previous layer.
The final layer also creates the output of the network. The
topology is initially identified and the network is trained with input and output data. The goal of training is to mini-mize network error.
In our work, the input pattern has 11 feature vectors that were obtained during the data mining step to select the fea-ture. The network topologies were tested by selecting the number of hidden neurons in the network and by applying the scaled conjugate gradient (SCG) training algorithm. Furthermore, the samples were divided into three catego-ries: training, validation, and evaluation. These were of ratios of 60, 20%, and 20%, respectively.
A prediction model in machine learning is called a ‘de- cision tree’. This is a graph with a tree-like pattern sim-ilar to the data structure of the flow chart (Xue and Zhu, 2009). The decision tree is a tree in which the samples are classified in a way that grows from a root to a bottom and eventually, reaches the leaf nodes. Each inner or non-leaf node is characterized by a feature. This feature raises a ques- tion regarding the input example. In each inner node, with the number of possible answers to this question, there are
branches, each branch is determined by the quality or fit
-ness of that answer. The leaves of this tree are characterized by a class or a series of answers (Wu and Yen, 2009). In this present study, four different algorithms belonging to the tree data structure in the WEKA software were used to classify the wheat type into two classes: healthy and bug-damaged. These algorithms include the J.48 algorithm (Mollazade et al., 2012; Omid, 2011), REPTree (Mollazade
et al., 2012), NBTree and BFTree. About 70% of all input data was used for training, while 30% was used for testing.
In this study, for classifying healthy and bug-damaged wheat, discriminant analysis (DA) was used as a linear
sta-tistical classifier (Choudhary et al., 2009; Zapotoczny et
al., 2008). The goal in DA is to obtain a relationship that can determine the membership in the grouped variable. The decision is based on independent variables. In gen-erating a DA classifier, a function or a set of functions is constructed. For class k, a k-1 detection function is created.
The first function yields the best linear combination for pre
-dicting the group membership. Considering the existence of two classes of wheat (healthy and bug-damaged), in this research, only one discriminant function is generated for separating the two classes (healthy and bug-damaged). Assuming that all predictive variables have a normal dis-tribution and the changes in all groups are the same, DA on variables was performed using IBM SPSS Statistics 22 software.
The classifiers performance was evaluated by statistical criteria extracted from the values of the confusion matrix. The confusion matrix is a matrix that the classification
results show so that each matrix column contains a classifi
-er output, and each row contains real classes. The contours on the main diameter of the confusion matrix represent the correct predictions and the contours beyond the original diameter indicate the wrong predictions.
In this study, the statistical criteria of precision, sensiti-
vity, specificity and accuracy were calculated for evaluat
-ing the classifier (Omid, 2011; Rahimi Ajdadi et al., 2016).
The formulas related to these criteria are given in Eqs (2)-(5):
(2)
(3)
(4)
(5)
Since there were two classes in this study (healthy and bug damaged), the confusion matrix was obtained with a di- mension of 2 × 2. For example, the calculation of TP, TN,
FP and FN values for a healthy wheat class using the con-fusion matrix (C.M.) is shown in Eq. (6):
(6)
the number of the samples predicted to be healthy if they are really: TP – healthy; and FP – bug-damaged; the num-ber of the samples predicted to be bug-damaged if they are:
TN – really bug-damaged and FN – really healthy.
RESULTS AND DISCUSSION
Table 2 shows that among the 25 extracted features of the images, 11 features were selected as the most effective
features in the wheat type classification. Additional data
with no role in the classification were deleted, and the num
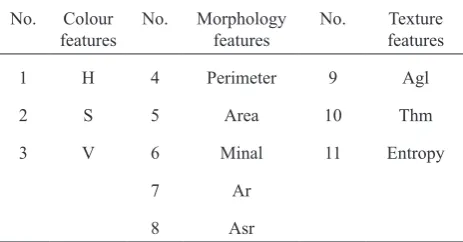
-ber of attributes, totaling 25, was reduced to 11. The results of selecting the features showed that the colour features of H, S, and V, the morphological features of perimeter, area, Minal, Ar and Asr, as well as the texture features of Agl, Thm and entropy can be effective in classifying the wheat type. Moreover, the morphological features have the most number of effective attributes in classification.
The neural network topology is an important factor in designing the ANNs, since the type of topology has a sig-nificant effect on the learning rate and the accuracy of the
network classification. The number of hidden layers and
the number of neurons are the main factors in designing the ANNs (Gnana Sheela and Deepa, 2013). The number of neurons in the input and output layers depends on the number of attributes vectors and the number of classes, respectively. The input layer consists of 11 neurons based on the feature selection operation. Since we needed to place the sample material into two classes (healthy and bug damaged wheat), the number of neurons in the output layer consisted of 2 neurons in which [0 1] was related to the healthy wheat class and [1 0] was related to the bug-damaged wheat class. Several combinations of the neurons number in the hidden layer were tested via trial and error (the varied number of neurons from 7 to 28). In order to determine the best
com-bination of classifiers in different topologies as generated through the statistical criteria (accuracy, sensitivity, speci- ficity, and accuracy) and as extracted from the values of the confusion matrix, the evaluation stage was investigated.
Table 3 shows the classification results of a neural network with different topologies. Among the number of classes classified into a particular category by the classifier, the statistical accuracy criterion determines the percentage of real percentage relevant to that class. As shown in Table 3, the precision varies in different topologies. Herein, the maximum precision was obtained in the topology of 11-19-2 with 87.11-19-26%, while the lowest precision is obtained in the topology of 11-13-2 with 80.18%. The sensitivity criterion indicates the percentage of the samples that are correctly detected as actually belonging to a particular class. The specificity criterion among the samples which are not related to a class determines the percentage that have been recognized correctly as false. According to Table 3, in terms of the sensitivity and specificity, the best classifier performance was in the topology of 11-19-2, with 87.46% and 87.46%, respectively. The degree of effectiveness of
classifier performance is categorized by the accuracy sta
-tistical criterion. This indicates the correct diagnosis of positive and negative cases. In the topologies of 11-19-2 and 11-13-2, the highest and lowest accuracy of the clas-sification were obtained with values of 87.46 and 79.76%, respectively. Thus topology 11-19-2 was the best neural network topology for categorizing the chosen wheat type into two classes (healthy and bug-damaged). This topology classified healthy and bug-damaged grains with a precision of 91.71 and 82.82%, respectively.
The results of the classification of wheat by J.48, REFTree, BFTree, and NBTree in the training phase are shown in Table 4. The criterion of the best performance is high correctly classified instances (CCI), low root mean squared error (RMSE) and mean absolute error (MAE). According to the results, the J.48 tree has the highest CCI (90.98) and the lowest values of RMSE (0.275) and MAE (0.1514) as compared to the other trees. Hence, this tree was chosen as the best classifier for classification.
According to the confusion matrix obtained from the test (Table 5), the precision of the J.48 tree classifier for classifying the healthy and bug-damaged grains was 94.16 and 86.25%, respectively. Totally, this system correctly
classified the healthy and bug-damaged grains with a pre
-cision of 90.20%. Furthermore, in classifying the wheat via
the J.48 tree, the mean sensitivity, specificity, and accuracy were 90.45, 90.45, and 90.20%, respectively (Table 5). The structure of this tree consists of 28 stems and 15 leaves, as shown in Fig. 5.
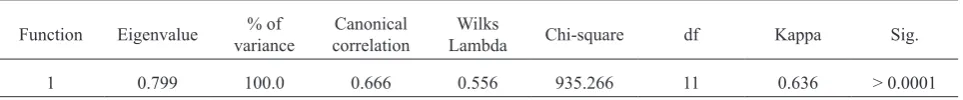
In the DA classifier, a linear function was used to clas
-sify the wheat grains into two qualitative groups (healthy and bug-damaged) via 11 selected features. In so doing, maximum Eigenvalue and minimum Wilks’ Lambda valu-es were obtained for the detection function (Table 6). The
T a b l e 2. Results of feature selection by the CfsSubsetEval method
No. Colour
features No. Morphology features No. featuresTexture
1 H 4 Perimeter 9 Agl
2 S 5 Area 10 Thm
3 V 6 Minal 11 Entropy
7 Ar
Eigenvalue is the ratio of the collected squares between groups, to the collected squares in the group, and indicates the power of the detection function. The more difference between the two groups with regard to the variation with-in the groups, the greater the power to differentiate will be. Table 6 shows that the resulting function is a function with an Eigenvalue of 0.799. In the DA classifier, after
the calculation of Eigenvalue, a significance test was per
-formed. Since the Wilks’ Lambda value (0.556) is smaller than 1, based on its significance level (Sig<0.001) and Chi-square (935.266), the obtained function can significantly T a b l e 3. Classification of ANN for healthy and bug-damaged wheat
ANN topology Class Statistical criterion
Precision (%) Sensitivity (%) Specificity (%) Accuracy (%)
11-7-2
Healthy 82.66 83.75 77.50
80.62
Bug-damaged 78.82 77.50 83.75
Average 80.74 80.62 80.62
11-10-2
Healthy 84.96 88.16 74.83
81.49
Bug-damaged 79.67 74.83 88.16
Average 82.31 81.49 81.49
11-13-2
Healthy 84.39 86.07 73.45
79.76
Bug-damaged 75.97 73.45 86.07
Average 80.18 79.76 79.76
11-16-2
Healthy 87.27 85.81 83.72
84.76
Bug-damaged 81.93 83.72 85.81
Average 84.16 84.76 84.76
11-19-2
Healthy 91.71 91.21 83.72
87.46
Bug-damaged 82.82 83.72 91.21
Average 87.26 87.46 87.46
11-22-2
Healthy 86.85 86.36 84.02
85.19
Bug-damaged 83.44 84.02 86.36
Average 85.14 85.19 85.19
11-25-2
Healthy 87.05 89.28 79.60
84.44
Bug-damaged 82.87 79.60 89.28
Average 84.96 84.44 84.44
11-28-2
Healthy 85.06 85.53 81.36
83.45
Bug-damaged 81.92 81.36 85.53
Average 83.49 83.45 83.45
T a b l e 4. Results of classification in the training stage with dif -ferent Dts
Tree type CCI RMSE MAE
J.48 90.98 0.275 0.1514
REFTree 86.60 0.326 0.2128
BFTree 87.41 0.318 0.204
differentiate between the two wheat groups. By subtract-ing 1 from the Wilks’ Lambda value, a number is obtained which shows the unexplained value of variance. However, about 0.45 of the variances of the two groups are explained by the selected features. Hence, the linear combination of the selected features can predict the group membership of two samples grains. In addition, the high level of canonical correlation (0.666) also indicates the greater desirability of the function for predicting healthy and bug-damaged grains. The kappa coefficient is then applied. This is a correlation coefficient that examines the classification agreement. The closer the coefficient is to 1, the more agreement exists within the categorization. However, when the kappa value is closer to 0, we see less agreement. In our work, with a value of 0.636 for the function, good agreement exists for this classification.
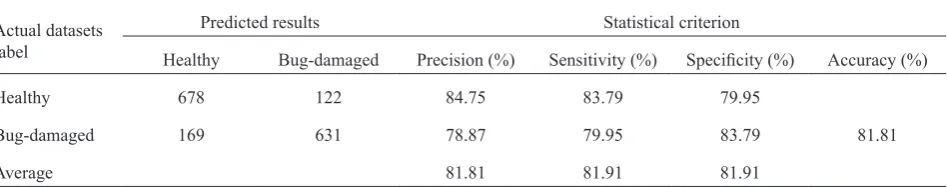
As shown in Table 7 and considering the obtained con-fusion matrix, the DA classifier function is able to precisely attribute 81.81% of the sampled grain to the related groups. This analysis classified the healthy and bug-damaged grains correctly with a precision of 84.75 and 87.87, respectively. Moreover, for classifying wheat via DA classifier, the mean sensitivity, specificity and accuracy were 81.91, 81.91 and 81.81, respectively.
According to the results for the three classifiers (ANN, DT and DA), the DT – with the J.48 algorithm showed the highest sensitivity (90.45%) when compared to the other classifiers. In addition, the sensitivity of this classifier in the class of healthy grains (93.66%) is higher than that of bug-damaged grains (87.25%), This means the J.48 algo-rithm classifies a lesser number of healthy grains incorrectly. Yet, in comparing the value of sensitivity, DA (with value of
T a b l e 5. Performance of the J.48 tree classifier in the testing stage for healthy and bug-damaged wheat grains
Actual datasets label
Predicted results Statistical criterion
Healthy Bug-damaged Precision (%) Sensitivity (%) Specificity (%) Accuracy (%)
Healthy 226 14 94.16 93.66 87.25
Bug-damaged 33 207 86.25 87.25 93.66 90.20
Average 90.20 90.45 90.45
T a b l e 6. Results of applying the DA classifier, as well as the values of the linear function components
Function Eigenvalue variance% of correlationCanonical LambdaWilks Chi-square df Kappa Sig.
1 0.799 100.0 0.666 0.556 935.266 11 0.636 > 0.0001
81.91%), is inferior to ANN (with value of 87.46%). Still, the specificity value of the J.48 tree is more than that of the ANN and DA classifiers. For example, the specificity of bug-damaged grains class is 93.66% for the J.48 tree, while for the ANN and DA classifiers, the comparable figure is 91.21 and 83.79%, respectively. In comparing the results of ANN and DA, we also found that ANN is superior to DA
in specificity. However, by comparing the accuracy crite
-rion of three classification methods, we observed that the accuracy of the DT classifier is more than that of the ANN
and DA classifiers (Fig. 6). Still, in comparing the preci
-sion of both the ANN and DA methods, it turns out that the precision of placement into the two classes via the ANN method is better than that of the DA method. In addition, the sensitivity, specificity, accuracy and precision of the related classes of healthy and bug-damaged wheat using the DA classification, show the weakness of this classification method for the data used in this study, when compared to DT and ANN. In general, by comparing each of the statis-tical criterion of the three classification methods, it can be concluded that the DT classifier has a better performance than that held by the other classifiers. In addition, DT has less error in predicting the class of wheat grains when uti-lizing the features that influence decision-making and the removal of additional features.
CONCLUSIONS
1. Among the three classifiers (artificial neural network,
decision tree and discriment analysis) decision tree with the -J.48 algorithm had the highest classification accuracy (a mean of 90.20% for healthy and bug-damaged wheat), and was able to categorize the sample wheat into healthy and bug-damaged with a precision of 94.16 and 86.25%, respectively.
2. Four different algorithms belonging to the tree data structure were used to classify the wheat type in two healthy and bug-damaged classes. The decision tree with the J.48 algorithm had the highest correctly classified instances value (90.98%).
3. The results of the classification of the artificial neural network with different topologies indicate that the topolo-gy of 11-19-2 had the maximum classification accuracy of
87.46%, while topology 11-13-2 had the minimum classifi
-cation accuracy of 79.76%.
4. The artificial neural network classifier with topolo-gy 11-19-2 and the discriment analysis classifier had
classification accuracies of 87.46 and 81.81%, respective
-ly. Therefore, the J.48 tree classifier acted better than did
the artificial neural network and discriment analysis classifiers.
Conflict of interest: The Authors do not declare
con-flict of interest.
REFERENCES
Arefi A., Modarres-Motlagh A., and Farrokhi-Teimourlou R.,
2011. Wheat class identification using computer vision sys -tem and artificial neural networks. Int. Agrophys., 25, 319-323.
ASAE, 2002. Standards S352.2, 2002. Moisture measurement - unground grain and seeds. ASAE, St. Joseph, MI, USA.
Choudhary R., Paliwal J., and Jayas D.S., 2008. Classification of cereal grains using wavelet, morphological, colour, and textural features of non-touching kernel images. Biosystems Eng., 99, 330-337.
Critchley B.R., 1998. Literature review of sunn pest Eurygaster integriceps Put. (Hemiptera, Scutelleridae). Crop Prot., 17, 271-287.
Dash M. and Liu H., 1997. Feature selection for classification. Interlligent Data Analysis, 1, 131-156.
T a b l e 7.Performance of the DA classifier for classifying healthy and bug-damaged wheat
Actual datasets label
Predicted results Statistical criterion
Healthy Bug-damaged Precision (%) Sensitivity (%) Specificity (%) Accuracy (%)
Healthy 678 122 84.75 83.79 79.95
Bug-damaged 169 631 78.87 79.95 83.79 81.81
Average 81.81 81.91 81.91
Ebrahimi E., Mollazade K., and Babaei S., 2014. Toward an automatic wheat purity measuring device: A machine vision-based neural networks-assisted imperialist competi-tive algorithm approach. Measurement, 55, 196-205.
Every D., 1990. Wheat-bug damage in New Zealand wheats: The feeding mechanism of Nysius huttoni and its effect on the morphological and physiological development of wheat. JSFA, 50, 297-309.
Gnana-Sheela K. and Deepa S.N., 2013. Review on Methods to fix number of hidden neurons in neural networks. Mathe-matical Problems Eng., 2013, 1-11, ID 425740.
Golpour I., Amiri-Pariani J., and Amiri-Chayjan R., 2014.
Identification and classification of bulk paddy, brown, and white rice cultivars with colour features extraction using image analysis and neural network. Czech J. Food Sci., 34(3), 280-287.
Gonzalez R.C., Woods R.E., and Eddins S.L., 2004. Digital Image Processing Using MATLAB. Prentice-Hall Press, USA.
Hall M.A., 1999. Correlation-based feature selection for machine learning. Ph.D. Thesis, University of Waikato, Hamilton, New Zealand.
Holmes G. and Nevill-Manning C.G., 1995. Feature selection via the discovery of simple classification rules. Proc. Symp. Intelligent Data Analysis, August 28-30, Baden-Baden, Germany.
Koller D. and Sahami M., 1996. Toward optimal feature selection. Proc. Int. Conf. Machine Learning, July 3-6, Bari, Italy.
Luo X., Jayas D.S., and Symons S.J., 1999. Identification of damaged kernels in wheat using a colour machine vision system. Cereal Sci., 30, 49-59.
Majumdar S. and Jayas D.S., 2000a. Classification of cereal grains using machine vision: I. Morphology models. Trans. ASAE, 43(6), 1669-1675.
Majumdar S. and Jayas D.S., 2000b. Classification of cereal grains using machine vision: III. Texture models. Trans. ASAE, 43(6), 1681-1687.
Mohsenin N.N., 1986. Physical Properties of Plant and Animal Materials. Gordon and Breach Science Publisher, New York.
Mollazade K., Omid M., and Arefi A., 2012. Comparing data mining classifiers for grading raisins based on visual fea -tures. IJCSE, 84, 124-131.
Najafi Mirak T., 2012. Resistance of wheat and triticale geno-types to sunn pest (Eurygaster integriceps Put.). Crop Breeding J., 2(1), 43-48.
Neelamma K.P., Virendra S.M., and Ravi M.Y., 2011. Color and texture based identification and classification of food grains using different color models and haralick features. IJCSE, 3, 3669-3680.
Omid M., 2011. Design of an expert system for sorting pistachio nuts through decision tree and fuzzy logic classifier. Expert Systems with Applications, 38, 4339-4347.
Otsu N., 1979. A threshold selection method from gray-level his-tograms. IEEE Trans. Systems, Man, and Cybernetics, 9(1), 62-66.
Paliwal J., Visen N.S., and Jayas D.S., 2001. Evaluation of neu-ral network architectures for cereal grain classification using morphological features. J. Agric. Eng. Res., 79(4), 361-370.
Rahimi-Ajdadi F., Abbaspour-Gilandeh Y., Mollazade K., and Poor-Hasanzadeh R., 2016. Application of machine vision for classification of soil aggregate size. Soil Till. Res., 162, 8-17.
Tischler W., 1939. Schaden und Bekampfung der getreides-chadlichen Blattwanzen. Arbeit Physiol Angew Entomol Berl Dahlem, 6, 14-32.
Vaccino P., Corbellini M., Reffo G., Zoccatelli G., Migliardi M., and Tavella L., 2006. Impact of Eurygaster Maura (Heteroptera: Scutelleridae) feeding on quality of bread wheat in relation to attack period. J. Economic Entomology, 99(3), 757-762.
Wu S.Y. and Yen E., 2009. Data mining-based intrusion detec-tors, Expert systems with applications: Int. J., 36(3), 5605-5612.
Xue M. and Zhu Ch., 2009. A study and application on machine learning of artificial intelligence. Int. Joint Conf. Artificial Intelligence, April 25-26, Hainan Island, China.
Zapotoczny P., Zielinska M., and Nitab M., 2008. Application of image analysis for the varietal classification of barley: Morphological features. J. Cereal Sci., 48,104-110.