University of New Orleans Theses and
Dissertations Dissertations and Theses
12-15-2007
Microstructural Investigations of the Layered Cathode Materials
Microstructural Investigations of the Layered Cathode Materials
LiCoO2 and LiNi1/3Mn1/3Co1/3O2
LiCoO2 and LiNi1/3Mn1/3Co1/3O2
Tanghong Yi
University of New Orleans
Follow this and additional works at: https://scholarworks.uno.edu/td
Recommended Citation Recommended Citation
Yi, Tanghong, "Microstructural Investigations of the Layered Cathode Materials LiCoO2 and LiNi1/3Mn1/ 3Co1/3O2" (2007). University of New Orleans Theses and Dissertations. 612.
https://scholarworks.uno.edu/td/612
This Thesis is protected by copyright and/or related rights. It has been brought to you by ScholarWorks@UNO with permission from the rights-holder(s). You are free to use this Thesis in any way that is permitted by the copyright and related rights legislation that applies to your use. For other uses you need to obtain permission from the rights-holder(s) directly, unless additional rights are indicated by a Creative Commons license in the record and/or on the work itself.
Microstructural Investigations of the Layered Cathode Materials LiCoO
2and
LiNi
1/3Mn
1/3Co
1/3O
2A Thesis
Submitted to the Graduate Faculty of the University of New Orleans in partial fulfillment of the requirements for the degree of
Master of Science in
Chemistry
by
Tanghong Yi
B.S. University of Science and Technology of China, 2005
ACKNOWLEDGEMENTS
First of all, I would like to express my sincere gratitude to my advisor, Professor Heike
Gabrisch. Heike’s enthusiasm and insights were constant inspirations during my course of study.
I am also very grateful for her friendly, patient guidance and assistance and her support.
My gratitude also goes to the members of my committee, Professor Weilie Zhou,
Professor John B. Wiley for their helpful comments and constructive suggestions.
I would like to give my special thanks to Professor Gerbrand Ceder in Massachusetts
Institute of Technology, and Professor Marca M. Doeff in Lawrence Berkeley National
Laboratory, who gave me generous help, let me study and work in their labs after the Hurricane
Katrina.
I would like to acknowledge past and present group members, Qingfeng Xing, Mary
Kombolias, Vaneet K. Sharma, James D. Wilcox, Juliette A.L. Saint, Guoying Chen, Xiaohua
Ma, Fei Zhou, Ying Shirley Meng, Kisuk Kang, for their personal and professional exchanges,
helps in my work, kindness and friendly environment.
Last, but not the least, great appreciation goes to my parents and elder sister for their
love, encouragement and support throughout my life.
This work was supported by the Louisiana Board of Regents through contact number
LEQSF (2004-07) –RD–A–36 and the Links Program (title: Investigation of the crystallographic
TABLE OF CONTENTS
LIST OF FIGURES ...v
LIST OF TABLES... vii
ABSTRACT... viii
INTRODUCTION ...1
CHAPTER 1 Investigation of LixCoO2 Phases Produced by Heat Treatment of Delithiated LiCoO2 Powders ...3
1.1 Abstract ...3
1.2 Introduction...3
1.3 Experimental details...6
1.4 Results and discussion ...8
1.4.1 Chemical and electrochemical delithiation...8
1.4.2 Heat treatment...13
1.4.3 TEM ...16
1.5 Conclusions...17
1.6 References...17
2.1 Abstract ...19
2.2 Introduction...20
2.3 Experiments ...23
2.4 Results...25
2.4.1 Pristine LiNi1/3Mn1/3Co1/3O2...25
2.4.1.1 Single crystals with R m3 space group...25
2.4.1.2 Polycrystalline crystals with R m3 space group...26
2.4.1.3 Superlattices...28
2.4.2 Cycled specimen at discharged state...31
2.5 Discussion...32
2.5.1 Morphology...32
2.5.2 Cations ordering...33
2.5.3 X-ray and neutron diffraction simulations...37
2.6 Conclusions...39
2.7 References...40
Appendix...42
Appendix A: unit cell of pile-up model ...42
Appendix B: unit cell of [ 3 3] 300 R × model with partial Li/Ni interchange...43
Appendix C: unit cell of O3 model with partial Li/Ni interchange ...43
LIST OF FIGURES
Figure 1.1 X-ray spectra of chemically delithiated specimens ...10
Figure 1.2 X-ray spectra of P3 and O1 phases from simulation...10
Figure 1.3 X-ray spectra of electrochemically delithiated products LixCoO2...11
Figure 1.4 c-lattice parameter as a function of lithium content of electrochemically delithiated specimens...12
Figure 1.5 Electrochemically delithiated products LixCoO2 (x = 1.0, 0.79, 0.64, 0.3) after heat treatment at 300°C for 1h...14
Figure 1.6 In situ hotstage X-ray spectra of chemically delithiated Li0.59CoO2 from Mary Kombolias ...15
Figure 1.7 In situ TEM of electrochemically delithiated Li0.26CoO2...17
Figure 2.1 Single crystal with R m3 symmetry...26
Figure 2.2 Image and diffraction patterns of a polycrystal...27
Figure 2.3 Images and SAED patterns of superlattices ...30
Figure 2.4 An electron diffraction pattern at [0001] zone axis showing superlattice reflecitons..31
Figure 2.5 X-ray diffraction spectrum of LiNi1/3Mn1/3Co1/3O2 charged to 5.2 V at discharged state ...32
Figure 2.6 Structures of LiNi1/3Mn1/3Co1/3O2 ...36
Figure 2.7 Simulated SAED patterns...37
Figure 2.9 Neutron diffraction spectra of LiNi1/3Mn1/3Co1/3O2 with R m3 and P3112 space group
LIST OF TABLES
Table 1.1 Chemically delithiated specimens using NO2BF4 as oxidant ...7
Table 1.2 Electrochemically delithiated specimens with coin cells ...7
Table 1.3 C-lattice parameters of electrochemically delithiated specimens...12
Table 2.1 Structural parameters used to simulate O3 phase of LiNi1/3Mn1/3Co1/3O2 ...24
ABSTRACT
Both LiCoO2 and LiNi1/3Mn1/3Co1/3O2 layered cathode materials are investigated in our
studies. P3 phase of CoO2, the end member of the LixCoO2, is found in both chemically and
electrochemically delithiated materials. Delithiated LixCoO2 specimens decompose into fine
Co3O4 and LiCoO2 particles starting at around 200 °C. This decomposing reaction is proved by
in-situ X-ray diffraction and in-situ transmission electron microscopy investigations. The
structures of pristine and cycled LiNi1/3Mn1/3Co1/3O2 are investigated by electron diffraction.
Single and polycrystalline crystals are found in this material. The partial substitution of Co by Ni
and Mn in LiNi1/3Mn1/3Co1/3O2 opens up the possibility of different cation configurations in the
crystal lattice. Both R m3 symmetry and superlattices are identified in this material. The number
of particles with superlattices in pristine material (40%) is much bigger than cycled material at
discharge state (10%).
Keywords: delithiation; phase transformation; LixCoO2; LiNi1/3Mn1/3Co1/3O2; X-ray diffraction;
INTRODUCTION
One of the hot topics and great challenges in the twenty-first century is unquestionably
energy storage. People are trying to find the economic, efficiency and environmentally friendly
energy conversion and storage systems responding to the needs of this world. Lithium ion
batteries are one of the great successes of energy conversion and storage systems. Lithium ion
batteries are the systems of choice, offering high energy density, flexible and lightweight design,
and longer lifespan than comparable battery technologies. A historical account of the
development of lithium ion batteries is about 30 years, counting from the first Li cell in 1970s.
Nowadays, Lithium ion batteries play an important role in the portable devices, for example, cell
phones, laptop computers, MP3 players like iPOD, and in larger application such as hybrid
electric vehicles (HEV). Three main parts, anodes, electrolytes and cathodes make up the lithium
ion batteries. The choice of the active material for the cathode determines the properties of the
rechargeable battery. The structures that have received the most attention as possible positive
electrode materials are spinel, α-NaFeO2 –type layered, and orthorhombic structures. Layered
structure cathode materials are attractive for researchers since they are easy for the movement of
lithium ions during intercalation-deintercalation processes.
LiCoO2 is the most common layered structure material used in commercial lithium ion
batteries. The theoretical capacity of LiCoO2 is 280 mAhg-1, of which 140 mAhg-1 is in general
achieved due to the non-stability of Li1-xCoO2 (0.5 < x < 1). LiCoO2 has good cycling
performance and high upper cut-off voltage 4.2 V. On the other hand, the phase transitions of
content Li1-xCoO2 in the range of 0.5 < x < 1. In order to make those unsettled questions clear,
we studied the lattice parameter changes and phase transitions with lithium contents in both
chemically and electrochemically delithiated specimens Li1-xCoO2, and the phase transitions of
delithiated Li1-xCoO2 as a function of temperatures. Both X-ray diffraction (XRD) and
transmission electron microscopy (TEM) are employed to the phase characterization.
LiNi1/3Mn1/3Co1/3O2, is a new development based on LiCoO2, with potential for
applications in high power applications. Some of the disadvantages of LiCoO2, e.g.
environmental hazard and a high price are compensated in LiNi1/3Mn1/3Co1/3O2.
LiNi1/3Mn1/3Co1/3O2 shows higher reversible capacity and thermal stability as well as lower cost
than LiCoO2. However, a low rate capability of the LiNi1/3Mn1/3Co1/3O2 has to be solved before
commercialized in the lithium secondary battery. The structure of LiNi1/3Mn1/3Co1/3O2 is not as
simple as LiCoO2 with R m3 symmetry. The distribution of three transition metals determines
the structure of LiNi1/3Mn1/3Co1/3O2. The random Ni, Mn, and Co distribution in 3a positions in
transition metal layer results inR m3 . The supercells are the common phenomena for
LiNi1/3Mn1/3Co1/3O2. [ 3× 3] 30R 0-type (space group P3112) in triangular lattice of sites and
pile-up model (space group P3m1) among CoO2, NiO2 and MnO2 slabs are two superlattice
models investigated using first principles calculations. In the second chapter of this thesis, we
presented the experiments results of XRD and TEM characterizations of virgin
CHAPTER 1
Investigation of LixCoO2 Phases Produced by Heat Treatment of Delithiated
LiCoO2 Powders
1.1 Abstract:
LiCoO2 is used as a cathode material in most commercial lithium-ion batteries. Of the
phases formed upon Li-removal the P3 phase has been only reported in the chemically
delithiated materials. In this paper we compare the microstructure of LixCoO2 produced by
chemical and electrochemical methods. P3 phase was found in both chemically (x = 0.59 for
NO2BF4 oxidant) and electrochemically (x = 0.30) delithiated specimens. We investigate the
phases formed in in-situ heating by X-ray diffraction and electron microscopy. Above
approximate by 200°C LixCoO2 decomposed into fine Co3O4 and LiCoO2 particles.
Key words: delithiation; heat treatment; phase transformation; LixCoO2; X-ray diffraction;
Transmission electron microscopy
1.2 Introduction
Lithium ion batteries play an important role as power source in portable electronic
devices. Currently LiCoO2 is the most used active cathode material for commercial lithium ion
batteries. It has been first suggested as intercalation compound for rechargeable Li-ion batteries
by Mizushima et al..1 Depending on synthesis temperature two crystallographic forms of LiCoO 2
to a trigonal layered lattice around 900°C (space group 166, R m3 also called hexagonal form).
E. Rossen et al. compared the electrochemical performance of the cubic spinel form to that of the
trigonal form and showed that the high temperature layered form has superior electrochemical
properties.2 The unit cell of the layered form consists of three slabs of edge sharing CoO6
octahedra separated by interstitial layers of Li (O3 phase). With removal of Li from the layered
crystal lattice during charge non stoichiometric LixCoO2 compounds are formed that take on
different crystallographic structures depending on Li-content. Structural consideration limit the
amount of Li removed from the trigonal lattice to 0.5 which limits the achievable capacity to
140mA/g compared to the theoretical capacity of 270mAh/g. Many groups have studied the
crystallographic changes that accompany variations in Li content. Reimers and Dahn carried out
in-situ xrd experiments during charge of a coin cell and made the following observations: Upon
Li-removal at a Li concentration of about Li = 0.93 a second hexagonal phase forms in addition
to the original O3 phase. Between Li = 0.75 and Li = 0.93 the two hexagonal phases coexist
while below Li = 0.75 only phase II is stable. Around a Li content of approximately 0.5 ordering
of Li-vacancies leads to a monoclinic distortion of the lattice.3 In a separate study by Ohzuku
and Ueda found the same phases at slightly different Li-concentrations.4 When all Li is removed
from the lattice the edge sharing CoO6 octahedra form a single layered unit cell called O1 phase
that converts back to the original O3 phase with Li-reintercalation.5 Theoretical and
experimental studies have shown that more phases exist in the LixCoO2 system: at low Li
concentrations < 0.3 a mixture of O3 and O1 is observed (H1-3) phase that has been predicted
by Van der Ven et al.6 and experimentally observed by Chen et al..7 Recently X.Q. Yang et al.
reported new phases named by H2a as intermediate phase between H1 and H2 phases, and phase
the phase diagram is made up by six single-phase regions (O3, H2a, M1, H1-3, M2, and O1) and
two two-phase regions (O3 + H1-3 region for 0.78 < x < 0.9 and H1-3 + M2 region for 0.15 < x
< 0.25). Studies by transmission electron diffraction revealed a phase transformation from the
trigonal layered LiCoO2 to a lithium depleted phase with the structure of a cubic spinel Li
2-xCo2O4 in samples of LiCoO2 subjected to a high number of charge/discharge cycles indicating
that the stable crystal structure depends on Li content.9,10
The volume of unit cell and lattice parameters of LixCoO2 change with the lithium
content. The c-lattice parameter increases up to a maximum around x equal to 0.5 followed by a
decrease with further reduction in lithium content. The a-lattice parameter decreases slightly first
and increases when x is less then 0.5. The changes of a-lattice parameter and c-lattice parameter
oppose each other resulting in no big change of the volume of unit cell. This phenomenon was
observed in both experiments4 and simulations6.
S. Venkatraman used chemical delithiation to study the crystal lattices formed with Li
depletion. He showed that at high delithiation rates which are typical for chemical delithiation a
metastable P3-type CoO2-δ is formed that over time will transform into the stable O1 phase.11
Here we study the changes of unit cell dimensions and phases transformations with
lithium removed from LiCoO2. In order to identify the crystallographically stable phases
corresponding to a composition LixCoO2 we produce delithiated specimens and heat the powders
to high temperatures. Characterization by x-ray diffraction indicates that P3 phase forms in both
electrochemical and chemical delithiation. After heating the electrochemically delithiated
powders to approximately 300°C for a short time (1 h) the P3 phase disappears and instead small
amounts of Co3O4 are observed. In-situ electron microscopy and in-situ XRD indicate that
1.3 Experimental details
LiCoO2 used for coin cells and chemical delithiation was bought from Aldrich
(purity>99.8%). The chemical delithiation was carried out using a solution of NO2BF4 in
acetonitrile (CH3CN). The delithiation reaction can be described by the equation LiCoO2 + x
NO2BF4 Æ Li1-xCoO2 + x NO2 + x LiBF4. Different lithium contents x in LixCoO2 are realized
by adjusting the ratio of virgin LiCoO2 to oxidant NO2BF4. 0.01 mole of LiCoO2 and the proper
amount of oxidant NO2BF4 were added into 20 mL CH3CN solvent. Details are given in table
1.1. The solutions were stirred at room temperature for 3 hours.
The coin cells (CR2032) used for electrochemical delithiation were made of Li|1 M
LiPF6(EC:DMC = 1:1)|LiCoO2 where EC and EMC stand for ethylene carbonate and dimethyl
carbonate, respectively. The cathode mixtures contained 84 wt % active material LiCoO2, 8 wt%
SFG-6 synthetic flake graphite (Timcal, Ltd., Graphites and Technologies), and 8 wt % Kynar
poly (vinylidene difluoride) (PVDF) binder, which was added as a 12 wt % solution ( 12 wt %
Kynar and 88 wt % 1-methyl-2-pyrrolidone (NMP)). The paste was spread onto aluminum foil
homogenously. The electrodes were dried overnight in air at ambient temperature and then in a
vacuum oven at 120°C for 24 h. The electrodes were roll-pressed prior to use. The cells
underwent 3 formation cycles between 3.0 and 4.2 V at the current corresponding to a charge
rate of C/20 in galvanostatical channels of a Macpile II (Bio-Logic, SA, Claix, France). Then the
cells were charged to different states at the current corresponding to a charge rate of 1C.12 Table
1.2 gives a list of nominal compositions LixCoO2 corresponding to the states of charge of each
coin cell. The cells were disassembled immediately after the charging process, and washed with
diethyl carbonate (DEC) to remove LiF from cathodes. For the electrochemically delithiated
Table 1.1: Chemically delithiated specimens using NO2BF4 as oxidant.
LiCoO2 : NO2BF4 ICP results
1 : 2 Li0.59CoO2
1 : 1 Li0.87CoO2
1 : 0.75 Li0.83CoO2
Table 1.2: Electrochemically delithiated specimens with coin cells.
Charged voltage LixCoO2 Heating
4.1 V Li0.79CoO2
4.2 V Li0.64CoO2
4.5 V Li0.49CoO2
Group 1
4.8 V Li0.30CoO2
300 °C 1 h
4.1 V Li0.69CoO2
4.5 V Li0.42CoO2
Group 2
4.8 V Li0.26CoO2
none
The electrochemical delithiated powders were aged in air for one hour at 300°C.
Additionally in situ X-ray diffraction was applied to the chemically delithited specimen
Li0.59CoO2 between 25°C and 325°C. This specimen Li0.59CoO2 was synthesized by Mary
Kombolias with K2S2O8 as oxidant.13 The heating rate was 4 °C /min, and spectra were taken
during relaxing periods.
X-ray diffraction (XRD) spectra were taken with a Philips X’-Pert diffractometer using
accuracy in peak position determinations when it was necessary. Subsequently the materials
were scraped off from the aluminum foil and washed with NMP and dried in a vacuum oven at
ambient temperature. These powders were used for transmission electron microscopy (TEM) and
ex-situ and in-situ heat treatment. Characterization by electron microscopy was carried out on a
JEOL 3010 at Lawrence Berkeley National Laboratory.
The composition of chemically delithiated LixCoO2 powders was measured by
Inductively Coupled Plasma atomic emission spectroscopy (ICP-AES). Cobalt and lithium
ICP/DCP standard solutions were bought from Sigma Aldrich. 100 mg of each the specimen
LixCoO2 was dissolved into 10 mL of high purity hydrocholoric acid (Alfa Aesar, 99.999999%
metals basis) and then diluted to 250 mL before analysis in the ICP.
1.4 Results and discussion
1.4.1 Chemical and electrochemical delithiation
The XRD spectra of delithiated powders were compared in Figs. 1.1and 1.3. For both
delithiation methods a small peak was observed to the right of the (003) peak of the O3 phase at
low Li contents. The comparison of P3 and O1 XRD spectra was shown in Fig. 1.2. These two
XRD spectra were simulated using PowderCell. Fig.1.1 showed the spectra of delithiated
specimens from NO2BF4 oxidant. One obvious and also important difference of the XRD
spectrum for Li0.59CoO2 comparing with others was the small peak close to (003) peak of O3
phase. This small peak was identified as (003) peak of P3 phase (CoO2). P3 phase was also seen
in Li0.3CoO2 produced by electrochemical delithiation, see Fig. 1.3. From the ratio of intensities,
Rietveld refinement of the experimental spectra considering a combination of O1 and O3
phase compared to a combination of P3 and O3 phase showed that this peak was best explained
by presence of P3 phase. Furthermore, there are two easy way to exclude the possible phase of
O1. First, the 2 theta of (001) peak of O1 phase is more than 20°, which does not match our
observations. Secondly, the X-ray spectrum of O1 has two strong peaks (001) and (101) with
almost equal intensity. However, there is no observation of additional small peak at the 2 theta
position of (101) peak. The finding of a combination of O3 and P3 phase indicates that the
extraction of lithium ions was not homogenous. Some parts of the particles or some particles lost
all lithium ions to form CoO2 (P3 phase), while the lithium content remained higher in other
particles or areas of particles. Considering that lithium ions were removed from the surface of
particles one could imagine that a gradient formed with a lower lithium content on the particle
surface than in the core of particles. P3 phase should then be found predominantly on the surface
of particles. We found P3 phase not only in chemically delithiated specimens but also in
electrochemically delithiated LixCoO2. As A. Manthiram reported, the metastable P3-type CoO
2-δ came from high delithiated rate by chemical delithiation.11 That is why people only found out
the stable O1 phase by electrochemical delithiation. However, the charge rate used in our study
to fabricate delithiated specimens was very high with current corresponding to the charge rate of
1C. This should be the reason that we can achieve P3 phase in electrochemically delithiated
10 20 30 40 50 60 70 80 (1 07 ) (11 0) (0 18 ) (10 4) (1 01 ) (0 03 ) Si Si Si x=0.59 x=0.83
Intensity (a.u.)
2
θ
x=0.87 Si P3Fig.1.1: X-ray spectra of chemically delithiated specimens (x = 0.87, 0.83, 0.59).
10 20 30 40 50 60 70 80
(01 2 ) (101) (10 0 ) (0 01) (0 15) (1 04) (006 ) (012) (101) (00 3 ) P3 In tensity (a.u.) 2θ O1
10 20 30 40 50 60 70
(1
1
0
)
(0
18)
(107)
(104
)
(101)
(0
03)
Intensity (a. u.)
2θ
C
Al
x=1.0 x=0.79 x=0.64 x=0.49 x=0.30
P3
Fig.1.3: X-ray spectra of electrochemically delithiated products LixCoO2 (x = 1.0, 0.79,
0.64, 0.49, 0.3).
Table 1.3 is showing the c-lattice parameters of a series of electrochemically delithiated
specimens by coin cells from commercial LiCoO2. Fig. 1.4 is the corresponding figure of
c-lattice parameter changing as a function of lithium content x in LixCoO2. The c-lattice parameter
initially increased from 14.040 Å up to 14.373 Å when the lithium content decreased from 1 to
0.49. As lithium concentration was lowered further, the c-lattice parameter started to decrease
Table 1.3: c-lattice parameters of electrochemically delithiated specimens.
LixCoO2 (003) c para./Å
X = 1.0 18.948 14.040
X = 0.79 18.936 14.048
X = 0.69 18.783 14.161
X = 0.64 18.603 14.297
X = 0.49 18.504 14.373
X = 0.42 18.511 14.367
X = 0.30 18.579 14.316
X = 0.26 18.664 14.251
0.0 0.2 0.4 0.6 0.8 1.0
13.6 13.8 14.0 14.2 14.4 14.6 14.8 15.0
c lat
ti
ce
(
A
n
g
s
tr
o
m)
x in LixCoO2
1.4.2 Heat treatment
Heat treatment has been carried out to determine the stable structure for a given
composition. By heating specimens we allowed them to attain their thermodynamic stable forms.
The xrd spectra obtained from the electrochemically delithiated specimens after heating to
300°C are shown in Fig. 1.5. The delithiated products LixCoO2 decompose to LiCoO2 and Co3O4
after heat treatment, and the LixCoO2 and P3 phases disappear. The intensity of peaks from
Co3O4 (marked by an asterisk) is low compared to the intensity of the O3 peaks. However, the
difference between the x-ray spectra of specimens before and after heat treatment is clear. The
shoulders of (101) and (107) peaks of LiCoO2 are the (311) and (511) peaks of Co3O4 (Fig. 1.5).
Comparing the intensity ratio of (018) and (110) LiCoO2 peaks in Fig. 1.3 to those in Fig. 1.5 we
see that in Fig. 1.5 the (440) Co3O4 peak appears which overlaps with LiCoO2 (018). The (220)
peak of Co3O4 can be clearly seen in Fig. 1.5. Peak broadening is caused by the overlap of the
(311), (511) and (440) peaks of Co3O4 with (101), (107) and (018) peaks of LiCoO2 (Fig. 1.5).
The similar results were found in chemically dethiated specimens with K2S2O8 as oxidant by
10 20 30 40 50 60 70 11 0 01 8 10 7 10 1 00 3 (511) * (4 4 0 ) (3 11) (2 2 0 ) Intensity (a.u.) 2θ C Al x=0.79 x=0.64 x=0.49 x=0.30 * * *
Fig.1.5: Electrochemically delithiated products LixCoO2 (x = 1.0, 0.79, 0.64, 0.49, 0.3)
after heat treatment at 300°C for 1 h.
In situ x-ray diffraction was carried out in the temperature range between 25°C and
325°C for the chemically delithiated sample Li0.59CoO2. In Fig. 1.6 the xrd scans taken during
heating and cooling are shown in one diagram. Parts of the spectrum showing the (003) LiCoO2
peak and the (220) Co3O4 peak are enlarged and shown to the left and right of the main spectrum
respectively. Some of the features observed during heating and cooling are artifacts caused by
changes in the instrument (thermal expansion of sample holder) during heating. These are a
continuous shift of the whole spectrum to the left during heating and to the right during cooling.
Additionally, the intensity of all peaks also went up and down with temperature.
Disregarding these artifacts two specimen related features were observed during heating:
• (220) and (311) peaks of Co3O4 appear in x-ray spectra starting at 225°C.
The decomposition of LixCoO2 into Co3O4 and LiCoO2 starts before 225°C as indicated by the
formation of a small (111) Co3O4 peak on the right side of the (003) peak of LixCoO2 at 225°C.
This temperature is believed to decrease with lithium content in LixCoO2 since the stability of
LixCoO2 decreases with lithium content. The intensity of the newly formed Co3O4 peaks
increases with temperature. Besides the contribution of the thermal expansion of the system,
another reason is that the reaction of LixCoO2 ÆLiCoO2 +Co3O4 continuous with heating time
and temperature. This reaction is irreversible. Upon cooling to 25℃ the intensity of all peaks
decreases due to the thermal expansion of the system. The enlarged section of the two theta
range between 28-32° clearly shows that the thermal expansion of the system did us a favor by
increasing the intensity of the weak Co3O4 (220) peak, which would have been hard to identify
after cooling back to room temperature.
20 25 30 35 40 45
(311 ) Intensity ( a . u.) Cool ing Heat ing 2θ 25C 75C 125C 175C 225C 275C 325C 275C 225C 175C 125C 75C 25C 28 32 (2 20) 2θ
18 19 20
(111)
00
3
2θ
Fig. 1.6: In situ hotstage x-ray spectra of chemically delithiated Li0.59CoO2 synthesized by
1.4.3 TEM
In-situ heating TEM is performed on the electrochemically delithiated specimen
Li0.26CoO2. Analysis of the diffraction patterns could be explained by the decomposition of
LixCoO2 into small particles of Co3O4 and LiCoO2 during the heat treatment. These small
particles are distributed homogeneously in the matrix of the original LixCoO2 particles. In Fig.
1.7 selected area electron diffraction patterns (SAD) and images taken over a time period of 2
hours at temperatures between 21°C and 300°C (nominal heating holder read out) are shown.
Fig. 1.7a shows the single crystalline diffraction pattern of the starting phase Li0.26CoO2. At
around 215°C and after 1h, the diffraction spots are smeared out and a ring pattern starts to
appear (Fig. 1.7b). With time and temperature the ring pattern becomes more defined as can be
seen in Fig. 1.7c taken after heating to 315°C and a total heating time of 2h. The diffraction ring
pattern in Fig.1.7c indicates that many fine particles of Co3O4 and LiCoO2 are formed, as can be
seen from a comparison of the continuous rings to a indexed ring pattern for LiCoO2 and Co3O4
(Fig 1.7d). There is no obvious change of the diffraction pattern when the specimen was cooled
down to room temperature. This indicates that the reaction LixCoO2 ÆLiCoO2 +Co3O4 is
irreversible. A comparison between Figs. 1.7e and 1.7f, shows that the morphology distribution
of small particles Co3O4 and LiCoO2 particles has changed: After 2 hours of heating, more white
b
e f
(110)
a c
Co3O4(511)
Co3O4 (311)
LiCoO2 (003)
Co3O4(220)
LiCoO2 (104)
LiCoO2(110)/Co3O4 (440)
d
Fig. 1.7: In situ TEM of electrochemically delithated Li0.26CoO2. a. SAD at starting; b. SAD
at 210°C after 1 h; c. SAD at 315°C after 2 hs. heating; d. index of SAD pattern c; e. image at starting; f. image at 315°C after 2 hs.
1.5 Conclusions
Up to now the P3 phase has only been reported after liquid chemical delithiation taking
place at high charge rates. Here we found the P3 phase both in LixCoO2 prepared chemical
delithiation and by electrochemical delithiation at a high charge rate of 1C, which confirms the
effect of the charge rate onto the microstructure. Heating experiments showed that LixCoO2
decomposes irreversibly into fine particles of LiCoO2 and Co3O4 at the temperature above
approximate 200 ºC. The SAD patterns confirmed this decomposed reaction, and presented the
process and morphology changes.
1.6 Reference
(1) Mizushima, K.; Jones, P. C.; Wiseman, P. J.; Goodenough, J. B. Materials Research Bulletin
1980, 15, 783-789.
(3) Reimers, J. N.; Dahn, J. R. J. Electrochem. Soc.1992, 139, 2091-2097.
(4) Ohzuku, T.; Ueda, A. J. Electrochem. Soc.1994, 141, 2972-2977.
(5) Amatucci, G. G.; Tarascon, J. M.; Klein, L. C. J. electrochem. soc.1996, 143, 1114-1123.
(6) Ven, A. V. D.; Aydinol, M. K.; Ceder, G. Physical Review B1998, 58, 2975-2987.
(7) Chen, Z.; Lu, Z.; Dahn, J. R. J. electrochem. soc.2002, 149, A1604-A1609.
(8) Yang, X. Q.; Sun, X.; Mcbreen, J. electrochemistry communications2000, 2, 100-103.
(9) Gabrisch, H.; Yazami, R.; Fultz, B. J. Power Sources2003, 119-121, 674-679.
(10) Gabrisch, H.; Yazami, R.; Fultz, B. J. electrochem. soc.2004, 151, A891-A897.
(11) Venkatraman, S.; Manthiram, A. Chem. Mater.2002, 14, 3907-3912.
(12) Doeff, M. M.; Hollingsworth, J.; Shim, J.; Lee, Y. J.; Striebel, K.; Reimer, J. A.; Cairns, E. J. J. Electrochem. Soc.2003, 150, A1060-A1066.
CHAPTER 2
Investigation of Cation Ordering in LiNi1/3Mn1/3Co1/3O2 by Electron
Diffraction Analysis
2.1 Abstract
LiNi1/3Mn1/3Co1/3O2 is a promising new cathode material for potential applications in
high power rechargeable batteries. It has a trigonal lattice of R m3 symmetry, similar to that
LiCoO2 used in commercial batteres. The partial substitution of Co by Ni and Mn in
LiNi1/3Mn1/3Co1/3O2 opens up the possibility of different cation configurations in the crystal
lattice. The nickel, manganese and cobalt ions of LiNi1/3Mn1/3Co1/3O2 can be randomly
distributed in the transition metal layers. Alternatively superstructures can be formed by ordering
of Ni, Mn, and Co ions in the transition metal layer or by an interchange between Li and Ni ions.
Selected area electron diffraction patterns were collected from pristine LiNi1/3Mn1/3Co1/3O2 and
from LiNi1/3Mn1/3Co1/3O2 charged to 5.2 V that was disassembled in the discharged state. We
found that the LiNi1/3Mn1/3Co1/3O2 investigated here (ENAX, Inc.) is inhomogeneous with
respect to morphology and cation ordering. 15 randomly selected particles of the pristine
material were investigated by electron diffraction. The selection contains single crystalline
(66.7%) and polycrystalline particles (33.3%). In six out the 15 particles (40%) we observe
superlattice reflections. After charging to a high voltage of 5.2 V followed by discharge, we
patterns containing superlattice reflections can be explained by 3aHex× 3aHex×cHex supercell
with P3112 symmetry.
Keywords: LiNi1/3Mn1/3Co1/3O2; electron diffraction pattern; superlattice.
2.2 Introduction
Lithium-ion batteries offer high energy density compared to other rechargeable systems.
They have become an attractive and important energy storage source for portable electronic
devices as demand for mobile power sources increases. Lithium cobalt oxide (LiCoO2) has
played an important role in the family of lithium-ion batteries since it has been first reported by
Goodenough.1 Recently, layered lithium nickel manganese oxides (LiNi0.5Mn0.5O2) and
LiNi1/3Mn1/3Co1/3O2 have been considered as promising, inexpensive, and nontoxic intercalation
compounds for the positive electrode replacing LiCoO2. A capacity of 200 mAhg-1 has routinely
been achieved at low rates in LiNi0.5Mn0.5O2 based cathodes when the cells were operated at
2.5-4.5V.2-5 This is higher than the practical capacity of 150 mAhg-1 for LiCoO2, though both have
almost the same theoretical capacity of 280 mAhg-1. High ordered LiNi0.5Mn0.5O2 with excellent
electrochemical properties, compared to LiNi0.5Mn0.5O2 produced by the solid-state method can
be produced by an ion-exchange method.6 Both theoretical and experimental studies have been
performed to understand the crystal structure,7,8 cation ordering,9,10 and phase transitions of
LixNi0.5Mn0.5O2,11 and the effect of high voltage charging on the structure and electrochemistry
of LiNi0.5Mn0.5O2.12 LiNi1/3Mn1/3Co1/3O2, which was first proposed by Ohzuku and Makimura,13
has attracted a great deal of interest as a possible replacement for LiCoO2. The advantages of
LiNi1/3Mn1/3Co1/3O2 over LiCoO2 include excellent rate capability, superb cycling performance,
˚C, while in LiNi1/3Mn1/3Co1/3O2 the exothermic peak is observed at a temperature above 270 ˚C
using DSC.14 The better thermal stability of LiNi1/3Mn1/3Co1/3O2 makes it safer than LiCoO2 in
applications. The chemical and structural behavior of LiNi1/3Mn1/3Co1/3O2 is superior to that of
LiCoO2. The Li1-xNi1/3Mn1/3Co1/3O2 system is chemically stable for (1-x) > 0.35 without oxygen
loss and structurally stable for (1-x) > 0.23 by maintaining O3 structure.15 For comparison
LixCoO2 is stable in the lithium content range 1 < x < 0.5.16 17 There is no big difference in
theoretical capacity between LiNi1/3Mn1/3Co1/3O2 and LiCoO2/LiNi0.5Mn0.5O2. However,
LiNi1/3Mn1/3Co1/3O2 has the higher practical rechargeable capacity than others. The practical
rechargeable capacity of LiNi1/3Mn1/3Co1/3O2 is 160 mAhg-1 in the potential window of 2.5-4.4 V
and more than 200 mAhg-1 in the voltage range of 2.8-4.6 V.18,19 4.3 V was reported to be a
proper upper cutoff voltage for LiNi1/3Mn1/3Co1/3O2 cathode material. The capacity faded
obviously when cells with LiNi1/3Mn1/3Co1/3O2 cathodes were charged to voltages higher than
4.3 V.19 According to first principle calculations, LiNi1/3Mn1/3Co1/3O2 is not a solid solution of
LiCoO2, LiNiO2 and LiMnO2 because both LiCoO2 and LiNiO2 are immiscible with LiMnO2.20
The formal charges of Co, Ni, and Mn in LiNi1/3Mn1/3Co1/3O2 are +3, +2, and +4, respectively,
investigated by first-principles calculation,21,22 solid-state nuclear magnetic resonance (NMR),
and X-ray absorption spectroscopy (XAS).23,24 The charge compensation during charge of the
battery is achieved by oxidation of Ni2+/Ni4+ and Co3+/Co4+ as well as in the oxygen site.
Manganese ions remain mostly unchanged in the Mn4+ state. The crystal structure of
LiNi1/3Mn1/3Co1/3O2 can be described by the hexagonal α-NaFeO2 structure with R m3
symmetry. Different synthesis conditions were employed to fabricate LiNi1/3Mn1/3Co1/3O2, such
as hydroxide co-precipitation method and various annealed temperatures, and effects of synthesis
LiNi1/3Mn1/3Co1/3O2 compounds with lithium-excess or Li vacancies have also been investigated
in an attempt to improve the electrochemical properties30,31 and to understand the de-intercalation
mechanism.32 Electrochemical performance and cycling behavior were improved by adding LiF
to the active material,33,34 by metal oxide coating, 35 and even mixing LiCoO2/
LiNi1/3Mn1/3Co1/3O2 as active cathode material.36
Superstructures within the parent phase space group of R m3 have been reported for
LiNi0.5Mn0.5O2 and LiNi1/3Mn1/3Co1/3O2.8-12 The crystal and the electronic structures of
LiNi1/3Mn1/3Co1/3O2 have been investigated by theoretical and experimental methods in order to
understand the formation of superstructures.15,20-24,37 The replacement of cobalt by two transition
metal species in LiNi1/3Mn1/3Co1/3O2 opens the possibility for different elemental distributions of
cations among the available lattice sites. Assuming a cation distribution with maximum distance
between ions of the same species a [ 3 3] 300
R
× model can be developed for in plane
ordering. Alternatively a pile-up model has been considered in which Co, Mn and Ni occupy
separate TM layers.21,22 The lattice parameters of LiNi1/3Mn1/3Co1/3O2 from calculations (a =
2.831 Å, c = 13.88 Å for [ 3 3] 300
R
× model; a = 2.827 Å, c = 13.94 Å for piled-up model) are
smaller than those determined from experiments (a = 2.867 Å, c = 14.246 Å).13,22 Theoretical
calculations based on the application of local spin density approximation (LSDA) showed that
the formation energy for the [ 3 3] 300
R
× model is -0.17 eV, compared to +0.06 eV for the
piled-up model in. Therefore, the [ 3 3] 300
R
× model is a preferable superlattice to form
during processing of LiNi1/3Mn1/3Co1/3O2. Local atomic characterization of LiNi1/3Mn1/3Co1/3O2
by x-ray absorption fine structure (XAFS) measurements showed results in good agreement with
the superlattice model of [ 3 3] 300
R
random distribution of Mn, Ni, and Co over the 3a sites in the R m3 structure based on neutron
and anomalous dispersion powder diffraction results.37 No experimental evidence of a
superlattice was presented in that paper.
Here we use electron diffraction in transmission electron microscopy (TEM) to study the
crystal structure of LiNi1/3Mn1/3Co1/3O2 particles. Both virgin and cycled LiNi1/3Mn1/3Co1/3O2
specimens were investigated. The cycled specimen was charged to 5.2 V and then discharged in
order to understand the effect of charging to high voltage on the material structure. Our results
show that the material is inhomogeneous. It consists of single and polycrystalline particles. In
samples from the pristine and the charged/discharged cathode we find a difference in the fraction
of crystal lattices with cation ordering in the TM layers.
2.3 Experiments
Cycled LiNi1/3Mn1/3Co1/3O2 used in this study was obtained in the form of cathodes from
R. Yazami at the California Institute of Technology. They prepared lithium half cells and
performed the charge and discharge processes. The pristine LiNi1/3Mn1/3Co1/3O2 (a = 2.867Å, c =
14.246Å) powder was obtained courtesy of Enax. Inc. and was synthesized following the recipe
published by Ohzuku.13 Here we compare pristine LiNi1/3Mn1/3Co1/3O2 to LiNi1/3Mn1/3Co1/3O2
charged to 5.2 V after 5 formation cycles between 2.5 and 4.5 V. The cycled specimen is studied
in the discharged state.
X-ray diffraction using a Philips X’-Pert diffractometer using Cu Kα radiation (λ = 1.54
Å) and electron diffraction were used to characterize LiNi1/3Mn1/3Co1/3O2 specimens. X-ray
diffraction patterns (XRD) for cycled specimens came from the cathodes, which were
the mixture of active material, carbon black and binder was scraped off the cathodes, washed
repeatedly in diethyl carbonate (DEC), 1-methyl-2-pyrrolidone (NMP), followed by a wash in
ethanol. The suspension with ethanol was transferred onto a holey carbon grid. TEM studies
were performed on the JEOL2010 TEM at AMRI of the University of New Orleans operated at
200 kV.
Electron diffraction patterns were simulated using the programs Desktop Microscopist
and JEMS. X-ray and neutron diffraction patterns were simulated with the program PowderCell.
The structural sketch of LiNi1/3Mn1/3Co1/3O2 with P3112 symmetry was drawn with the program
CrystalMaker. LiCoO2 structure with the parameters of LiNi1/3Mn1/3Co1/3O2 (a = 2.867Å, c =
14.246Å)13 was used to simulate O3 phase of LiNi1/3Mn1/3Co1/3O2 (Table 2.1). Disordered Ni,
Mn and Co atoms occupy the Co sites to form O3 phase of LiNi1/3Mn1/3Co1/3O2. Therefore, we
can use Co atom to substitute the other atoms in the simulations. The structural parameters of
superstructure P3112 used in the simulations were listed in table 2.2.13,21
Table 2.1: structural parameters used to simulate O3 phase of LiNi1/3Mn1/3Co1/3O2 (No.
166). a = 2.867Å, c = 14.246Å [Ref. 13, 17]
Element Wyckoff x y z
Li 3a 0 0 0
Co/Ni/Mn 3b 0 0 0.5
O 6c 0 0 0.2395
Table 2.2: structural parameters used to simulate LiNi1/3Mn1/3Co1/3O2 superstructure
P3112 (No. 151). a = 2.867Å, c = 14.246Å [Ref. 13, 21]
Element Wyckoff x y z
Li(1) 3b 0.7785 0.8892 0.5
Li(2) 3b 0.1178 0.5589 0.5
Li(3) 3b 0.4348 0.2174 0.5
Co 3a 0.7773 0.8886 0
Ni 3a 0.1106 0.5553 0
Mn 3a 0.4457 0.2228 0
O(1) 6c 0.7950 0.9020 0.2564
O(2) 6c 0.0977 0.5589 0.2553
O(3) 6c 0.4402 0.2046 0.2558
2.4 Results
2.4.1 Pristine LiNi1/3Mn1/3Co1/3O2
2.4.1.1 Single crystals with R m3 space group
Selected Area Electron diffraction (SAED) patterns were collected from 15 randomly
selected crystals in the pristine sample LiNi1/3Mn1/3Co1/3O2. Ten out of 15 (66.7%) particles were
homogenous single crystal. Figs. 2.1a, b show an image of a homogeneous particle and its
electron diffraction pattern. The same SAED pattern at [4401] zone axis orientation was
obtained at every selected area on this particle. Fig. 2.1c shows the high resolution transmission
electron microscopy (HRTEM) image of a LiNi1/3Mn1/3Co1/3O2 particle. The spacing between
(0001) planes is 4.74Å measured in this image using the nominal magnification of the
instrument. The c lattice parameter calculated from this image is 14.22 Å, which is in good
aa [4401] (10 14) (1120) b [4401] (10 14) (1120) b
2.4.1.2 Polycrystalline crystals with R m3 space group
Five out of 15 (33.3%) particles were polycrystalline crystals. One example is given
below. Different SAD patterns were collected from different areas of this particle. Obviously,
this particle is made up of several crystals in various orientations. The pattern shows in Fig. 2.2c
is a superposition of a diffraction pattern of the O3 phase in zone axis orientation [0221] and
[2 1 10] . The {1120} and {1104} reflections of the <0221> pattern coincide with the {1 108} and
{1 104} reflections of the pattern in <2110> orientation leading the appearance of strong
reflections. The electron diffraction pattern in Fig. 2.2d contains three patterns namely in
[2 1 10] , [2110] and [0221] zone axis orientation. The strong reflections in pattern d are the
result of superposition. The SAD patterns b and e came from crystals in [0221] and[2110]
orientation. The electron diffraction patterns b1,c1,e1 are simulated patterns using Desktop
Microscopist. (003) c [1100] (0003) (1120) (003) c [1100] (003) c (003) c (003) c [1100] [1100] (0003) (1120)
b c d e a b c d e a b c d e b c d e a [0221]
(2 1 10)
(1012)
b
[0221]
(2 1 10)
(1012)
b
b1 b1
c
[0221] [2 1 10]+
c
[0221] [2 1 10]+
c1 c1
[2 1 10] [2110] [0221]+ + d
[2 1 10] [2110] [0221]+ + d
e
[2110] (01 14) (0003)e
[2110] (01 14) (0003) e1 e1Fig.2.2: Image and diffraction patterns of a polycrystal. a) the selections from where the diffraction patterns have been taken are marked by b, c, d, e; b) an electron diffraction pattern in zone axis orientation [ ; c) electron diffraction pattern at c showing a superposition of two electron diffraction patterns in zone axis orientation
0221]
[0221] and [2 1 10] ; d) electron diffraction pattern at d showing a superposition of three electron diffraction patterns at zone axis orientations [2 1 10] [2110] and [, ; e) an electron diffraction pattern at zone axis orientation
0221]
[ ; b1, c1, e1) simulated patterns corresponding to b, c, e using Desktop Microscopist.
2110]
2.4.1.3 Superlattices
Six out of 15 (40%) particles had new reflection spots that don’t appear in patterns of the
O3 phase. Some of these can be explained assuming a superlattice as proposed by Koyama et
al.22 Fig. 2.3b shows the SAED pattern in [0001] zone axis orientation collected from a particle
showing in Fig. 2.3a. Fig. 2.3b1 shows a simulated SAED pattern of the [ 3 3] 300
R
×
superlattice structure in [0001] orientation. A comparison shows that the weak reflections that
appear between the fundamental (300) reflections in the experimental pattern are reproduced in
the simulated pattern. We call this type of pattern case A. The two most predominant features
observed in the remaining particles showing extra reflections are the appearance of extra spots
perpendicular to (1120) type planes (see Figs. 2.3d, 2.3f) and the observation of new spots
halfway between (1102) type reflections (see Fig. 3h). The particles from which the electron
diffraction pattern in Fig. 2.3d, f, h are taken are shown in Fig. 2.3c, e, g, respectively. In the
SAED pattern shown in Fig. 2.3d, three weak spots can be observed between each {1120} type
reflection. A similar observation is shown in Fig. 2.3f in an electron diffraction pattern in [4401]
zone axis orientation. The new reflections are separated by 1/6 of the distance between 2 {1120}
type reflections and are centered between 2 {1120} reflections. The distances between the extra
spots suggest a superlattice at sixfold distance between {1120} planes. However, in both cases
only 3 and not 5 extra reflections are observed. Therefore, at this time we have no conclusive
evidence for the formation of a superlattice cell. We call this type case B. The electron
diffraction patterns in Fig. 2.3h, i, collected from the particle in Fig. 3g, show new reflections
halfway between {1120} and {1102} type reflections in the [1101] zone axis orientation
(marked by ‘i’ in Fig. 2.3g). A comparison between Fig. 2.3h and 2.3i shows that the reflections
in Fig. 2.3i have streaks. We call diffraction patterns with new reflections halfway between
fundamental reflections case C. All together we observed 2 particles of case A, 3 particles of
aa b (0330) (3300) [0001] b (0330) (3300) [0001] b1 (010) (020) (030) (330) [001] b1 (010) (020) (030) (330) [001]
cc ee g
i
g gi
d [1101] (0 111) (1102) (1120) d [1101] (0 111) (1102) (1120) f (1120) (1108) (0 114) [4401] f (1120) (1108) (0 114) [4401]h
[1101]
(1120) (1 102)
(0 111)
h
[1101]
(1120) (1 102)
(0 111) i [1101] i [1101] ii [1101] i1 i1
Fig. 2.3: Images and SAED patterns of superlattices a) an image for a particle with superlattices; b) a diffraction pattern at zone [0001] of P3112 for particle in (a); b1) a
2.4.2 Cycled specimen at discharged state
In the particles retrieved from the cathode charged to 5.2 V we made similar observations
as in the pristine LiNi1/3Mn1/3Co1/3O2. However, the number of diffraction patterns with extra
reflections was much smaller than in the virgin specimen. Twenty randomly selected particles
were investigated by TEM. Only two out of 20 (10%) had extra reflection spots in the diffraction
patterns; the others could be indexed in space group R m3 and were either single crystals or
polycrystalline particles with the space groupR m3 (10/20 single crystals and 8/20
polycrystalline crystals). These two particles with extra reflection spots in diffraction patterns are
both in case C. One example of a pattern with superlattice reflection is given in Fig. 2.4.
[0001]
(1210)
(2 1 10)
(1120)
[0001]
(1210)
(2 1 10)
(1120)
Fig. 2.4: an electron diffraction pattern at [0001] zone axis showing superlattice reflections.
Fig. 2.5 is showing a X-ray diffraction spectrum of the specimen charged to 5.2 V at
the impurity (carbon, aluminum, et al.) of the cathode since this X-ray spectrum was taken
directly from the cathode with aluminum foil.
10 20 30 40 50 60 70 80
11
3
11
0
108
10
7
10
5
10
4
10
2
00
6
10
1
00
3
2
θ
Discharged state
Fig. 2.5: X-ray diffraction spectrum of LiNi1/3Mn1/3Co1/3O2 charged to 5.2 V at discharge
state.
2.5 Discussion
2.5.1 Morphology
The observed particles can be classified as single and polycrystalline crystals.
Considering that the material was produced from a solid state method using LiOH·H2O, CoCO3,
and a nickel manganese hydroxide as starting material13, we can only speculate that one of the
precursor was polycrystalline, or that several crystals have joined together during heating to form
2.5.2 Cations ordering
The phases of LiNi1/3Mn1/3Co1/3O2 are more complex than its parent LiCoO2 since cobalt
is replaced by three transition metals (TM) in this generation. When only cobalt ions occupy the
transition metal layer, the result is R m3 symmetry for virgin LiCoO2. Different distributions of
three transition metals in LiNi1/3Mn1/3Co1/3O2 will change the symmetry of the resulting lattice.
Furthermore, it is well known that nickel ions exchange positions with lithium ions easily due to
their similar radii.38 We begin by considering the distributions of Ni, Mn, and Co ions in TM
layer at 3a sites inR m3 . If the three cations are distributed randomly in the TM layer, a
diffraction pattern corresponding to that of LiCoO2 in R m3 symmetry is obtained. If two cations
of the same species assume the largest periodical distance, and each cations is surrounded by
cations of the other two species in the TM layer, a 0
[ 3× 3] 30R structure with space group
P3112 as introduced by Koyama will be formed.22 (Fig. 2.6). The Ni, Mn, and Co cations occupy
octahedral sites in TM layers (Fig. 2.6b) with 3aHex. distance between two atoms of one species
(Fig. 2.6c). Alternatively to the 3aHex.× 3aHex. in plane ordering of Ni, Mn, and Co, one could
assume that each species occupies a separate TM layer in the unit.22 We have simulated the
electron diffraction patterns that correspond to both cases, using unit cell listed in table 2.2 and
modified unit cell for the pile-up model (listed in the appendix A). We also simulated the case of
Ni and Li interchange between respective layers for [ 3 3] 300
R
× model (unit cell given in
appendix B) and O3 model (appendix C). In Fig. 2.7 the [001] zone axis patterns for the three
cases and [112] zone axis pattern for spinel structure are shown. In the majority of particles
analyzed here, we find diffraction patterns that are in agreement with the R m3 of LiCoO2
The formation of superstructure has been reported in the generations of LiCoO2 such as
LiNi0.5Mn0.5O2 and LiNi1/3Mn1/3Co1/3O2 cathode materials.8,11,12,22 The ordered distributions of
transition metallic ions and the Li/Ni disorder contribute differently to the formation of
superstructures, translating into different extra reflections in the corresponding electron
diffraction patterns (see our simulations in Figs. 2.7). Experimental evidence for the models used
in Figs. 2.7 are shown in Figs.2.3 and Figs. 2.4. A comparison between experimental and
simulated diffraction patterns shows that the experimentally observed case A corresponds to the
.
3aHex × 3aHex. in plane ordering suggested by Koyama (Fig. 2.3b). Case C corresponds to a
model considering Li and Ni interchange (Fig. 2.3h, i). No experimental evidence could be found
for pile-up model assuming that Co, Ni, and Mn occupy separate TM layers. A comparison
between Figs. 2.3d and 2.3h shows that in both patterns new reflections are observed halfway
between the fundamental {1120}, {1 102} reflections which corresponds to case C. However, in
Fig. 2.3d these new reflections are surrounded by a pair of satellite reflections that are not
reproduced by our models. Satellite reflections can be caused by modulations in the chemical
composition (e.g. spinodal decomposition), periodic arrays of planar defects or small inclusions.
In literature similar electron diffraction patterns were reported for LiMn0.5Ni0.5O2. These patterns
were explained by a 2 3 2 3× aHex. superstructure9,11,38 as well as by a specific stacking order of
the so-called flower structure indicating that their origin is not completely understood at present.
We leave case B unresolved for the time being.
A comparison between the number of particles having superstructures in the pristine
(40%) and the cycled (10%) LiNi1/3Mn1/3Co1/3O2 shows that fewer particles with superstructure
are observed in the latter. We speculate that nickel migration upon cycling is the reason for less
found in the TM layers of these compounds. Upon charge of the batteries lithium ions are
removed from both Li-rich and TM-rich layers opening up empty lattice sites for nickel ions
from lithium-rich layers. The nickel ions can occupy both octahedral and tetrahedral sites. Very
early in the charge process Li-ions are removed from TM layers, enabling Ni diffusion to these
sites. During charge to higher voltages more Li are removed from the lattice.10,12 In return, more
nickel ions migrate from Li layers to TM layers at high voltage. Only some of those nickel ions
will return to the Li layers during discharge process. Therefore, Li/Ni disorder in cycled
specimen is less than virgin specimen. Additionally, as a result of the nickel ion migrations to the
TM layers, the ordering of nickel, manganese and cobalt in TM layers becomes disturbed. These
two contributions are likely reasons why fewer superstructures are observed in cycled
LiNi1/3Mn1/3Co1/3O2 than in pristine powder.
Co
Ni
Mn
O
Li
a
Co
Ni
Mn
O
Li
Co
Ni
Mn
O
Li
Co
Ni
Mn
O
Li
a
b
b
cc
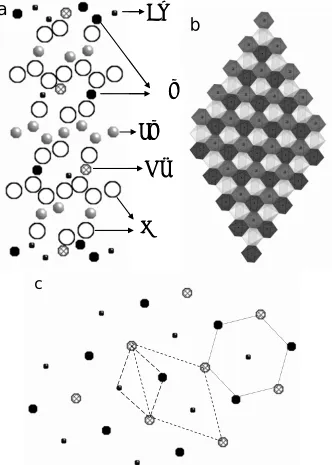
Fig. 2.6: Structures of LiNi1/3Mn1/3Co1/3O2 a) The schematic structure of LiNi1/3Mn1/3Co1/3O2
with P3112 space group; b) polyhedral structure of TM layer; c) the arrangement of Ni, Mn,
Co in TM layers.
aa
b
b
cc
d
d
[112]
e
[112]
[112]
[112]
e
Fig. 2.7: simulated SAED patterns a) Diffraction pattern at zone axis orientation [001] for a
0
[ 3× 3] 30R model; b) Diffraction pattern at zone axis orientation [001] for
0
[ 3× 3] 30R model with partial Li/Ni interchange; c) Diffraction pattern at zone axis
orientation [001] for pile-up model; d) Diffraction pattern at zone axis orientation [0001] for O3 model with partial Li/Ni interchange; e) spinel pattern at zone axis [112] with some Ni at tetragonal sites. All these SAED patterns are simulated using Desktop Microscopist.
2.5.3 X-ray and neutron diffraction simulations
Structures with space group P3112 and R m3 can be identified by neutron diffraction
instead of X-ray diffraction. Nickel, manganese, and cobalt ions have similar electron
configurations, which results in similar X-ray signals. The X-ray diffraction patterns of P3112
and R m3 structures showing in Fig. 2.8 It can be seen that they are almost the same. The
superlattice peak intensities are relative 1% of the intensity of fundamental (003) peak, which are
hardly observed and identified experimentally. The disorder of Li/Ni distribution has a negligible
effect on the superstructure reflection intensity.8 In conclusion, x-ray diffraction technique is not
good to detect superlattices formed by both ordering of Ni2+, Mn4+ and Co3+ in TM layer and
disorder of Li/Ni ions. However, these metallic ions in LiNi1/3Mn1/3Co1/3O2 have significantly
different neutron scattering lengths (bNi = 10.3 fm; bMn = -3.73 fm; bCo = -6.2 fm; bLi = -1.9 fm).
Therefore, the neutron diffraction pattern of the ordered transition metallic ions in TM layer
0
[ 3× 3] 30R structure with space group P3112 is distinctly different from the one of
3
R mstructure with random TM ions distribution (Fig. 2.9). Bear in mind, Li occupancy on the
Ni site could significantly lower the contrast of different sites in the TM layers in powder
neutron diffraction patterns. Then the intensities of superstructure reflections from Li/Ni disorder
contribution could be low enough to be undetectable experimentally.
10 20 30 40 50 60 70 80
113 11 0 018 107 01 5 10 4 012 00 6 101 00
3
3
R m
P3
112
In
te
n
s
it
y
(a
rb
. u
n
it)
2
θ 303 30 0 11 8 117 11 5 114 113 11 2 105 111 110 00320 25 30 35
104 103 102 101 10 0 2θ
10 20 30 40 50 60 70 80
113 11 0 018 107 01 5 10 4 012 00 6 101 00
3
3
R m
P3
112
In
te
n
s
it
y
(a
rb
. u
n
it)
2
θ 303 30 0 11 8 117 11 5 114 113 11 2 105 111 110 00320 25 30 35
104 103 102 101 10 0 2θ
Fig. 2.8: X-ray diffraction spectra of LiNi1/3Mn1/3Co1/3O2 with 3R m and P3112 space group
simulated using program Powdercell. The superreflections of P3112 between 20˚ and 35˚ were
10 20 30 40 50 60 70 80
3
R
m
Inte
nsity (a
rb.u
ni
t)
2θ
P3
112
Fig. 2.9: Neutron diffraction spectra of LiNi1/3Mn1/3Co1/3O2 with 3R m and P3112 space
group simulated using program Powdercell.
2.6 Conclusions
Both virgin and cycled (discharged status) LiNi1/3Mn1/3Co1/3O2 specimens were
investigated by transmission electron microscopy. This LiNi1/3Mn1/3Co1/3O2 material was found
to be inhomogeneous according to our study. 15 randomly selected particles of pristine
LiNi1/3Mn1/3Co1/3O2 were analyzed, in which 10 particles (66.7%) were single crystals, 5
particles (33.3%) were polycrystalline crystals. They contain 6 particles (40%) with
superstructures. The inhomogeneous phenomenon was also found in cycled samples from corn
cells. Only 2 (10%) particles out of 20 randomly selected particles of LiNi1/3Mn1/3Co1/3O2 sample
at discharged status after charged to 5.2 V contain superstructures. Obviously, the number of
sample (40%). R m3 symmetry was the majority structure for LiNi1/3Mn1/3Co1/3O2.
Superstructure was very common in LiNi1/3Mn1/3Co1/3O2 due to the arrangements of three
transition metallic ions Ni, Mn, and Co and the disorder of Li/Ni. Among those superstructures,
P3112 symmetry was the main superlattice of this material with a particular arrangement of TM
ions in TM layers called [ 3 3] 300
R
× -type structure. P3112 superstructure was hardly
distinguished by XRD experimentally since P3112 and R m3 structures had similar X-ray
diffraction spectra. While they had distinct neutron spectra indicating neutron diffraction is a
good experimental method to identify P3112 superstructure from R m3 phase.
2.7 References
(1) Mizushima, K.; Jones, P. C.; Wiseman, P. J.; Goodenough, J. B. Materials Research Bulletin
1980, 15, 783-789.
(2) Ohzuku, T.; Makimura, Y. Chem. Lett.2001, 30, 744.
(3) Makimura, Y.; Ohzuku, T. J. Power sources2003, 119, 156.
(4) Lu, Z. H.; Beaulieu, L. Y.; Donaberger, R. A.; Thomas, C. L.; Dahn, J. R. J Electrochem Soc
2002, 149, A778.
(5) Lu, Z. H.; MacNeil, D. D.; Dahn, J. R. Electrochemical and Solid-State Letters 2001, 4,
A191.
(6) Kang, K.; Meng, Y. S.; Breger, J.; Grey, C. P.; Ceder, G. Science2006, 311, 977-980.
(7) Lu, Z. H.; Chen, Z. H.; Dahn, J. R. Chem. Mater.2003, 15, 3214.
(8) Meng, Y. S.; Ceder, G.; Grey, C. P.; Yoon, W. S.; Shao-Horn, Y. Electrochemical and Solid-State Letters2004, 7, A155-A158.
(9) Meng, Y. S.; Ceder, G.; Grey, C. P.; Yoon, W. S.; Jiang, M.; Breger, J.; Shao-Horn, Y.
Chem. Mater.2005, 17, 2386-2394.
(10) Li, H. H.; Yabuuchi, N.; Meng, Y. S.; Kumar, S.; Berger, J.; Grey, C. P.; Shao-Horn, Y.
Chem. Mater.2007, 19, 2551-2565.
(11) Hinuma, Y.; Meng, Y. S.; Kang, K.; Ceder, G. Chem. Mater.2007, 19, 1790-1800.
(12) Breger, J.; Meng, Y. S.; Hinuma, Y.; Kumar, S.; Kang, K.; Shao-Horn, Y.; Ceder, G.; Grey, C. P. Chem. Mater.2006, 18, 4768-4781.
(13) Ohzuku, T.; Makimura, Y. Chem. Lett.2001, 30, 642.
(14) Kim, H.-S.; Kim, S.-I.; Kim, W.-S. Electrochimica Acta2006, 52, 1457-1461.
(15) Choi, J.; Manthiram, A. J Electrochem Soc2005, 152, A1714-A1718.
(16) Amatucci, G. G.; Tarascon, J. M.; Klein, L. C. J. electrochem. soc.1996, 143, 1114-1123.
(17) Ceder, G.; Ven, A. V. d.; Aydinol, M. K. J. of metal, materials and mimerals1998.
(20) Koyama, Y.; Makimura, Y.; Tanaka, I.; Adachi, H.; Ohzuku, T. J Electrochem Soc 2004,
151, A1499-1506.
(21) Koyama, Y.; Yabuuchi, N.; Tanaka, I.; Adachi, H.; Ohzuku, T. J. Electrochem. Soc 2004,
151, A1545-A1551.
(22) Koyama, Y.; Tanaka, I.; Adachi, H.; Ohzuku, T. J. Power sources2003, 119-121, 644-648.
(23) Yoon, W.-S.; Grey, C. P.; Balasubramanian, M.; Yang, X.-Q.; Fischer, D. A.; McBreen, J.
Electrochemical and Solid-State Letters2004, 7, A53-A55.
(24) Nedoseykina, T.; Kim, S.-S.; Nitta, Y. elelctrochim ACTA2006, 52, 1467-1471.
(25) Li, D.-C.; Muta, T.; Zhang, L.-Q.; Yoshio, M.; Noguchi, H. J. Power sources 2004, 132,
150-155.
(26) He, P.; Wang, H.; Qi, L.; Osaka, T. J. Power sources2006, 160, 627-632.
(27) Kim, H.-s.; Lee, C.; Moon, S. J. Power sources2006, 159, 227-232.
(28) Luo, X.; Wang, X.; Liao, L.; Wang, X.; Gamboa, S.; Sebastian, T. J. J. Power sources2006,
161, 601-605.
(29) Yabuuchi, N.; Makimura, Y.; Ohzuku, T. J Electrochem Soc2007, 154, A314-321.
(30) Chen, Z.; Sun, Y. K.; Amine, K. J Electrochem Soc2006, 153, A1818-1822.
(31) Kim, J.-M.; Kumagai, N.; Komaba, S. elelctrochim ACTA2006, 52, 1483-1490.
(32) Kobayashi, H.; Arachi, Y.; Emura, S.; Kageyama, H.; Tatsumi, K.; Kamiyama, T. J. Power sources2005, 146, 640-644.
(33) Li, D.; Sasaki, Y.; Kobayakawa, K.; Noguchi, H.; Sato, Y. elelctrochim ACTA 2006, 52,
643-648.
(34) Kobayakawa, M.; Li, D.; Kobayakawa, K.; Sato, Y.; Lee, Y. S. J. Power sources2006, 157,
494-500.
(35) Li, D.; Kato, Y.; Kobayakawa, K.; Noguchi, H.; Sato, Y. J. Power sources2006, 160,
1342-1348.
(36) Kim, H.-S.; Kim, S.-I.; Kim, W.-S. elelctrochim ACTA2006, 52, 1457-1461.
(37) Whitfield, P. S.; Davidson, I. J.; Cranswick, L. M. D.; Swainson, I. P.; Stephens, P. W. Solid State Ionics2005, 176, 463-471.
Appendix
Appendix A: unit cell of pile-up model.
Element
3 3
3
3 /3
3 3
/3 3
3 n
3
/3 2
3
3 2
3
3 2
O 0 0 1/4
O 0 0 3/4
2/3
O 2/3 1/3 3/4
1/ 0 1/12
O 0 2/3 5/12
1/3 2/3 3/4
2/ 0 5/12
O 0 1/3 1/12
x y z
Li 2/ 0 1/6
Li 1/ 2/3 1/2
Li 2/3 2/3 5/6
Li 0 0 1/2
Li 0 2/3 1/6
Li 0 1/3 1/6
Li 2/3 1/3 5/6
Li 1/ 1/3 1/2
Ni 1/ 1 2/3
Co 0 0 0
Mn 1/ 0 1/
Mn 2/3 2/3 1/3
Ni 2 0 2/3
Co 1/ 2/3 0
Ni 0 2/3 2/3
Co 2/ 1/3 0
M 0 1/3 1/3
O 1/ 0 7/12
O 0 2 11/1
O 2/ 1/3 1/4
O 2/ 0 11/1
O 0 1/3 7/12
O 1/3 2/3 1/4
O 2/ 2/3 7/12
O 1/ 1/3 11/1
O 1/3 5/12
O 2/3 1/12
1/3
O 3
O
Appendix B: unit cell of [ 3× 0 model rtial Li/N .
ent
Li(1) 3b 0.7785 0.8892 0.5
Ni 3b 0.7785 0.8892 0.5
Li(2) 3b 0.1178 0.5589 0.5
Ni 3b 0.1178 0.5589 0.5
Li(3) Ni
Co 3a 0.7773 0.8886 0
Ni 3a 0.1106 0.5553 0
Li 3a 0.1106 0.5553 0
Mn 3a 0.4457 0.2228 0
O(1) 6c 0.7950 0.9020 0.2564
O(2) 6c 0.0977 0.5589 0.2553
O(3) 6c 0.4402 0.2046 0.2558
Appendix C: unit cell of O3 model with partial Li/Ni interchange.
Element Wyckoff x y z
Ni 3a 0 0 0
Li 3a 2/3 1/3 1/3
Li 3a 1/3 2/3 2/3
Co/Ni/Mn 3b 0 0 0.5
Co/Ni/Mn 3b 2 1/3 5/6
Co/Ni/Mn 3b 1 2/3 1/6
O 6c 0 0 0.23950
O 0 0 0.76050
O 2/3 1/3 0.57283
O 2/3 1/3 0.09383
O 1/3 2/3 0.90617
3] 30R with pa i interchange
Elem Wyckoff x y z
3b 0.4348 0.2174 0.5
3b 0.4348 0.2174 0.5
/3 /3


![Fig. 2.1: Single crystal with 3diffraction pattern for a; c) a high resolution image at [R m symmetry a) image of a single crystal; b) the electron 1100]zone](https://thumb-us.123doks.com/thumbv2/123dok_us/8935909.1847867/35.612.92.503.77.202/single-crystal-diffraction-pattern-resolution-symmetry-crystal-electron.webp)

![Fig. 2.4: an electron diffraction pattern at [0001] zone axis showing superlattice reflections](https://thumb-us.123doks.com/thumbv2/123dok_us/8935909.1847867/40.612.193.370.381.559/fig-electron-diffraction-pattern-zone-showing-superlattice-reflections.webp)

![Fig. 2.7: simulated SAED patterns a) Diffraction pattern at zone axis orientation [001] for a 0orientation [001] for pile-up model; d) Diffraction pattern at zone axis orientation [0001] for O3 model with partial Li/Ni interchange; e) spinel pattern at zon](https://thumb-us.123doks.com/thumbv2/123dok_us/8935909.1847867/46.612.110.506.74.343/simulated-patterns-diffraction-orientation-orientation-diffraction-orientation-interchange.webp)

