DESERT 18 (2013) 9-18
A Study on Dust Storms Using Wind Rose, Storm Rose and Sand
Rose (Case Study: Tehran Province)
A.A. Nazari Samani
a*, S. Dadfar
b, A. Shahbazi
ca
Faculty of Natural Resources, University of Tehran, Karaj, Iran
b
Senior expert of Desert Management
c
Ph.D student of Watershed Management
Received: 1 January 2011; Received in revised form: 11 July 2013; Accepted: 22 July 2013
Abstract
Sand and dust storms are natural events that occur widely around the world, mostly in dry and bare lands. Over the past decade a large part of Iran has been affected by this phenomenon, and Tehran has not been excluded from this event. Therefore, having knowledge of spatiotemporal frequency variations can aid us in future management and storm trajectory assessment. In this study the synoptic anemometric data of Tehran-Mehrabad stations over the past 47 years were used. Annual and monthly wind and storm roses were drawn to determine the predominant wind direction. The primary results indicated that the prevailing wind direction is western, but in summer, it is south-southeastern. According to the threshold wind velocity (6.5 ms-1) about 12% of recorded data was categorized into the storm condition.. Results also indicated that western, northwestern, and southwestern winds have the three highest rates of sand drift potential (Dpt), respectively. The temporal variability of dust storms showed that between 1951 and 2005, the largest number of days characterized by dust and thunderstorms was observed in the spring and summer. The average number of dusty days in spring and summer was four d/m, and the fastest winds ranged from 40 to 49 m/s-1. An assessment of dusty days over the past five decades revealed that the average number of dusty days has significantly increased from 10 days to 80 days. It seems that cyclonic circulations in the Monsoon Trough together with regional winds in central Iran are responsible for the transmission of dust particles over central Iran. Results and data from this study can be helpful in determining and predicting the critical dust storm period and in forming management strategies in order to minimize aftermath impacts.
Keywords: Dust storms; Velocity; Wind direction; Storm rose diagram
1. Introduction
Dust storms and strong winds are natural events in arid and semiarid regions all across the world. These phenomena occur when anthropogenic activities lead to natural land and equilibrium degradation and become intensified once these lands are subjected to drought stress (Ekhtesasi and Azimzade, 2003).
Hurricanes David and Fredrik of 1979 imposed damages costing up to $3 billion in the United States of America. A black storm in northern China in 1985 killed 1,993 people and destroyed up to 373,000 hectares of arable lands
Corresponding author. Tel.: +98 263 2223044, Fax: +98 263 2223044.
E-mail address: [email protected]
variations. They found that the average of highest annual frequency for dust storms was 67 days in spring across the sandy central Karaka desert. A study of the northern China plateau revealed that as humidity increases, wind erosion reduces considerably. When sand moisture increases to four percent, erosion reaches a constant rate and subsequently decreases to zero (Chen Winnen, 1996). In addition, dust emissions from the Middle East and North Africa contribute to eastern Asia (Tanaka et al., 2005). It seems that dust emission and transportation in eastern Asia is affected by a synoptic frontal system blowing forward to the arid region of northern Asia, causing the wind to blow at a velocity of up to 6 m/s (Wang and Fung, 2006). A wind rose is the simplest statistical representation of anemometry and shows wind direction and velocity. It is a circular graph indicating wind velocity and direction analysis results in a given area or station. It can be very effective in recognizing direction and frequency of an area’s severest winds, but it does not provide usable criterion for stormy and dusty wind analysis, since most stormy winds blow with a velocity beyond the threshold rate for lifting and transporting particles which subsequently create dust storms. In other words, threshold wind velocity depends on soil type on which the wind blows (Rafahi, 2005) and the biggest percent of winds used in wind rose plotting do not generate a dust storm. In fact most storm and dust winds have a velocity higher than threshold velocity. In order to address these issues more precisely analyze dust storm winds, another chart known as “storm rose” was defined and evaluated which is able to show wind conditions better than the wind rose. In fact, a storm rose is a kind of wind rose which makes a connection between the spatial nature of wind and land and, by considering the threshold velocity of soil erosion, shows winds affecting storm and dust production more clearly. In other words, storm roses and wind roses are important for us with a velocity greater than the threshold velocity of soil erosion.
A sand rose is a hodogram vector diagram of wind energy for sand drift. It shows the wind erosion power and relative velocity of sand transport in different directions. Unlike the wind rose and the storm rose the sand drift potential is calculated through wind frequency and velocity in different direction by a vector algebra procedure in a sand rose. Then by arithmetic vector summation and vector analysis, the resultant direction of sand movement is defined.
One of the most important differences between the sand rose and other wind analyzing diagrams is its ability to unify wind power instead of different velocity classes and specify the consequent sand transport direction. In addition, by the help of the sand rose and even the storm rose, we can recognize lands sensitive to erosion in a station environment. If there is no sensitive land in the station environment, there will be no storm rose and sand rose, and the arms will be eliminated.
Gale-force winds and sand blasts in arid lands cause havoc and damage. Because Tehran province is under the influence of such a situation due to its climate and geographic location, the current study set out to determine the direction and time of occurrence for these blasts in order to prevent so many unwelcome changes. Over the past decades, severe storms and catastrophic dust winds have caused huge humane and environmental damages in Iran and Tehran province as a capital region is subjected to this destructive phenomenon. The main objective of the present research is to determine temporal variation and wind regime as well as the direction of storms to find the main sources and trajectory of dust storms. Such results can enable us to better understand the dust storm process and develop early warning systems to minimize the hazards of dust storms.
2. Materials and methods
2.1. Study area
In this research, anemometer data from the Tehran-Mehrabad synoptic station during a statistical period of about 47 years (1961-2007) was used to draw the wind, storm, and sand roses. The coordinates of the Tehran-Mehrabad station are 51, 19 longitude and 35, 42 latitude respectively. Annual mean rainfall, annual mean temperature, annual mean relative moisture, and annual sunny hours are 238.9 mm, 17.7°C, 41%, and 3025 H, respectively. The prevailing wind blows in a westerly direction as calculated at three recording times (morning, midday, and evening) at a velocity 5.5 m/s (statistics and information of Iran Meteorological Organization).
2.2. Methodology
domestic software known as “Wdconvert2.0” was used to change the anemometer data collected from meteorological stations in Iran (synoptic or climatology) into a readable format for WRPLOT.
In addition to drawing a standard wind rose with a basic velocity of 0.54m.s-1, the WRPLOT software also changed basic velocity and the wind rose drawing to a more basic velocity to make it more flexible for the user to make different comparisons and analyses on region anemometer data using this software. In this research, by using the software’s mentioned capabilities and by considering the basic velocity as equal to wind erosion threshold velocity, the new storm generator wind rose was formed with the new name “storm rose”. A storm rose represents the relationship between wind spatial velocity and wetter lands and can show the storm potential of an area.
Use of a sand rose is a method for wind statistical analysis in relation to wind erosion threshold velocity first suggested and used by Burger and Leto (1975). In this method, to unify wind erosion power, velocities higher than the threshold velocity of soil erosion must first be changed to vector units named “sand transport power” in order to unify wind erosion power. Then, by drawing them in eight or sixteen directions, the sand rose is defined. By finding the vector sum of the sand rose arms, the consequent vector of sand transport power can be obtained, which shows the relative amount and final direction of sand transport in a region or desired geomorphologic features. Because of the complexity and large amount of statistical calculation involved in drawing a sand rose, the software “Wind Rose Represented” designed by Ekhtesasi and Saremi Naeeni on the basis of Burger and Leto’s equations (1975). This software can draw a sand rose and analyze it statistically using anemometer data from a meteorological station and the wind erosion
threshold velocity of different faces in the station environment. The drawn sand rose can show the sand transport velocity by wind and its direction in different faces around the selected station.
3. Results
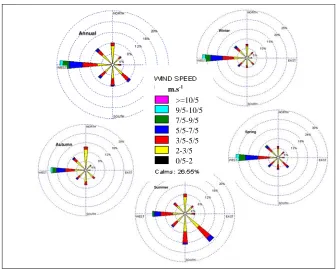
3.1. Drawing and analysis of seasonal and annual wind rose
Analyzing the anemometer data from the Tehran-Mehrabad synoptic station showed that for about 34.20% of a 3-hour monitoring, the meteorological conditions were quiet, and at other times the wind velocity was more than 0.54 m/s-1. As the seasonal and annual wind rose of the case study shows (Fig. 1), west winds occurred most often with a frequency of about 18.80%, followed by winds blowing in the directions of southeast and northwest with frequencies of about 8.53% and 8.13%, respectively. Winds with velocities of 2-3.5 to 3.5-5.5 m/s-1
and at frequencies of 17.35% and 32.46%, respectively, were the most frequent in all directions. More than 50% of winds are in the second class with 2-3.5 to 3.5-5.5 m/s-1 velocity. Winds with a velocity of more than 5.5 m/s-1 make up just 12.14% of the total. The frequency of severe and erosion winds in the region is much less than this. The seasonal wind rose of the region also showed that, except in summer, the most frequent winds blow to the west (Table 1 and Fig. 1). We can see that in summer there are predominant winds in the south and west. Although we can observe by the wind rose that the fastest winds of the Tehran-Mehrabad station are in the west, we can't be sure that the most effective winds for soil erosion and sand transport are in this sector. Table 1 shows the frequency distribution of the region winds in 8 geographical directions as calculated by WRPLOT View.
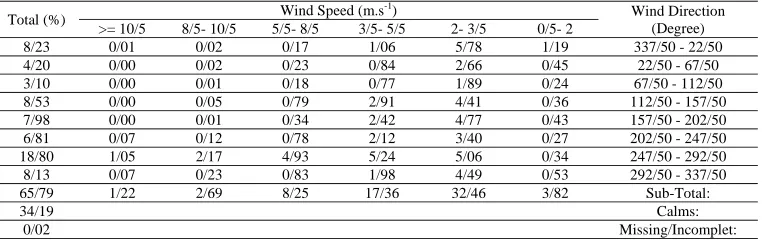
Table 1. The frequency distribution percentage of the region winds in 8 geographical directions which are calculated by WRPLOT View software
Wind Direction (Degree) Wind Speed (m.s-1
) Total (%) 0/5- 2 2- 3/5 3/5- 5/5 5/5- 8/5 8/5- 10/5 >= 10/5
337/50 - 22/50 1/19 5/78 1/06 0/17 0/02 0/01 8/23
22/50 - 67/50 0/45 2/66 0/84 0/23 0/02 0/00 4/20
67/50 - 112/50 0/24 1/89 0/77 0/18 0/01 0/00 3/10
112/50 - 157/50 0/36 4/41 2/91 0/79 0/05 0/00 8/53
157/50 - 202/50 0/43 4/77 2/42 0/34 0/01 0/00 7/98
202/50 - 247/50 0/27 3/40 2/12 0/78 0/12 0/07 6/81
247/50 - 292/50 0/34 5/06 5/24 4/93 2/17 1/05 18/80
m.s-1
>=10/5 9/5-10/5 7/5-9/5 5/5-7/5 3/5-5/5 2-3/5 0/5-2
Fig. 1. Annual and seasonal wind rose stations of Tehran - Mehrabad (1961-2007)
To prepare the compatible format data for in putting WRPLOT software the anemometry data was rearranged by Wdconvert2.0 software.. As can be seen, data from more than 151903 hours of monitoring was used to draw the wind,
storm, and sand roses of the region. From that, only 33 hours were monitoring without statistics. More than 51948 hours of monitoring, about 34.20% of all monitoring, registered calm winds.
Table 2. An example of analytical report anemometer data provided by the program WDconvert 2.0 Total Number Of Hours 151936 Hour Total Hours Usede 151903 Hour Incomplete/Missing Hours 33 Hour Data Availability 99/97% Calm Hours 51948 Hour Calm Wind Frequency 34/20% Minimum Wind Velocity 0/5 m.s-1 Maximum Wind Velocity 22/5 m.s-1 Average Wind Velocity 2/56 m.s-1 Calm Wind Velocity 0 m.s-1
Table 3 shows the annual, seasonal, and monthly wind conditions at the Tehran-Mehrabad meteorological station. As Table 2 shows, throughout the year the most frequent wind direction registered at the
Tehran-Mehrabad station was to the west (270 degree). The next most important wind blows in summer from the southeast and from the desert (Kavir) to Tehran and leads to the transfer of hot weather and dust to the cities of the province.
Table 3. Statistical Index windy regime in Tehran - Mehrabad (1961-2007)
3.2. Drawing and analysis of storm rose
Considering that the identification and separation of grueling and severe winds have special importance in wind erosion studies, a
more detailed review and a better understanding of such winds in the study area was achieved through drawing of a dust storm rose. In this study, in order to perform a storm rose analysis, the related storm rose to the lowest wind erosion
Statistical Index Winter
Spring Summer
Autumn Mean
Annual Dec Nov Oct Sep Aug Jul Jun May Apr Mar Feb Jan
Total hours of observation 37539
37887 38305
38304 151936
12919 11663 12927 12512 12928 12513 12929 12929
12513 12929 12513 12928
Dominant wind direction W
W SE - W
W W
W W W W W W SE - W SE- S
SE - W W
W W
Average wind speed (m.s-1)
2/45 3/42
2/47 1/90
2/56
1/71 2/5 3/12 3/48 3/52 3/25 2/82 2/38 2/27 2/20 1/87 1/62
Percentage of calm conditions 40/70
24/57 28/81
47/35 34/20
threshold velocity 6.5 m/s-1 at a height of 10 meters was used, and accordingly the grueling wind conditions were investigated in the area. Resulting analysis suggests the region has the potential for wind erosion.
Figure 2 shows the annual and seasonal storm rose of the area considering the threshold velocity of 6.5 m/s-1. As the annual storm rose of the Tehran-Mehrabad station illustrates, the direction of grueling winds with more than 6.5 m/s-1 velocity are mainly from the west to the northwestern and southwestern sectors. Seasonal storm roses also indicate that wind velocities up to 6.5 m/s in spring and winter have the highest frequencies at 18.68% and 16.06%, respectively. Comparatively, winds occurring in summer and autumn in this area have less velocity. Therefore, if the same conditions exist across the basin, it can be expected that the storm rose would mostly occur in winter and spring (statistics and information from the Iran Meteorological Organization). Of course, in respect to the Mediterranean climate and the high proportion of precipitation that falls during winter and spring (Meteorology Institution), the possibility of the existence of moisture in the soil surface is increased, and this issue is important in increasing the threshold velocity and subsequently reducing soil erosion.
3.3. Drawing and analysis of sand rose
Another method for analyzing grueling and severe stormy winds is to estimate values of sand transportation potential (DP) and draw a sand rose (Fry Burger, 1975). It is drawn given the threshold velocity like the storm rose, with one difference being that, unlike the storm rose, the percentage of wind frequency was not considered in the sand rose. Instead, another parameter with the title of sand transportation potential was calculated for 8 and 16 different directions which reflects the wind power in carrying soil particles.
The calculation of sand transportation indices and the drawing of a sand rose are then the most suitable and reliable methods for identifying and analyzing grueling winds. In this method, the wind power for sediment transportation in different directions is first calculated. Then based on the obtained values, the sand rose arms (in different directions) are drawn as a vector unit in mm.
Because of the complexity in calculations of the sand transportation potential and sand rose drawing, the software sand rose graph was used. We studied the conditions of grueling winds in the area based on the results obtained with this
software. In order to calculation the values of DP and draw the sand rose according to Fry Burger’s suggestion, the lowest threshold velocity of wind erosion at a height of 10 meters around the selected anemometer station was considered the base threshold velocity of erosion. In this way, the obtained values of DP had the highest sand transportation power (potential). In order to make a relative identification of the status of grueling winds, first all of the area’s monthly, seasonal, and annual sand roses were calculated and examined based on the minimum threshold velocity. Then, the trend of sand movement were determined over the past decade.
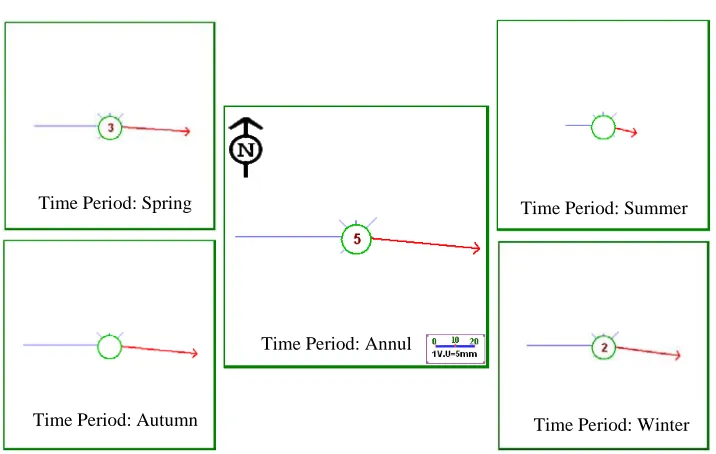
Figure 3 shows the annual and seasonal sand roses of the Tehran-Mehrabad stations based on the anemometer data of a statistical period of 47 years and drawn according to the minimum threshold velocity (6.5 m/s-1). The values related to the sand rose indices calculated using sand rose graph software are presented in Table 4. The calculation of DPt values in different seasons indicated that the area’s most vigorous winds blow in spring and winter, respectively, and that autumn and summer winds are more calm. A review of monthly values indicated that the area’s most erosive winds blow from January until the end of May, and the erosivity of the area’s winds is weak during other months. The investigation into erosive wind direction in the area suggested that the general direction of erosive winds is to the west; thus, the final direction of sand transportation, called RDD, also shows the direction of flowing sand movement in the area trends from west to east. Table 4 shows that the frequency of erosive winds in the region is trifle, and across almost all months of the year, its value is less than 22%.
Figure 4 shows the estimated DPt values in different months of the year. As is illustrated, in spite of less frequency of grueling winds in various months, the values for sand transportation potential in the region are very significant, especially in March and May. One index resulting from the sand rose drawing is the homogeneous index of sand transportation, which is defined as the ratio of final value of sand transportation to total power of sand transportation.
transportation direction is more than 0.5 in all months of the year and annually equals 0.9, indicting the unidirectionality of the area’s winds. Since sand is displaced by wind in a multidirectional manner, the dunes move in a sweeping state, and sand is constantly moving in different directions. However, grueling winds often have higher frequencies in certain
directions, so the movement of the dunes follows the direction of erosive winds in nature. In order to calculate the final value of transported sand and its movement direction, the outcome vector of the trend of sand transportation in different directions was calculated.
Table 4. Annual, seasonal and monthly indices Values extracted from drawing sand rose from the station in Tehran-Mehrabad (V* = 6/5m/s) Time Index Spring Summer Autumn Winter Mean
Annual Mar Feb Jan Dec Nov Oct Sep Aug Jul Jun May Apr
DPt 115/6 18/6 39/9 72/4 245/7 44/7 46/3 11/2 6/9 4 6/8 14/2 15/1 10/5 24/5 22/5 38/5 RDP 103 14 38/013 68/007 222/00 41/01 41/05 11 4 3 6 13/04 15 10 21 22/02 36 RDD ) Degree ( 90 90 92 91 91 89 93 90 90 89 93 90 90 89 93 90 90 UDI 0/89 0/753 0/95 0/94 0/9 0/92 0/88 0/98 0/58 0/75 0/88 0/92 0/99 0/95 0/85 0/97 0/93 F%>Vt 18/61 5/26 10/11 16/06 12/56 21/66 20/07 10/55 6/05 3/58 5/6 9/74 10/85 9/79 14/17 16/24 19/83 Qs ) Kg/m-s ( 21/73 3/71 7/44 13/73 11/52 25/52 25/51 6/23 3/81 25/52 25/51 6/23 3/81 25/52 25/51 6/23 3/81 RQS ( Kg/m-s) 19/37 2/71 7/13 12/93 10/4 23/18 22/6 5/91 2/17 23/18 22/6 5/91 2/17 23/18 22/6 5/91 2/17
Fig. 3. Annual and seasonal sand rose stations of Tehran – Mehrabad (threshold velocity 6/5 M.S-1
)
Fig. 4. Estimate of Total Drift Potential (DPt) values in different months of the year according to the frequency of grueling wind over a velocity 6.5 m/s
3.4. Relationship of wind rose, storm rose, and sand rose with thunderstorms and dusty days
Considering the importance of thunderstorms and dusty days in wind erosion and their role in the creation and displacement of contamination, in this section we will study and compare dusty days and their relationship with the wind, storm, and sand roses using data obtained from the Tehran-Mehrabad synoptic weather station during a statistical period of 55 years (1951-2005). According to the World Meteorological Organization Agreement (WOA), a soil hurricane is reported when the wind velocity at
a station exceeds 30 Nat and horizontal visibility reaches less than 1 kilometer (1000 meters) due to air dust. Thunderstorms are strong and terrible natural phenomena that extend thousands of kilometers. Considering the area’s seasonal wind roses, it can be seen that the area is windier in spring and summer than in autumn and winter.
Figure 5 shows the number of days with dust storm in each month. As the figure shows the dustiest days are seen in spring and summer. June has the maximum number of dusty days (3.5 d/m on average).
Time Period: Winter
Time Period: Spring Time Period: Summer
Time Period: Autumn
Fig. 5. Dust Storm Frequency in the Site
Figure 6 also shows the number of days associated by storm condition in each month. This region has the most thunderstorm days in spring and summer, such that the number of combined days with thunderstorms in May
exceeds four days in a month. Seasonal storm roses also reflect the fact that winds with a velocity of 6.5 m/s are most frequent in spring and winter, and the area’s winds mainly have a lower velocity in summer and autumn.
Fig. 6. Thunder Storm Frequency In Tehran Province
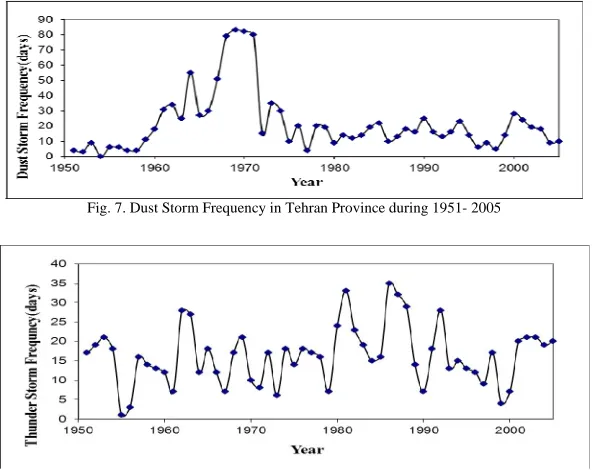
Figure 7 examines the trend of the number of dusty days during 1951 to 2005. It can be seen that dust increased from 1968 until 1971, and on
average, 80 days per year have dust.
Figure 8 shows the number of days with thunderstorms during the years 1951 to 2005.
Fig. 7. Dust Storm Frequency in Tehran Province during 1951- 2005
Figure 9 shows the direction and velocity of the fastest winds, and the dates of their occurrence are presented in Table 4. The velocity of the fastest winds ranges from 32 to 49 meters per second. Here it can also be seen that the maximum wind velocity in spring and winter measuring 49 and 40 m/s, respectively, is higher than in summer and autumn. Therefore, it
can generally be concluded that the frequency of winds and therefore the number of dust storm days and thunderstorms in spring and summer are more than in fall and winter, but the strongest and most grueling winds occur in winter and spring more than in autumn and summer.
Fig. 9. The fastest wind direction and velocity (1951-2005)
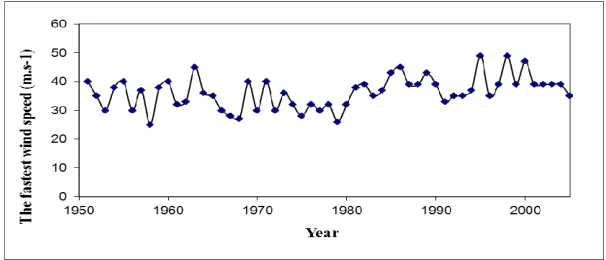
Figure 10 shows the velocity of the fastest winds in each year. As is illustrated, it can be said that in recent years, wind velocity has increased so that in years 1995 and 1998, its
peak was reached and wind velocity reached 49 m/s. Faster wind velocity creates conditions conducive to wind erosion.
Fig. 10. The fastest winds velocity per year (1951-2005)
4. Discussion and conclusions
By comparing the results obtained from the wind, storm, and sand roses of the Tehran-Mehrabad station, the following results are inferable. As a whole, wind roses represent the single inference of wind features and the direction of wind in the area or range of the studied stations; they offer no index for analyzing storm and dust creation. In the storm rose, because of the interference of the threshold velocity of wind erosion, a relationship is established between wind features and erodibility of the land around the station. Thus, the possibility of detecting storm conditions and the direction of grueling winds becomes easier.
degrees from geographic north, which indicates the direction of sand movement is from west to east.
References
Ahmadi, H., 1998. Applied geomorphology: Desert and wind erosion. University of Tehran press, Volume 2, First edition.
Borjian Borojeni B., 2005. Analyses of wind statistic and sand rose drawing in WRplotview software and how to use wind data in standard files of Iran. Meteorological Organization for applying in this software. First national conference of wind erosion, Yazd.
Chen, W., 1996. Wind tunnel test of the influence of moisture on the erodibility of loess sandy loam soils in East Asia. Global and planetary change. Volume 52: 57-70.
Ekhtesasi M.R., 2001. Applied geomorphology. Yazd University tuition booklet.
Ekhtesasi M.R., M.A, Sarami Nayini and A. Sarami Nayini, 2005. Design of Sand rose graph software the Processor of soil erosion power and sediment transportation by wind; First national conference of wind erosion, Yazd.
Ekhtesasi M.R., 1996. Seeking of the origin of sand hills of Yazd plains-Ardakan. Research Institute of Foster and Range, No. 54.
Ekhtesasi, M.R., 2004. Morphometric and morpho- dynamic study of aelion formations in Yazd-Ardakan plain and determination of its indices to application in desertification assessment models. PhD Thesis, Faculty of Natural Resources, University of Tehran. Omidvar, K., 2005. Study of severe winds synoptic and dust storm of April and May in Yazd. First National Conference of Wind Erosion, Yazd.
Orlovsky, L., N. Orlovsky and A. Durdyev, 2004. Dust storms in Turkmenistan. Journal of Arid Environments, 60: 83-97.
Refahi, H., 1999. Wind erosion. University of Tehran press, Tehran.
Saremi Nayini, M.A., 2006. Comparative analyses on spatial distribution of wind rose, storm rose and sand rose in wind erosion studies of Yazd plains lands- Ardakan using GIS technique. M.Sc. Thesis. University of Tehran.