DYNAMICAL ANALYSIS AND DESIGN OF FRONT ENGINE ACCESSORY DRIVE SYSTEM
Department of Automotive Engineering Iran University Science and Technology
Department of Automotive Engineering Iran University Science and Technology
Tehran, Iran Tehran, Iran
[email protected] [email protected]
ABSTRACT
In this paper, Front Engine Accessory Drive (FEAD) system of automotive engine is modeled with ADAMS software. The model is validated using engine test data. It is then used to investigate the effect of design parameters on the system performance such as belt vibration and loads on the idlers. Three alternative layouts were developed in order to improve the performance of original EEAD system. The validated model was used to study the effect of changes made to the layouts on the reduction of vibration and loads. Several system outputs indicated that for the modified layouts, large reductions in vibration and loads were achieved. It was concluded that one of proposed layouts was more appropriate and could be a useful substitution to the original layout. The developed model also proved useful for the design of engine FEAD systems and could be used for further developments.
KEY WORDS: FEAD, belt, accessory, engine, vibration.
1. INTRODUCTION
Serpentine belt drives with long, flat, multi-ribbed belts are nowadays widely used in the automobile industry for passenger vehicles and heavy duty trucks. With a single belt, the engine power is delivered from the crankshaft to all of the individual accessories such as air conditioner, alternator and power steering pump. To turn the belt some idler pulleys are used and to maintain proper belt tension as accessory loads and engine speed varies, a spring loaded tensioner is utilized. This system including accessories, belt and tensioner is commonly called Front Engine Accessory Drive (FEAD). In such systems some issues like belt vibration, pulley hubload, belt slip and tensioner pulley displacement are of great importance. These are effective in durability of belt, decreasing engine NVH, torque delivery to accessories without losses and increasing the lifetime of components.
The study on these systems has been considered by several researches. Apart from treating the belt-pulley systems mostly analytically [1, 2] for the developments of the engine FEAD systems more sophisticated software models are implemented. Beikmann et al [3] focused on the design parameters that determine how effectively the tensioner maintains a constant tractive belt tension, despite beltstretch due to accessory loads and belt speed. A nonlinear model predicting the operating state of the belt/tensioner system was derived, and solved using numerical and approximate closed-form methods. According to the results of the closed-form solution they concluded that a single design parameter, referred to as the “tensioner constant,” can measure theeffectiveness of the tensioner. Tension measurements on an experimental drivesystem also confirmed the theoretical predictions.
Downloaded from www.iust.ac.ir at 21:20 IRST on Friday March 3rd 2017
Behrooz Mashadi* * Ehsan Zakeri
* corresponding Author
the belt, which is one cause of belt noise, they found that vibration of the belt was affected by fluctuations in the rotational speed of the crankshaft and that the amplitude of the vibrations fluctuated cyclically. The cycle of this amplitude fluctuation was synchronous with engine speed, and for a 3-cylinder gasoline engine, its frequency was a multiplication of engine rotation order. The spectrum pattern of belt vibration also showed components of the natural frequency with the same orders. They concluded that multiple engine orders excite resonance in the belt, producing a high degree of belt vibration.
Zhu [5] modeled the FEAD system with the objectives of carrying out normal mode analyses on the systems and to make a comparison of the predicted frequencies with those of measurements. The analytical results of three FEAD systems showed that more accurate frequencies were calculated using the complete accessory model than the concentrated mass model.
In the current work the objective is modeling the FEAD system and making it valid by comparing the results with experimental data and then using the model at investigations for other layouts. The FEAD system considered in this work belongs to a typical Turbocharged engine and is modeled with ADAMS software. The experimental test data for the same engine is used to validate the results of the model.
2. MODELING OF FEAD SYSTEM
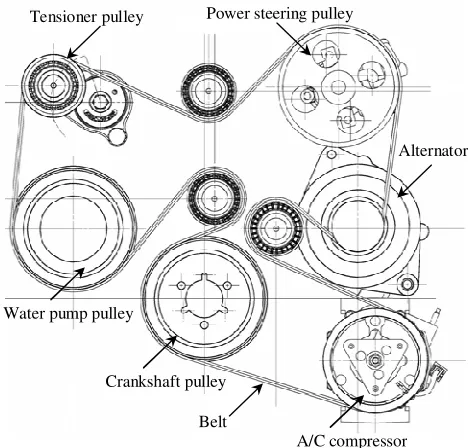
The first step in modeling of FEAD system is packaging work. Figure 1, shows the original layout for the packaging of engine FEAD. According to this model, tensioner is far from crankshaft in slack side of belt. Several test results are necessary for a full investigation of the proper functionality of the system. Non uniformity of crankshaft speed (Fig. 2), torque consumption of accessories (Fig. 3) and inertia of accessories (Table A) are information needed for this purpose. This system is analyzed in full load-ramp (FLR) and part load ramp (PLR).
Figure 1. Layout of FEAD system for a turbocharger engine
Alternator Power steering pulley
Crankshaft pulley
A/C compressor Belt
Water pump pulley Tensioner pulley
Downloaded from www.iust.ac.ir at 21:20 IRST on Friday March 3rd 2017
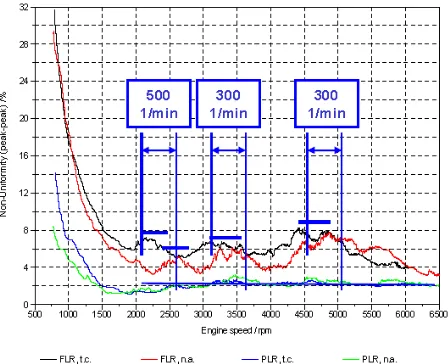
In FLR, the speed of engine run up in 120 seconds from 800 to 6000 rpm and in PLR the engine torque is 30 Nm and speed run up in 120 seconds from 800 to 6000 rpm. For modeling of the system a poly V belt with 6 ribs is used. A Torsional Vibration Damper (TVD) for crankshaft pulley and an automatic tensioner are also included. In Figure 2, the variation of crankshaft non uniformity for a turbocharged engine and a natural aspirated engine in full load ramp and part load ramp are compared. This figure shows that the non uniformity of crankshaft in low rpm of engine is very high because TVD is effective in high rpms. Figure 3 shows torque demands for the accessories versus engine speed. The specifications for all parts of accessory drive system including tensioner and belt stiffness and damping are provided in Table A of Appendix.
Figure 2. Non uniformity of crankshaft
500 1000 1500 2000 2500 3000 3500 4000 4500 5000 5500 6000 6500 7000 0
5 10 15 20 25 30 35 40 45 50
Accessory:
Power steering pump Ac compressor Alternator Water pump
T
o
rq
u
e
[
N
m
]
Engine speed [rpm] Figure 3. Torque consumption
Downloaded from www.iust.ac.ir at 21:20 IRST on Friday March 3rd 2017
3. VALIDATION OF FEAD SYSTEM MODEL
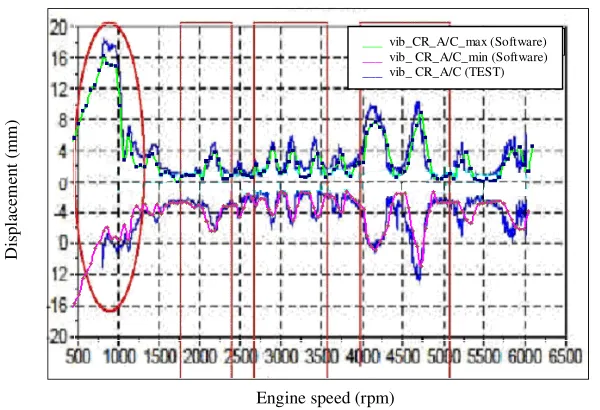
After modeling of FEAD system with ADAMS software, validation with the test data is performed. Test is carried out with real engine in FLR and PLR conditions. In Figure 4, one of the results for belt vibration between A/C compressor and crankshaft can be seen. The maximum difference between results of the model and the test is 5 percent. This difference is believed to be because of tolerances in position of accessories and decreasing of belt elasticity with increasing temperature in engine ramp up. Also this difference in low rpm and high rpm is more than middle rpm. In low rpm the difference is because of initial acceleration and in high rpm the difference is because of time step of software. In ADAMS software time step is fixed, so with increasing rpm, step angle increase and error is more than low rpm.
Other design factors such as pulley hubload, tensioner displacement and belt slip were also compared between test data and model results and similar agreements were observed.
Figure 4. Belt vibration (comparison between results of test and developed model)
4. APPLICATION OF MODEL TO NEW DESIGNS
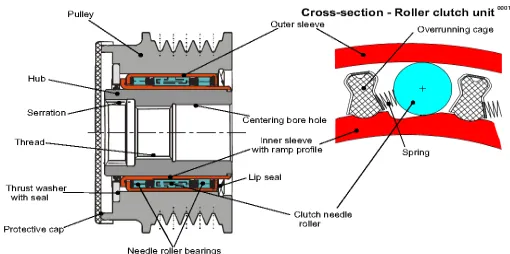
With the inspection of the belt vibration between A/C compressor and crankshaft, one can notice the amplitude of belt vibration is too high (Fig. 4). For decreasing belt vibration between A/C compressor and crankshaft pulley the first proposal is using an Over-running Alternator Pulley (OAP) with schematic shown in Figure 5. This kind of pulley is used for disconnection of alternator shaft and pulley when the belt forces the pulley for reverse rotation, because of fluctuations of the crankshaft. So with using this concept belt vibration and also dynamic belt tension is expected to decrease.
D
is
p
la
ce
m
en
t
(m
m
)
Engine speed (rpm)
___ vib_CR_A/C_max (Software)
___ vib_ CR_A/C_min (Software)
___ vib_ CR_A/C (TEST)
Downloaded from www.iust.ac.ir at 21:20 IRST on Friday March 3rd 2017
Figure 5. Schematic of an Over-running Alternator Pulley (OAP)
After using OAP in accessory belt drive, belt vibration between A/C compressor and crankshaft pulley are according to Figure 6. In this figure belt vibration for original system and new system with using OAP has compared together. According to the figure belt vibration has decreased some 40 percent in rpms lower than 2200 rpm and with increasing rpm of engine, effect of OAP has declined. The reason for decreasing effect of OAP in high rpms is that the spring of OAP is designed to act in low rpms. In fact in low rpms, fluctuation of crankshaft is higher than high rpms, so using OAP is more important at low rpms.
Belt Vibrations
-20 -16 -12 -8 -4 0 4 8 12 16 20
500 1500 2500 3500 4500 5500 6500
Engine Speed (rpm)
D
is
p
la
c
e
m
e
n
t
(
m
m
)
s_CR_A/C
s_CR_A/C(OAP)
Figure 6. Belt vibration (comparison between result with OAP and without OAP)
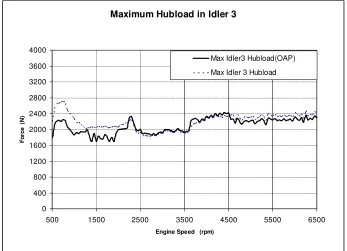
The next item for comparing accessory layout is maximum hubload of idlers which is effective to the lifetime of idlers. In Figures 7and 8, maximum hubload for idlers 2 and 3 are shown. The condition of this test is full engine load with A/C compressor ON, alternator 80A and power steering pump 50 bar. According to figures, the maximum hubload of idlers have decreased some 25 percent in low rpms. This pulley hubload decrease is effective on lifetime of ball bearings.
Downloaded from www.iust.ac.ir at 21:20 IRST on Friday March 3rd 2017
Maximum Hubload in Idler 2
0 400 800 1200 1600 2000 2400 2800 3200 3600 4000
500 1500 2500 3500 4500 5500 6500
Engine Speed (rpm)
F
o
rc
e
(N
)
Max Idler 2 Hubload(OAP)
Max Idler 2 Hubload
Figure 7. Maximum hubload in idler 2 (comparison between result with OAP and without OAP)
Maximum Hubload in Idler 3
0 400 800 1200 1600 2000 2400 2800 3200 3600 4000
500 1500 2500 3500 4500 5500 6500
Engine Speed (rpm)
F
o
rc
e
(N
)
Max Idler3 Hubload(OAP)
Max Idler 3 Hubload
Figure 8. Maximumhubload in idler 3 (comparison between result with OAP and without OAP)
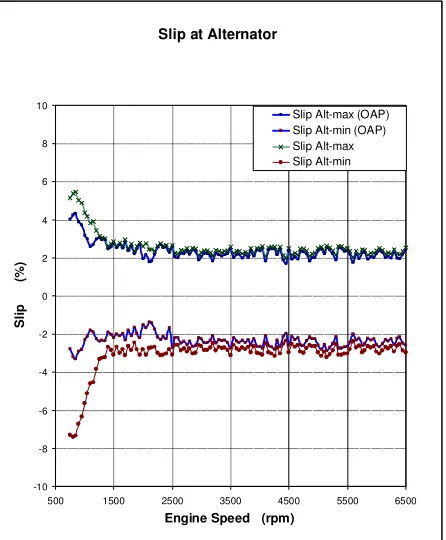
Another item in accessory drive is belt slip which is important because of effect to life time of belt and torque delivery to accessory component. Investigation of this item for alternator is more important relative to other auxiliary drives, because the diameter of alternator pulley is less than others and its moment of inertia is larger than others. In Figure 9 belt slip in alternator pulley with engine full load condition, A/C compressor ON, alternator 80A and
Downloaded from www.iust.ac.ir at 21:20 IRST on Friday March 3rd 2017
power steering pump 50 bar is shown. According to this figure, with using OAP, there is a 20 percent reduction in belt slip at low rpms.
Slip at Alternator
-10 -8 -6 -4 -2 0 2 4 6 8 10
500 1500 2500 3500 4500 5500 6500
Engine Speed (rpm)
S
li
p
(%
)
Slip Alt-max (OAP) Slip Alt-min (OAP) Slip Alt-max Slip Alt-min
Figure 9. Slip at alternator (comparison between result with OAP and without OAP)
5. APPLICATION OF MODEL TO NEW DESIGNS
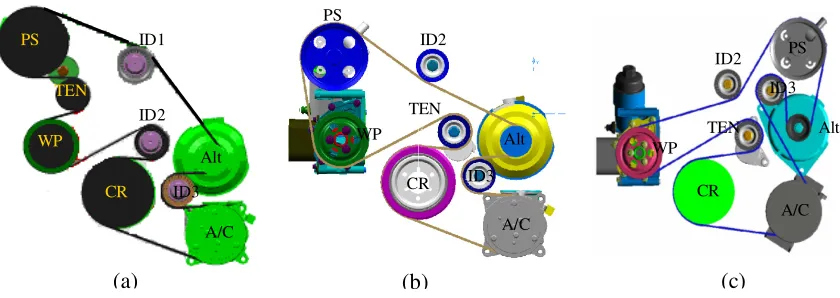
After achieving improvements in accessory drive by the use of OAP, yet another effect can be investigated by changing the layout of the system. In order to reduce belt vibration and pulley hubload, the layout can be modified by changing the position of tensioner and accessories as shown in Figures 10. In Figure 10 (a) wrap angle of A/C compressor, water pump and tensioner have increased. In Figure 10 (b) wrap angle of A/C compressor has increased and the tensioner is in fact positioned nearer to the crankshaft. With this concept, non uniformity of crankshaft is expected to damp out rapidly in FEAD system and the tension in slack side of belt to become more suitable, so that the belt vibration is expected to decrease with this layout.
Downloaded from www.iust.ac.ir at 21:20 IRST on Friday March 3rd 2017
Figure 10. FEAD systemlayouts (a) first, (b) second and (c) third layout
In Figure 10 (c) wrap angle for alternator and water pump have increased and tensioner positioned nearer the crankshaft. This layout has several benefits, for instance the length of belt is decreased, one idler is removed from FEAD system and wrap angle of belt for water pump pulley is increased. Moreover, the torque delivery from crankshaft is more than the original layout.
Result of belt slip for alternator pulley is shown in Figure 11. According to this result, belt slip in second and third layouts has improved about 30 percent relative to first layout. This is because of wrap angle increase in those layouts.
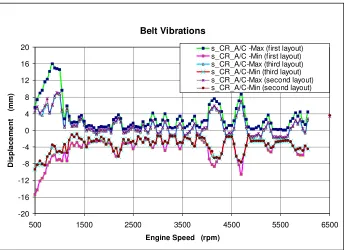
By investigation of belt vibration between A/C compressor and crankshaft in Figure 12, belt vibration for second and third layouts is seen to become better than the first layout, this is beacause of existing a proper tension in slack side of crankshaft with using tensioner in this position.
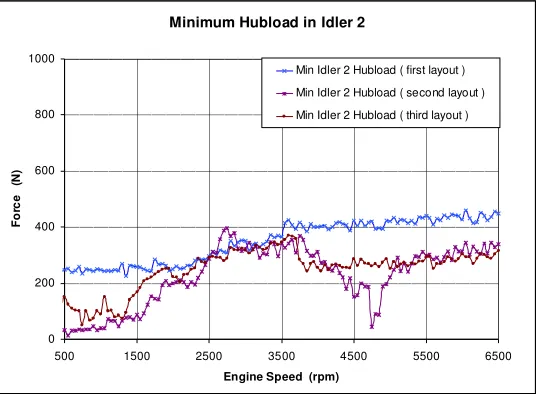
In Figure 13, maximum hubload for idler 3 is shown. With regard to this figure, maximum hubload for idler 3 in layouts 2 and 3 have also decreased. This is because of lower induced torsional vibration and higher damping by using tensioner closer to the crankshaft. Pulley hubload in third layout in rpm lower than 1500 rpm is less than second layout. This is because idler 3 is nearer to crankshaft in layout 2 and receive more torsional vibration. Figure 14 illustrates the minimum hubload for idler 2. In this figure hubload for layouts 2 and 3 is lower relative to layout 1. Hubload in some rpms is close to zero that will lead to jumping the belt out of idler and increasing noise in accessory drive and decreasing the belt life. The reason for this problem is the existence of small wrap angle for idler 2 in the second layout.
PS
Alt
A/C
WP TEN
CR
ID2
ID3 ID1
PS
Alt
A/C WP
TEN
CR ID2
ID3
PS
Alt
A/C WP
TEN
CR ID2
ID3
(a) (b) (c)
Downloaded from www.iust.ac.ir at 21:20 IRST on Friday March 3rd 2017
Figure 11. Slip at alternator (comparison between three layouts)
Belt Vibrations
-20 -16 -12 -8 -4 0 4 8 12 16 20
500 1500 2500 3500 4500 5500 6500
Engine Speed (rpm)
D
is
p
la
c
e
m
e
n
t
(
m
m
)
s_CR_A/C -Max (first layout) s_CR_A/C -Min (first layout) s_CR_A/C-Max (third layout) s_CR_A/C-Min (third layout) s_CR_A/C-Max (second layout) s_CR_A/C-Min (second layout)
Figure 12. Belt vibration (Comparison between three layouts)
Slip at Alternator
-10 -8 -6 -4 -2 0 2 4 6 8 10
500 1500 2500 3500 4500 5500 6500
Engine Speed (rpm)
S
li
p
(%
)
Slip Alt-max (second layout) Slip Alt-min (second layout) Slip Alt-max (first layout) Slip Alt-min (first layout) Slip Alt-max (third layout) Slip Alt-min (third layout)
Downloaded from www.iust.ac.ir at 21:20 IRST on Friday March 3rd 2017
Figure 13. Maximum hubload in idler 3( comparison between three layouts)
Figure 14. Minimum hubload in idler 2( comparison between three layouts)
Table 1 below is constructed in order to summarize the comparison made among the three layouts. According to this table, the third layout is of suitable characteristics.This layout has benefit in all items.
Table 1. Summary of comparisons among the characteristics of the three layouts
Parameter First layout Second layout Third layout
1 Wrap angle between belt and
water pump
+
-+
2 Belt vibration between A/C
compressor and crankshaft -
+
+
3 Minimum hubload of idler 2 - -
+
4 Maximum hubload of idler 3 -
+
++
5 Slip of alternator pulley -
+
+
Minimum Hubload in Idler 2
0 200 400 600 800 1000
500 1500 2500 3500 4500 5500 6500
Engine Speed (rpm)
F
o
rc
e
(
N
)
Min Idler 2 Hubload ( first layout )
Min Idler 2 Hubload ( second layout )
Min Idler 2 Hubload ( third layout )
Maximum Hubload in Idler 3
0 400 800 1200 1600 2000 2400 2800 3200 3600 4000
500 1500 2500 3500 4500 5500 6500
Engine Speed (rpm)
F
o
rc
e
(N
)
Max Idler 3 hubload ( third layout ) Max Idler3 Hubload (first layout) Max Idler 3 Hubload ( second layout )
Downloaded from www.iust.ac.ir at 21:20 IRST on Friday March 3rd 2017
6. APPLICATION OF MODEL TO THE THIRD LAYOUT
According to Table 1, the third layout was chosen among the proposed layouts. The last investigation in this paper would be using this layout together with OAP. This system is
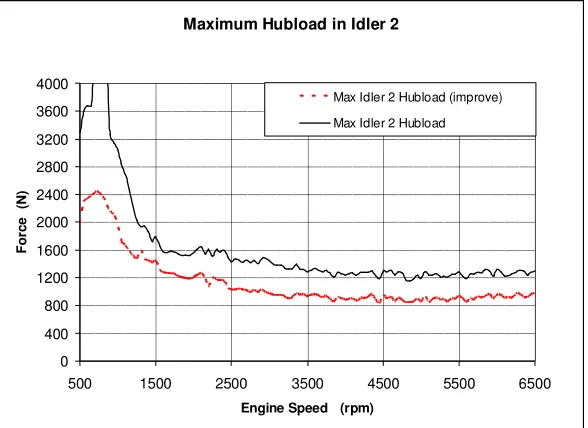
compared with original system for clearer comparison. In Figure 15 the maximum hubload for idler 2 is shown. According to this figure with using
this new layout maximum hubload can be reduced in low rpms up to 40 percent and in high rpms up to 20 percent. In Figure 16 is shown the maximum hubload for idler 3 that demonstrates a near 20 percent decrease in the load.
In Figure 17 the belt slip at crankshaft is shown to decrease close to 25 percent. This is because of using OAP, reducing the belt length and damping vibration of the belt by approaching the tensioner to crankshaft pulley.
The last item for comparison between initial layout and improved layout is belt vibration between A/C compressor and crankshaft pulley which is plotted in Figure 18. According to this figure belt vibration has reduced up to 60 percent for below 2500 rpm and up to10 percent for high speeds.
Maximum Hubload in Idler 2
0 400 800 1200 1600 2000 2400 2800 3200 3600 4000
500 1500 2500 3500 4500 5500 6500
Engine Speed (rpm)
F
o
rc
e
(N
)
Max Idler 2 Hubload (improve)
Max Idler 2 Hubload
Figure 15. Maximum hubload in idler 2( comparison between initial layout and improve layout)
Downloaded from www.iust.ac.ir at 21:20 IRST on Friday March 3rd 2017
Maximum Hubload in idler 3
0 400 800 1200 1600 2000 2400 2800 3200 3600 4000
500 1500 2500 3500 4500 5500 6500
Engine Speed (rpm)
F
o
rc
e
(N
)
Max Idler3 Hubload (improve)
Max Idler3 Hubload
Figure 16. Maximum hubload in idler3( comparison between initial layout and improve layout)
Belt Slip at Crankshaft
-10 -8 -6 -4 -2 0 2 4 6 8 10
500 1500 2500 3500 4500 5500 6500
Engine Speed (rpm)
S
li
p
(%
)
Slip CR-max Slip CR-min Slip CR-max (improve) Slip CR-min (improve)
Figure 17. Belt slip at crankshaft( comparison between initial layout and improve layout)
Downloaded from www.iust.ac.ir at 21:20 IRST on Friday March 3rd 2017
Belt Vibrations
-20 -16 -12 -8 -4 0 4 8 12 16 20
500 1500 2500 3500 4500 5500 6500
Engine Speed (rpm)
D
is
p
la
c
e
m
e
n
t
(
m
m
)
s_CR_A/C s_CR_A/C s_CR_A/C(improve) s_CR_A/C(improve)
Figure 18. Belt vibration( comparison between initial layout and improve layout)
7. CONCLUSIONS
In this paper a sophisticated FEAD model was developed in ADAMS environment and generated results were validated by actual engine test results with close agreements of maximum 5 percent differences. The model was used to investigate the effect of different design issues and in one case with application of modifications to the layout, several benefits were achieved.
The results of the model generated in FLR and PLR for belt vibration, pulley hubload and belt slip have shown improvements for the chosen layout relative to original design of the engine FEAD system. These can summarized as:
(a) Reducing the hub load of idler 2 up to 40 percent at low speeds and up to 20 percent at high speeds. Also decrease in hub load of idler 3 up to 20 percent has been achieved. This improvement helps increasing the life time of idler bearing.
(b) Reducing up to 25 percent in belt slip with using the enhanced layout. This parameter helps to increase life time of belt and reduce the noise and increase the torque delivery to the consumers.
(c) Reducing the belt vibration between A/C compressor and crankshaft pulley up to 60 percent below 2500 rpm and up to 10 percent at high speeds. This item decreases risk of belt jumping and improves belt life time and noise.
Based on these results and with further consideration of the cost reduction inherent in the improved layout due to fewer idlers and smaller belt length, this layout has several advantages relative to original layout.
Downloaded from www.iust.ac.ir at 21:20 IRST on Friday March 3rd 2017
8. REFERENCES
[1] Lingyuan Kong and Robert G. Parker, Coupled Belt-Pulley Vibration in Serpentine Drives With Belt Bending Stiffness, Journal of Applied Mechanics, 2004, Vol. 71, pp. 109-120.
[2] LI Xiao-jun and Chen Li-qun, Modal analysis of coupled vibration of belt drive systems, Journal of Applied Mathematics and Mechanics, 2008, Vol. 29(1), pp. 9–13.
[3] R. S. Beikmann, N. C. Perkins and A. G. Ulsoy, Design and Analysis of Automotive Serpentine Belt Drive Systems for Steady State Performance, Journal of Mechanical Design, June 1997, Volume 119, Issue 2, 162, doi:10.1115/1.2826231
[4] Motoyasu Sakaguchi, Tomoaki Nishio, Toshimitsu Shinohara and Hiroshi Takagishi, Study of the Mechanism of Accessory Drive Belt Noise, SAE International Journal of Passenger Cars- Mechanical Systems October 2009 vol. 2 no. 1 434-439
[5] H Zhu, Finite element modal analysis of the engine front end accessory drive systems, Proceedings of the Institution of Mechanical Engineers, Part D: Journal of Automobile Engineering, Volume 208, Number D1 / 1994, pp 49-53
Downloaded from www.iust.ac.ir at 21:20 IRST on Friday March 3rd 2017
Appendix. Accessory drive specifications
Information used in the ADAMS model of the FEAD system is provided in Table A. Table A. Model information
No. Part Name Specifications
1
Vibration Damper
Pulley
1-Pitch Diameter 140 mm.
2-Mass 6 Kg.
3-Ixx, Ixy, Ixz, Iyy, Iyz, Izz 1000,0,0,1000,0,500 4.Speed fluctuation According to figure (2)
2
Water Pump Pulley
1-Pitch Diameter 140 mm.
2-Mass 0.05Kg.
3-Ixx, Ixy, Ixz, Iyy, Iyz, Izz 100,0,0,100,0,50 4- Torque consumption According to figure(3)
3
Power Steering Pump Pulley
1-Pitch Diameter 141.5 mm.
2-Mass 0.1 Kg.
3-Ixx, Ixy, Ixz, Iyy, Iyz, Izz 200,0,0,200,0,100 4-Torque consumption According to figure(3)
4
Alternator Pulley
1-Pitch Diameter 54.3 mm.
2-Mass 0.15 Kg.
3-Ixx, Ixy, Ixz, Iyy, Iyz, Izz 600,0,0,600,0,300 5-Torque consumption According to figure(3)
5
AC-Compressor
Pulley
1-Pitch Diameter 119 mm.
2-Mass 0.15 Kg.
3-Ixx, Ixy, Ixz, Iyy, Iyz, Izz 200,0,0,200,0,100 5-Torque consumption According to figure(3)
6
Tensioner Pulley
1-Width 26 mm
2- Radius 35 mm
3-Mass 0.1Kg.
4-Ixx, Ixy, Ixz, Iyy, Iyz, Izz 0.2,0,0,0.2,0,0.1
7 Tensioner
1-Length 58 mm
2-Installation Angle 17.8 °
3-Damping 0.06
4-Stiffness 514.71
6-Mass 0.05 Kg.
7-Ixx, Ixy, Ixz, Iyy, Iyz, Izz 20,0,0,20,0,10
8 Idler-1
1-Width 26 mm
2- Radius 32.5 mm
3-Mass 0.05Kg.
4-Ixx, Ixy, Ixz, Iyy, Iyz, Izz 20,0,0,20,0,10
9 Idler - 2
1-Width 26 mm
2- Radius 32.5 mm
3-Mass 0.05Kg.
Downloaded from www.iust.ac.ir at 21:20 IRST on Friday March 3rd 2017
Table A. Continued
10 Idler - 3
1-Width 26 mm
2- Radius 32.5 mm
3-Mass 0.05Kg.
4-Ixx, Ixy, Ixz, Iyy, Iyz, Izz 20,0,0,20,0,10
11 Belt
1-Segment Length 9.78 mm
3-Nominal Height 4.8 mm
4-Cordial Distance 1.2 mm
5-Rib Height 2.3 mm
6-Rib Width 3.53 mm
7-Rib Angle 40°
8-Belt Width 24 mm
9-Mass of segment 6.324E-4 kg
10-Segment Mass Properties (Ixx,
Iyy, Izz) 2.55E-2,2.6E-2,2.1E-3
12-Segment Area 87.6 mm2
14-Stiffness (E×A) 120000 N
15-Damping Rate 3E-4
22-Static Friction Coefficient 2 24-Dynamic Friction Coefficient 1.6
Downloaded from www.iust.ac.ir at 21:20 IRST on Friday March 3rd 2017