R E S E A R C H A R T I C L E
Open Access
Simultaneous determination of tylosin and
josamycin residues in muscles, liver, eggs and
milk by MLC with a monolithic column and
time-programmed UV detection: application to
baby food and formulae
Jenny Jeehan Nasr
*, Shereen Shalan and Fathalla Belal
Abstract
Background:Tylosin and Josamycin are macrolide antibiotics. They are used in the treatment of pneumonia, arthritis and mastitis in cattle, and mycoplasma infections in poultry. The incorrect use of antibiotics has lead to the presence of antibiotic residues in foods. The residues cause toxic effects on consumers.
Results:A simple and sensitive method was optimized and validated for the analysis of tylosin and josamycin residues in food samples. Analytical separation was performed in less than 10 min using a RP C18monolithic
column with time-programmed UV detection at 287 nm and 232 nm and a micellar solution of 0.17 M sodium dodecyl sulphate, 14% methanol and 0.3% triethylamine in 0.02 M phosphoric acid buffered at pH 4 as the mobile phase. The method was fully validated in accordance with ICH guidelines. The micellar method was successfully applied to quantitatively determine tylosin and josamycin residues in spiked chicken muscles, chicken liver, bovine muscles, liver, milk and eggs. It was also extended to the determination of tylosin and josamycin residues in chicken-based baby food and baby formulae. The compounds were separated by a monolithic column which, on account of its particular structure, could bear higher flow rates than usually found for this kind of analysis. High extraction efficiency for tylosin and josamycin was obtained without matrix interference in the extraction process and in the subsequent chromatographic determination. No organic solvent was used during the pretreatment step. Hence, it is considered an interesting technique for“green”chemistry.
Conclusion:The proposed method was validated and successfully applied for the determination of tylosin and josamycin residues in spiked chicken muscles, chicken liver, bovine muscles, liver, milk and eggs. It was also extended to the determination of tylosin and josamycin residues in chicken-based baby food and baby formulae.
Keywords:Micellar liquid chromatography, Tylosin, Josamycin, Monolithic column, Chicken muscles, Eggs
* Correspondence:[email protected]
Department of Pharmaceutical Analytical Chemistry, Faculty of Pharmacy, University of Mansoura, Mansoura 35516, Egypt
Background
Macrolide antibiotics are a very important class of anti-bacterial compounds widely used in human and veterin-ary practices for both therapeutic and prophylactic treatments [1]. They are active agents against Gram-positive and some Gram-negative bacteria [2]. Macro-lides are also employed as growth promoters in stock farming in food producing animals [3].
Tylosin (TS) and josamycin (JM) (Figure 1) belong to the class of 16-membered macrolide antibiotics [4]. They are used in the treatment of pneumonia, arthritis and mastitis in cattle, and mycoplasma infections in poultry [5,6]. The incorrect use of antibiotics and the disrespect for withdrawal time after treatment have lead to the presence of antibiotic residues in foods. The residues cause toxic effects on consumers, such as allergic reac-tions in sensitive or sensitized individuals, provoke the development of antibiotic-resistant bacteria and may in-duce cross-resistance against other antibiotics of similar structure or mechanism of action, making it more diffi-cult to treat certain infections [7]. To ensure human food safety, the European Union (EU) has set maximal residue limits (MRLs) for some macrolides in tissues and eggs. EU has established a maximum residue limit of 100 μg/Kg of TS and 200μg/Kg of JM in bovine and chicken tissues and 200 μg/Kg of each of TS and JM in eggs and 50μg/Kg of TS in milk [8,9]. Therefore, simple and reliable analytical methods are required to monitor these drug residues in edible tissues of livestock animals. There is no current legislation which establishes limits of veterinary drug residues in meat-based baby food and baby formulae. As a result of this lack of regulations for veterinary drugs, a zero-tolerance policy is applied for veterinary drug residues in baby food and formulae [10] which means that the presence of these compounds is il-legal at any level. Therefore, the application of the“zero
tolerance” concept requires the development of sensitive analytical methods to determine the presence of these compounds at very low concentration levels [11].
Literature revealed several HPLC methods for the sim-ultaneous determination of TS and JM residues in muscle tissues. TS and JM residues were determined to-gether with other macrolide antibiotics in meat [12], bo-vine, porcine and poultry muscles [13] using UV detection. They were also determined in sheep’s milk using UV-diode array detector [14]. Liquid chromatog-raphy coupled with electrospray ionization tandem mass spectrometry was used for the determination of TS and JM residues among other veterinary drugs in bovine, porcine and chicken muscles [15] and with other macro-lide antibiotics in meat and fish [16]. HPLC [17,18] and UPLC [11] coupled with tandem mass spectrometry were also used.
Micellar liquid chromatography (MLC) allows com-plex matrices to be analyzed without the aid of extrac-tion and with direct injecextrac-tion of samples [19]. Micelles tend to bind proteins competitively, thereby releasing protein-bound drugs and proteins, rather than precipi-tating into the column. Proteins are solubilized and washed harmlessly away, eluting with the solvent front. This means that costs and analysis times are cut consid-erably [20]. Micellar mobile phases usually need less quantity of organic modifier and generate less amount of toxic waste in comparison to aqueous-organic solvents, so that they are less toxic, non-flammable, biodegradable and relatively inexpensive [21]. Because of these advan-tages, MLC is considered an interesting technique for
“green”chemistry that copes with current concern about the environment [22]. MLC has proved to be a useful technique in the determination of diverse groups of compounds in several matrices [23-25], including food samples [26,27].
Nowadays, the most challenging trend in liquid chro-matography is the development of new sorbents, which are able to separate complicated substances efficiently. One of these novel types of sorbents is monolithic silica. They have a different structure compared to conven-tional silica [28]. Monolithic columns contain a special silica (or another material), which is not formed by par-ticles. They are made by sol–gel technology, which en-ables formation of highly porous material, containing macropores and mesopores in its structure [28]. Due to these facts, higher flow rates can be used while the reso-lution of the silica rod column is much less affected in comparison to particulate materials after increasing the flow-rate and column back-pressure is still low. Another practical advantage is a short time needed for column equilibration when a mobile phase gradient is used [29]. There are a few works that deal with the practical appli-cation of monolithic columns in LC [30,31].
The present study describes, for the first time, a rapid, simple, sensitive and selective MLC–monolithic method with UV detection for the simultaneous determination of TS and JM residues in chicken muscles, chicken liver, bovine meat, liver, eggs and milk. The proposed proced-ure benefits from the two main advantages associated to the use of micellar mobile phases, namely, the use of environment-friendly eluents and fast and easy sample preparation. The procedure makes use also of the main advantage of monolithic columns which is the use of high flow rate without increasing the column back pres-sure. The procedure could also be extended to the ana-lysis of these residues in chicken or meat-based baby food in addition to baby formulae.
Experimental
Apparatus
Chromatographic analyses were carried out using a Shimadzu Prominence HPLC system (Shimadzu Corpor-ation, Japan) with a LC-20 AD pump, DGU-20 A5 degasser, CBM-20A interface, and SPD-20A UV–VIS de-tector with 20μL injection loop. The columns used were reversed-phase Chromolith® Performance (RP-18e, 100 mm × 4.6 mm i.d.) column obtained from Merck (Darmstadt, Germany) and Nucleodur MN-C18 column (150 mm × 4.6 mm i.d., 5μm particle size), Macherey-Nagel, Düren, Germany. Centrifugation was carried out using TDL-60B Centrifuge (Anke, Taiwan). BHA-180 T Sonicator (Abbotta Corporation, USA) was used. Tissue homogenization was made using Tissue Master-125 Homogenizer (Omni Inter-national, Georgia, USA).
Reagents and materials
All reagents and solvents used were of HPLC grade. Tylosin tartrate and Josamycin analytical standard was of 100% purity from Sigma-Aldrich (Seelze, Germany).
Methanol, 1-propanol, acetonitrile and sodium dodecyl sulphate (SDS) were from Sigma-Aldrich (Seelze, Germany). Triethylamine and phosphoric acid were from Riedel-deHaën (Seelze, Germany). Regenerated cel-lulose membrane filters and syringe filters (Minisart RC25) with pore size 0.45 μm were from Sartorius-Stedim (Goettingen, Germany). Chicken muscles, chicken liver, bovine meat and liver samples and eggs were pur-chased from the local market. Milk was from Juhayna® (Cairo, Egypt) and Infant Formula Milk was from Hero® (Spain). Chicken noodles baby food, precooked, was from Gerber® (USA).
Preparation of solutions
Stock solutions of 0.2 mg mL−1of each TS and JM were prepared by dissolving in methanol. Working solutions were prepared by diluting the stock solutions with the mobile phase. Stock solutions were found to be stable for one week if kept in the refrigerator protected from light.
Preparation of calibration curves
Working solutions containing 1–200μg mL−1of TS and 5 –500μg mL−1of JM were prepared by serial dilutions of aliquots of the stock solutions. 20 μL aliquots were injected (triplicate) and eluted with the mobile phase under the reported chromatographic conditions. The aver-age peak areas of each drug were plottedversusthe con-centrations of drug in μg mL−1. Alternatively, the corresponding regression equations were derived.
Analysis of bulk substance
The method mentioned under the previous section was applied to the determination of the purity of TS and JM raw materials. The percentage recoveries were calculated by referring to the calibration graphs previously pre-pared or by applying the regression equations.
Samples preparation
Results and discussion
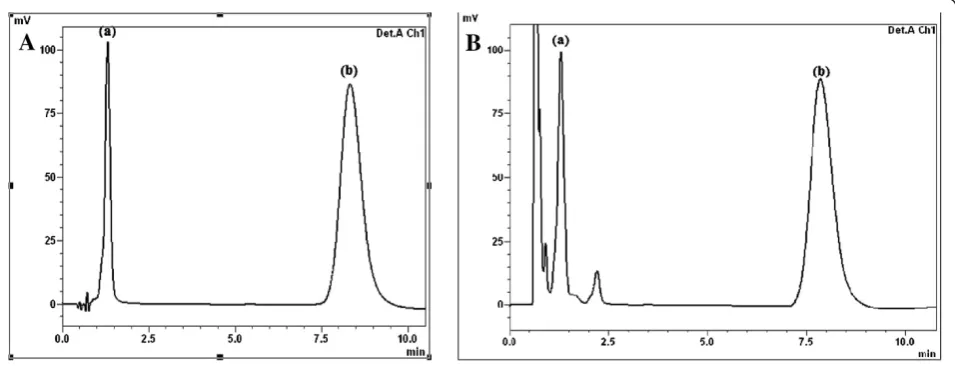
The proposed method permits the quantitation of TS and JM in raw materials, in chicken muscles, chicken liver, bovine meat, liver and eggs. Figure 2A shows a chromatogram indicating good resolution of TS (tR =
1.4 min) and JM (tR = 8.6 min). The proposed method
offers high sensitivity: as low as 0.11μg mL−1of TS and 0.30μg mL−1of JM could be detected accurately.
Selection and optimization of chromatographic conditions
To achieve the best chromatographic conditions, the mobile phase composition was optimized to provide suf-ficient selectivity and sensitivity in a short separation time. The different chromatographic conditions affecting the separation and resolution of TS and JM were care-fully studied and optimized. The results of the optimiza-tion study are summarized in Table 1.
Choice of column
Two different columns were tested for performance inves-tigations, including: reversed-phase Chromolith® Perform-ance C18 column, and Nucleodur MN-C18 column. The experimental studies revealed that the first column was more suitable, since it produced well-resolved peaks with a very high sensitivity within a reasonable analytical run time.
Choice of appropriate detection wavelength and time program
The UV detector responses of TS and JM were carefully studied and the best wavelengths were found to be 287 nm and 232 nm for TS and JM, respectively show-ing the highest sensitivity. Programmable UV detection was employed to allow sensitive determination of both TS and JM simultaneously. TS was detected at 287 nm
within 0–5 min, while, JM was detected at 232 nm after 5 min.
Choice of a suitable flow rate
As the peak of JM was very late at flow rate 1 mL min−1, a flow rate of 2 mL min−1was chosen in order to have a reasonable analytical run time (10 min) for the assay. The use of this considerably high flow rate was possible due to the use of a monolithic column which has the ad-vantage of using high flow rates without affecting the column back pressure.
Mobile phase composition
Several modifications in the micellar mobile phase com-position were performed in order to study the possibil-ities of changing the selectivity of the chromatographic system. These modifications included the change of the concentration and type of organic modifier, the surfac-tant concentration, and the pH. The mobile phase was prepared using 0.3% triethylamine and 0.02 M phos-phoric acid. The effect of changing the type of organic modifier on the selectivity and retention times of TS and JM was investigated using mobile phases containing 10% methanol, 1-propanol or acetonitrile. Methanol was the best, giving well-resolved peaks and the highest number of theoretical plates. The effect of changing the concen-tration of organic modifier on the selectivity and reten-tion times of TS and JM was investigated using mobile phases containing concentrations of 10–16% methanol and containing 0.15 M SDS and buffered at pH 4. 14% of methanol was the best, giving well-resolved peaks and the highest number of theoretical plates. Hence, a small amount of methanol is added to accelerate and control the elution of the drug. The effect of changing the con-centration of surfactant on the selectivity and retention times of TS and JM was investigated using mobile
phases containing SDS concentrations in the range 0.1– 0.2 M and containing 14% methanol and buffered at pH 4. 0.17 M SDS was the best, giving well-resolved peaks and highest number of theoretical plates. The effect of changing the pH of the mobile phase on the se-lectivity and retention time of TS and JM was investi-gated using mobile phases of pH ranging from 2.5–5.0 with 0.17 M SDS concentration and 14% methanol. pH of 4.0 was most appropriate, giving well-resolved peaks and the highest number of theoretical plates. Values of pH higher than 5.0 resulted in very low number of the-oretical plates.
After these experimental investigations, the assay was carried out using a Chromolith® Performance C18 col-umn with mobile phase consisting of 0.17 M sodium dodecyl sulphate–14% methanol–0.3% triethylamine– 0.02 M phosphoric acid at pH 4.0 and programmable UV detection with a flow rate of 2.0 mL min−1.
System suitability test parameters
To ascertain the reproducibility of the MLC method, system suitability tests were performed using the work-ing standard solutions of TS and JM. Resolution (Rs),
theoretical plates number (N) and tailing factor (T) were measured as the criteria for system suitability testing. These results are satisfactory compared to the minimum values necessary for an acceptable method.
Method validation
The validity of the proposed MLC method was tested in terms of linearity, ranges, limits of detection, limits of quantification, accuracy and precision.
Linearity and range
Under the above-described experimental conditions, lin-ear relationships were established by plotting peak areas against TS and JM concentrations. The concentration ranges were found to be 1–200 μg mL−1 and 5– 500μg mL−1for TS and JM, respectively. Linear regres-sion analysis of the data gave the following equations:
TS: P ¼ −3:4103þ 9:9103C ðr ¼ 0:9999Þ
JM: P ¼ 1:2105þ 1:3104C ðr ¼ 0:9999Þ
Where P is the peak area and C is the concentration of drug inμg mL−1and r is the regression coefficient.
The high values of the correlation coefficients (r-values >0.999) indicate good linearity of the calibration graphs. Statistical analysis of the data gave small values of the % relative error, (% Er) 1.21% and 0.56% for both TS and JM, respectively [29].
Limit of quantitation (LOQ) and limit of detection (LOD)
The limit of quantitation (LOQ) was determined by estab-lishing the lowest concentration that can be measured Table 1 Optimization of experimental factors affecting the
chromatographic performance of the proposed method Parameter Number of theoretical
plates (N)
Tailing factor
Resolution (Rs)
TS JM TS JM TS/JM
Organic modifier nature
Methanol 7566 12598 1.06 1.10 11.10
1-Propanol 5974 12154 1.16 0.20 16.40
Acetonitrile 4253 9098 1.10 0.10 14.10
Methanol concentration (%)
8 3791 9496 1.05 1.09 9.97
10 5566 11598 1.06 1.10 11.10
12 4770 10204 1.17 1.24 11.42
14 7312 12723 1.09 1.10 11.16
16 4549 9675 1.21 1.31 11.80
SDS concentration (M)
0.10 4317 8931 1.20 1.24 12.72
0.12 5800 9848 1.20 1.28 12.07
0.15 5312 10723 1.21 1.21 11.67
0.17 7516 12973 1.09 1.13 10.81
0.20 3429 10814 1.19 1.05 10.76
pH
2.5 4247 9564 1.18 1.24 12.83
3.0 5985 10611 1.17 1.23 12.89
4.0 7516 12973 1.08 1.13 10.84
5.0 4830 11349 1.19 1.14 11.80
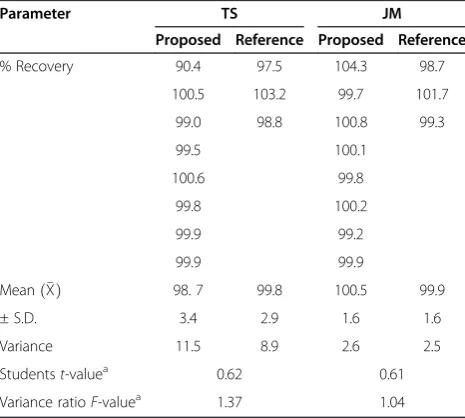
Table 2 Statistical analysis of the results obtained by the proposed and reference methods for pure samples of tylosin and josamycin
Parameter TS JM
Proposed Reference Proposed Reference
% Recovery 90.4 97.5 104.3 98.7
100.5 103.2 99.7 101.7
99.0 98.8 100.8 99.3
99.5 100.1
100.6 99.8
99.8 100.2
99.9 99.2
99.9 99.9
Meanð ÞX 98. 7 99.8 100.5 99.9
± S.D. 3.4 2.9 1.6 1.6
Variance 11.5 8.9 2.6 2.5
Studentst-valuea 0.62 0.61
Variance ratioF-valuea 1.37 1.04
a
according to ICH Q2B recommendations [32] below which the calibration graph is non linear and was found to be 3.6 μg g−1and 9.9μg g−1for TS and JM, respect-ively. The limit of detection (LOD) was determined by establishing the minimum level at which the analyte can be reliably detected (S/N = 3); it was found to be
1.1μg g−1(1.0 × 10⁻⁷M) and 3.0μg g−1(3.6 × 10⁻⁷M) for TS and JM, respectively.
Accuracy
The accuracy of analytical method is defined as the agree-ment of the results obtained by this method with the true values. To test the validity of the proposed method, it was applied to the determination of pure samples of TS and JM over the range of 1.0–200.0 μg mL−1 and 5.0– 500.0μg mL−1, respectively. The results obtained were in good agreement with those obtained using the compari-son HPLC method [13]. Using Student’s t-test and the variance ratio F-test revealed no significant difference be-tween the performance of the two methods regarding the accuracy and precision, respectively (Table 2) [33].
Precision
The intra-day precision was evaluated through replicate analysis of different concentrations of the two drugs pure forms within the specific working concentration ranges. Each sample was analyzed three successive times. Table 3 Accuracy and precision data for tylosin and
josamycin using the proposed method Analyte Concentration
(μg mL−1)
Intra-daya Inter-dayb
Recovery (mean ± S.D.)
Er (%) Recovery (mean ± S.D.)
Er (%)
Tylosin 50.0 99.8 ± 0.2 0.1 99.1 ± 0.6 0.4
100.0 99.5 ± 0.6 0.4 100.2 ± 0.4 0.2
150.0 99.6 ± 0.6 0.3 99.7 ± 0.5 0.3
Josamycin 50.0 100.8 ± 0.3 0.2 100.3 ± 0.3 0.2
125.0 99.6 ± 0.5 0.3 100.9 ± 0.4 0.2
250.0 99.7 ± 0.5 0.3 99.6 ± 0.6 0.4
N.B. Each result is the average of three separate determinations. a
Intra-day: within the day. b
Inter-day: three consecutive days.
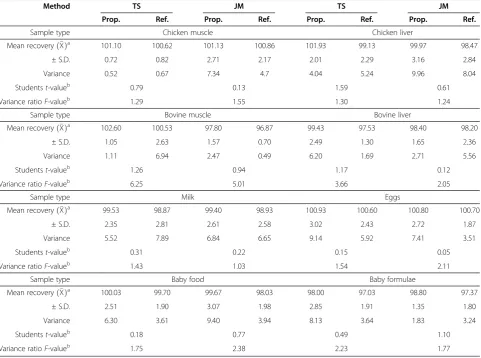
Table 4 Assay of tylosin and josamycin in food samples using the proposed and reference methods
Method TS JM TS JM
Prop. Ref. Prop. Ref. Prop. Ref. Prop. Ref.
Sample type Chicken muscle Chicken liver
Mean recoveryð ÞXa 101.10 100.62 101.13 100.86 101.93 99.13 99.97 98.47
± S.D. 0.72 0.82 2.71 2.17 2.01 2.29 3.16 2.84
Variance 0.52 0.67 7.34 4.7 4.04 5.24 9.96 8.04
Studentst-valueb 0.79 0.13 1.59 0.61
Variance ratioF-valueb 1.29 1.55 1.30 1.24
Sample type Bovine muscle Bovine liver
Mean recoveryð ÞXa 102.60 100.53 97.80 96.87 99.43 97.53 98.40 98.20
± S.D. 1.05 2.63 1.57 0.70 2.49 1.30 1.65 2.36
Variance 1.11 6.94 2.47 0.49 6.20 1.69 2.71 5.56
Studentst-valueb 1.26 0.94 1.17 0.12
Variance ratioF-valueb 6.25 5.01 3.66 2.05
Sample type Milk Eggs
Mean recoveryð ÞXa 99.53 98.87 99.40 98.93 100.93 100.60 100.80 100.70
± S.D. 2.35 2.81 2.61 2.58 3.02 2.43 2.72 1.87
Variance 5.52 7.89 6.84 6.65 9.14 5.92 7.41 3.51
Studentst-valueb 0.31 0.22 0.15 0.05
Variance ratioF-valueb 1.43 1.03 1.54 2.11
Sample type Baby food Baby formulae
Mean recoveryð ÞXa 100.03 99.70 99.67 98.03 98.00 97.03 98.80 97.37
± S.D. 2.51 1.90 3.07 1.98 2.85 1.91 1.35 1.80
Variance 6.30 3.61 9.40 3.94 8.13 3.64 1.83 3.24
Studentst-valueb 0.18 0.77 0.49 1.10
Variance ratioF-valueb 1.75 2.38 2.23 1.77
a
Number of experiments = 3. b
Similarly, the inter-day precision was evaluated through replicate analysis of the three different concentrations on three successive days. The results obtained are sum-marized in Table 3. The data presented in Table 3 indi-cate high precision of the developed method. Good values of the average percentage recoveries and the small values of standard deviations indicate the high accuracy and precision, respectively.
Applications
The applicability of the procedure developed here to de-termine TS and JM was tested by analyzing it in spiked chicken muscles, liver, bovine meat, liver, eggs and milk in addition to spiked baby formula milk and chicken-based baby food. All samples were bought at a local supermar-ket. Table 4 shows the results of the analysis of TS and JM determined in all samples after homogenization with mi-cellar solution, sonication, centrifugation and filtration. Samples were spiked at the following concentration levels: 50, 100 and 150 ppm for TS and 50, 125 and 250 ppm for JM. Three replicates of each concentration were injected into the chromatograph. The data obtained (Table 4) show satisfactory recoveries for TS and JM in all samples, and the results fall in the range of 98.00–102.60% and 97.80– 101.13% for TS and JM, respectively.
Figures 2B and 3 depict the chromatograms obtained from different spiked samples of TS and JM analyzed with the optimum mobile phase. These chromatograms reveal how a surveillance programme for TS and JM res-idues can be performed under the proposed chromato-graphic conditions. The low detection limits of the proposed method are useful for the determination of any traces of TS and JM residues that are prohibited in meat or chicken-based baby food and baby formula milk.
Conclusion
The proposed procedure is useful for food quality testing and control areas to determine the content of TS and JM in chicken muscles, liver, bovine muscles, liver, milk and egg samples. Moreover, it allows the detection of traces of TS and JM residues in meat or chicken-based baby food and baby formula milk with high sensitivity. One advan-tage of this procedure is the possibility of injecting the samples directly into the chromatographic system with no previous treatment other than homogenization, dilution and filtration, thus avoiding tedious extractions from matrices. Validation according to ICH regulation provides satisfactory results in terms of sensitivity, linearity, accur-acy and recoveries and at the ppm level. It is noteworthy that the use of micellar mobile phases endows the proced-ure advantages such as non flammability, biodegradability and low cost. Current concern about the environment also reveals MLC as an interesting technique for “green” chemistry because it uses mobile phases containing low
amounts of organic solvents. These micellar mobile phases have a low toxicity and are not producing hazard-ous wastes. It can be also concluded that, under our con-ditions, the monolithic column could operate at a higher flow rate than a conventional RP column with a reduced pressure and shorter washing and re-equilibration times.
Abbreviations
TS:Tylosin; JM: Josamycin; MLC: Micellar liquid chromatography; LOD: Limit of detection; LOQ: Limit of quantification.
Competing interests
The authors declare that they have no competing interests.
Authors’contributions
JJN proposed the subject, participated in the study design, assay design, literature review, conducted the validation of the assay, analysis of the samples, participated in the results discussion and participated in preparing the manuscript. ShSh participated in the study design, assay design, conducted the validation of the assay, analysis of the samples and participated in the results discussion. FFB designed the study, participated in the results discussion and revised the manuscript. All authors read and approved the final manuscript.
Acknowledgements
This work was supported by L’Oréal-UNESCO Pan Arab Fellowship‘For Women in Science’2010, in partnership with the Arab Science and Technology Foundation (ASTF).
Received: 18 April 2014 Accepted: 13 June 2014 Published: 20 June 2014
References
1. McGlinchey TA, Rafter PA, Regan F, McMahon GP:A review of analytical methods for the determination of aminoglycoside and macrolide residues in food matrices.Anal Chim Acta2008,624:1–15.
2. Fischer WJ, Schilter B, Tritscher AM, Stadler RH:Contaminants of Milk and Dairy Products: Contamination Resulting from Farm and Dairy Practices. InEncyclopedia of Dairy Sciences.2nd edition. San Diego: Academic Press; 2011:887–897.
3. González de la Huebra MJ, Vincent U, VonHolst CJ:Sample preparation strategy for the simultaneous determination of macrolide antibiotics in animal feeding stuffs by liquid chromatography with electrochemical detection (HPLC-ECD).J Pharm Biomed Anal2007,43:1628–1637. 4. Ōmura S:Macrolide Antibiotics: Chemistry, Biology and Practice.2nd edition.
CA; USA: Academic Press; 2002:145.
5. Prescott JF, Baggot JD (Eds):Antimicrobial Therapy in Veterinary Medicine.
Ames; IA: Iowa State University Press; 1993:193.
6. Gomis DB, Ferreras AIA, ÁLvarez MDG, García EA:Determination of spiramycin and josamycin in milk by HPLC and fluorescence detection.
J Food Sci2004,69:C415–C418.
7. Roberts MC:Resistance to macrolide, lincosamide, streptogramin, ketolide and oxazolidinone antibiotics.Mol Biotech2004,28:47–62. 8. The European Agency for the Evaluation of Medicinal products, Veterinary
Medicines Evaluation Unit: 1998, EMEA/MRL/461/98-Final.
9. The European Agency for the Evaluation of Medicinal products, Veterinary Medicines Evaluation Unit: 2000, EMEA/MRL/732/00-Final.
10. Rodríguez E, Moreno-Bondi MC, Marazuela MD:Development and validation of a solid-phase extraction method coupled to liquid chromatography with fluorescence detection for the determination of fluoroquinolone residues in powdered infant formulae: application to the analysis of samples from the Spanish and Latin American market.
J Chromatogr A2008,1209:136–144.
11. Aguilera-Luiz MM, Martinez-Vidal JL, Romero-Gonzalez R, Garrido-Frenich A: Multiclass method for fast determination of veterinary drug residues in baby food by ultra-high-performance liquid chromatography-tandem mass spectrometry.Food Chem2012,132:2171–2180.
13. Juhel-Gaugain M, Anger B, Laurentie M:Multiresidue chromatographic method for the determination of macrolide residues in muscle by high-performance liquid chromatography with UV detection.J AOAC Int1999,82:1046–1053. 14. García-Mayor MA, Garcinuño RM, Fernández-Hernando P, Durand-Alegría JS:
Liquid chromatography–UV diode-array detection method for multi-residue determination of macrolide antibiotics in sheep’s milk.
J Chromatogr A2006,1122:76–83.
15. Yamada R, Kozono M, Ohmori T, Morimatsu F, Kitayama M:Simultaneous determination of residual veterinary drugs in bovine, porcine, and chicken muscle using liquid chromatography coupled with electrospray ionization tandem mass spectrometry.Biosci Biotech Biochem2006,70:54–65. 16. Horie M, Takegami H, Toya K, Nakazawa H:Determination of macrolide
antibiotics in meat and fish by liquid chromatography–electrospray mass spectrometry.Anal Chim Acta2003,492:187–197.
17. Limin H, Donghao Z, Yijuan S, Yahong L, Jianrong N, Jin L:Determination of macrocyclic lactone drug residues in animal muscle by liquid
chromatography/tandem mass spectrometry.J AOAC Int2008,92:348–358. 18. Jo MR, Lee HJ, Lee TS, Park K, Oh EG, Kim PH, Lee DS, Horie M:Simultaneous
determination of macrolide residues in fish and shrimp by liquid
chromatography-tandem mass spectrometry.Food Sci Biotech2011,20:823–827. 19. Berthod A, García-Alvarez-Coque MC:Micellar liquid chromatography.In
Chromatographic Science Series, Volume 83. New York: Marcel Dekker; 2000. 20. Ruiz-Angel MJ, Garcia-Alvarez-Coque MC, Berthod A:New insights and
recent developments in micellar liquid chromatography.Separ Purif Rev
2009,38:45–96.
21. Rambla-Alegre M, Esteve-Romero J, Carda-Broch S:Development and validation of micellar liquid chromatographic methods for the determination of antibiotics in DifferentMatrixes.J AOAC Int2011,94:775–785.
22. Rambla-Alegre M:Basic principles of MLC.Chromatogr Res Int2012, Article ID 898520, 6 pages.
23. Agrawal N, Marco-Peiró S, Esteve-Romero J, Durgbanshi A, Bose D, Peris-Vicente J, Carda-Broch S:Determination of paroxetine in blood and urine using micellar liquid chromatography with electrochemical detection.
J Chromatogr Sci2014, in press.
24. Aranda EO, Esteve-Romero J, Rambla-Alegre M, Peris-Vicente J, Bose D: Development of a methodology to quantify tamoxifen and endoxifen in breast cancer patients by micellar liquid chromatography and validation according to the ICH guidelines.Talanta2011,84:314–318.
25. Nasr JJ, Shalan S, Belal F:Determination of ethopabate residues in chicken muscles, liver, and eggs after aqueous SDS extraction by micellar liquid chromatography with fluorescence detection with application to baby food.Food Anal Methods2013,6:1522–1528. 26. Beltrán-Martinavarro B, Peris-Vicente J, Carda-Broch S, Esteve-Romero J:
Development and validation of a micellar liquid chromatography-based method to quantify melamine in swine kidney.Food Control2014,46:168–173. 27. Chin-Chen ML, Bose D, Esteve-Romero J, Peris-Vicente J, Rambla-Alegre M,
Carda-Broch S:Determination of putrescine and tyramine in fish by micellar liquid chromatography with UV detection using direct injection.
The Open Anal Chem J2011,5:22–26.
28. Chromolith Columns: Application Note.Germany: Merck; 2012.
29. Saito Y,Švec F, Tennikova TB, Deyl Z:Monolithic materials: preparation, properties and applications.Anal Bianal Chem2004,379:8–9. 30. Brabcová I, Kovářová L,Šatínský D, Havlíková L, Solich P:A fast HPLC
method for determination of vitamin E acetate in dietary supplements using monolithic column.Food Anal Methods2013,6:380–385. 31. Rahim AA, Nofrizal S, Saad B:Rapid tea catechins and caffeine
determination by HPLC using microwave-assisted extraction and silica monolithic column.Food Chem2014,147:262–268.
32. ICH:Validation of analytical procedures: text and methodology, Q2(R1). InICH harmonized tripartite guideline.http://www.ich.org/fileadmin/ Public_Web_Site/ICH_Products/Guidelines/Quality/Q2_R1/Step4/ Q2_R1__Guideline.pdf (accessed 23 June 2014).
33. Miller JN, Miller JC:Statistics and Chemometrics for Analytical Chemistry.5th edition. Harlow, England: Pearson Education Limited; 2007:39–73. 107–149, 256.
doi:10.1186/1752-153X-8-37
Cite this article as:Nasret al.:Simultaneous determination of tylosin and josamycin residues in muscles, liver, eggs and milk by MLC with a monolithic column and time-programmed UV detection: application to baby food and formulae.Chemistry Central Journal20148:37.
Open access provides opportunities to our colleagues in other parts of the globe, by allowing
anyone to view the content free of charge.
Publish with
Chemistry
Central and every
scientist can read your work free of charge
W. Jeffery Hurst, The Hershey Company.
available free of charge to the entire scientific community peer reviewed and published immediately upon acceptance cited in PubMed and archived on PubMed Central yours you keep the copyright
Submit your manuscript here: