The performance of seven QPrediction
risk scores in an independent external
sample of patients from general
practice: a validation study
Julia Hippisley-Cox,1Carol Coupland,1Peter Brindle2
To cite:Hippisley-Cox J, Coupland C, Brindle P. The performance of seven QPrediction risk scores in an independent external sample of patients from general practice: a validation study. BMJ Open2014;4:e005809. doi:10.1136/bmjopen-2014-005809
▸ Prepublication history and additional material is available. To view please visit the journal (http://dx.doi.org/ 10.1136/bmjopen-2014-005809).
Received 28 May 2014 Revised 28 July 2014 Accepted 1 August 2014
1Division of Primary Care, Nottingham, UK
2Avon Primary Care Research Collaborative, Bristol Clinical Commissioning Group, Bristol, UK
Correspondence to Professor Julia Hippisley-Cox; Julia.hippisley-cox@ nottingham.ac.uk
ABSTRACT
Objectives:To validate the performance of a set of
risk prediction algorithms developed using the QResearch database, in an independent sample from general practices contributing to the Clinical Research Data Link (CPRD).
Setting:Prospective open cohort study using
practices contributing to the CPRD database and practices contributing to the QResearch database.
Participants:The CPRD validation cohort consisted
of 3.3 million patients, aged 25–99 years registered at 357 general practices between 1 Jan 1998 and 31 July 2012. The validation statistics for QResearch were obtained from the original published papers which used a one-third sample of practices separate to those used to derive the score. A cohort from QResearch was used to compare incidence rates and baseline
characteristics and consisted of 6.8 million patients from 753 practices registered between 1 Jan 1998 and until 31 July 2013.
Outcome measures:Incident events relating to
seven different risk prediction scores: QRISK2 (cardiovascular disease); QStroke (ischaemic stroke); QDiabetes (type 2 diabetes); QFracture (osteoporotic fracture and hip fracture); QKidney (moderate and severe kidney failure); QThrombosis (venous thromboembolism); QBleed (intracranial bleed and upper gastrointestinal haemorrhage). Measures of discrimination and calibration were calculated.
Results:Overall, the baseline characteristics of the
CPRD and QResearch cohorts were similar though QResearch had higher recording levels for ethnicity and family history. The validation statistics for each of the risk prediction scores were very similar in the CPRD cohort compared with the published results from QResearch validation cohorts. For example, in women, the QDiabetes algorithm explained 50% of the variation within CPRD compared with 51% on QResearch and the receiver operator curve value was 0.85 on both databases. The scores were well calibrated in CPRD.
Conclusions:Each of the algorithms performed
practically as well in the external independent CPRD validation cohorts as they had in the original published QResearch validation cohorts.
INTRODUCTION
In the past 7 years, we have developed a series
of risk prediction algorithms using the
QResearch database. QResearch is a large research database containing pseudonymised individual level data from over 700 general practices using the Egton Medical Information Systems (EMIS) clinical system. The QResearch database consists of data collected from primary care (coded information on sociode-mographic characteristics, diagnoses, symp-toms, smoking/alcohol, clinical measurements, laboratory values, prescriptions and referrals)
Strengths and limitations of this study ▪ This is the first external validation of a set of
QPrediction scores on the Clinical Research Data Link (CPRD). It is important since CPRD repre-sents a fully independent sample of patients registered with general practices using a different clinical computer system from that used to derive the algorithms.
▪ The discrimination and calibration statistics for each score were very similar in CPRD to those published from validation cohorts from QResearch. This supports their potential utility in the general population of patients in primary care.
▪ A strength of using CPRD for risk score valid-ation is that the risk score can be assessed using data collected in a similar manner to the data that would be used when the risk score is used in clinical practice.
▪ The difficulty of obtaining a comprehensive code list for any given outcome or exposure is a limi-tation common to all research in primary care databases. We mitigated this by matching our code lists for the CPRD primary analysis to the code lists in the QResearch derivation data set wherever possible.
▪ Further research is needed to evaluate the clinical outcomes and cost-effectiveness of using these algorithms in primary care.
Hippisley-Cox J,et al.BMJ Open2014;4:e005809. doi:10.1136/bmjopen-2014-005809 1
Open Access Research
on September 22, 2020 by guest. Protected by copyright.
http://bmjopen.bmj.com/
which has been linked to cause of death, hospital episodes and cancer registrations at individual patient level.
The algorithms predict outcomes such as cardiovascu-lar disease (http://www.qrisk.org),1stroke (http://www.
qstroke.org),2 type 2 diabetes (http://www.qdiabetes.
org),3osteoporotic fracture (http://www.qfracture.org),4 moderate or severe kidney disease (http://www.qkidney.
org),5 venous thromboembolism (VTE; http://www.
qthrombosis.org)6 and emergency hospital admission
(http://www.qadmissions.org).7 Generally, the
‘QPrediction’ algorithms have been designed to system-atically identify patients in primary care at high risk of a serious clinical outcome for whom further intervention to lower risk of that outcome might be possible. They are also designed to quantify absolute risk of serious out-comes in a way which patients can understand and which might help guide lifestyle and management deci-sions. A number of these algorithms are now integrated
into general practitioner (GP) clinical computer
systems, included in national guidelines1 4 and are in
daily use across the National Health Service (NHS).1 3 8 The algorithms were originally developed using a random two-thirds sample of practices contributing to the QResearch database and validated on the remaining third. While this represents a physically discrete population of patients and practices for validation, the practices all use the same clinical computer system (EMIS), which is in use in 53% of UK practices. A more stringent test of perform-ance is to validate the algorithms on a fully external data-base derived from practices using a different but commonly used primary care computer system. This would help determine whether the predictions from the algorithms are likely to generalise to the whole population in England. While some of the algorithms have been vali-dated by an independent team using the Health Improvement Network (THIN) primary care database,9–12 there are currently no published validations of the algo-rithms using a primary care database which is routinely linked to mortality data in the same way as QResearch.
We therefore decided to validate the various
QPrediction scores using another database known as the Clinical Research Data Link (CPRD). The General Practice Research Database (GPRD) was originally set up in 1988 and is of similar nature to QResearch although it is derived from practices using a different clinical com-puter system (Vision, which is used by 20% of GPs). It was extended to include linked mortality data and data from secondary care and was renamed the CPRD in 2012. Our secondary objective was to compare the ascer-tainment of incident clinical events recorded in GP data alone with that recorded in either GP data or the linked mortality data in the CPRD and QResearch.
METHODS
CPRD study population
For the validation using CPRD, we identified an open
cohort of patients aged 25–99 years at entry to the
cohort and followed this cohort up until 31 July 2012 (the latest date for which linked data were available at the time of analysis). We restricted the CPRD cohort to
357 practices in England which had linked Office for
National Statistics (ONS) mortality and hospital admis-sions data. For each patient we determined an entry date to the cohort, which was the latest of the following dates: 25th birthday, date of registration with the practice plus 1 year, date on which the practice computer system was installed plus 1 year and the beginning of the study period (1 January 1998). Patients were censored at the earliest date of the relevant outcome, de-registration with the practice, last upload of computerised data or the study end date (31 July 2012).
For the assessment of the two QBleed outcomes (intracranial bleed and upper gastrointestinal haemor-rhage) we used a later cohort entry date of 1 January 2007 for comparability with the equivalent study period for the derivation of the algorithm on QResearch.13
QResearch study population
For comparison of the validation statistics (receiver oper-ator curve (ROC), D and R2statistics), we extracted the original published values from the papers which had been calculated using a one-third sample of practices from QResearch which were independent from the two-thirds of practices used to derive the scores.
For comparison of the baseline characteristics, inci-dence rates and ascertainment rates we used the latest version of the QResearch database which is currently
available (QResearch 38, 31tDecember 2013). We
iden-tified an open cohort in the same way as for CPRD,
using all of the QResearch practices in England, and with follow-up until 31 July 2013.
Inclusion and exclusion criteria
For both databases, we excluded patients without a Townsend score (an area-based measure of material deprivation derived from the post code) and temporary residents. For each score we then identified patients who were eligible to have the score calculated according to the relevant inclusion and exclusion criteria as sum-marised intable 4.
Risk scores included in validation
We validated the following risk prediction scores on CPRD:
1. QDiabetes—10-year risk of type 2 diabetes3; 2. QRISK2—10-year risk of cardiovascular disease1; 3. QStroke—10-year risk of stroke or transient ischaemic
attack (TIA)5;
4. QFracture—10-year risk of hip or osteoporotic
fracture4;
5. QThrombosis—5-year risk of VTE6;
6. QBleed—5-year risk of upper gastrointestinal
haem-orrhage and intracranial haemhaem-orrhage13;
7. QKidney—5-year risk of moderate-severe kidney
disease.5
on September 22, 2020 by guest. Protected by copyright.
Clinical outcomes
We identified the relevant clinical outcome using the
same definition as had been applied in the original der-ivation of the risk scores using QResearch. The data sources used to identify the clinical outcomes had varied over the 6 years during which the original studies had been undertaken due to the changing availability of linked hospital and mortality data over that time. In 2008, the QResearch database was linked to mortality records for 1997 onwards. In 2013, the QResearch data-base was linked to hospital admissions records with data for patients from 1998 onwards. For the latest updated version of QRISK2 (QRISK2, 2014), the outcome was identified by the presence of the relevant Read code on
the GP record or an International Classification of
Diseases (ICD)10 code recorded on the linked mortality record or on the linked hospital admissions record. For QStroke, QDiabetes, QFracture and QThrombosis, the
outcome was identified either by the presence of the
relevant Read code recorded on the GP record or an ICD10 code recorded on the linked mortality record.
For QKidney, the outcome was identified solely from
information recorded in the GP record as in the original study as it required blood test values which were only present in the GP record. For QBleed, the outcome was
identified in CPRD from events recorded either on the
linked hospital admissions database or the linked mor-tality record in order to identify the events most likely to have serious clinical consequences for the patient.
We determined case ascertainment for each clinical outcome on both databases, by calculating the propor-tion of cases recorded on the GP record out of the total number of cases recorded on either the GP record or linked mortality record. We calculated the age standar-dised incidence rates of each outcome based on out-comes recorded on (1) the GP record alone and on (2) the GP record or linked mortality; (3) GP or linked mor-tality or hospital records. We standardised CPRD rates to the age distribution of the QResearch population in 5-year bands to ensure comparability.
Risk factors and missing values
We extracted data from CPRD for all the predictor vari-ables included in one or more of the different
algo-rithms using the same definitions as those used in the
original QResearch studies to enable a direct compari-son of the results. We developed a mapping between the Read and medication reference tables to identify the equivalent code in each database. This included the fol-lowing variables recorded at entry to the cohort:
▸ Demographics—age (continuous), sex, ethnicity (9
cat-egories—Caucasian, Indian, Pakistani, Bangladeshi,
Other Asian, Black Caribbean, Black African, Chinese, other ethnic group), resident in care home, material deprivation (as measured by the Townsend score).
▸ Clinical values—smoking status (non-smoker, ex-smoker, light smoker (1–9 cigarettes/day),
moder-ate smoker (10–19 cigarettes/day), heavy smoker
(20+ cigarettes/day); body mass index (BMI), systolic
blood pressure, alcohol consumption—non-drinker,
trivial (<1 u/day), light (1–2 u/day), moderate
(3–6 u/day), heavy (7–9 u/day), very heavy (>9 day).
▸ Laboratory results—cholesterol/high-density lipopro-tein (HDL) ratio, platelets.
▸ Family history—family history of osteoporosis or hip
fracture in a first degree relative, coronary heart
disease in first degree relative under the age of
60 years, diabetes in afirst degree relative.
▸ Chronic diseases—congestive cardiac failure, atrial fi
b-rillation, coronary heart disease, cardiovascular
disease, peripheral vascular disease, VTE, diabetes, rheumatoid arthritis, systemic lupus erythematosus (SLE), hypertension, renal disease, renal stones,
inflammatory bowel disease, dementia, Parkinson’s
disease, epilepsy, cancer, chronic liver disease or pan-creatitis, oesophageal varices, prior haemorrhage, malabsorption endocrine diseases, asthma or chronic obstructive pulmonary disease, history of falls, prior osteoporotic fracture, varicose vein surgery, emer-gency admissions or hip surgery in past 6 months.
▸ Prescribed medication—anticoagulants, antidepressants, antipsychotics, antiplatelets, oral non-steroidal
anti-inflammatory drugs, tamoxifen, oestrogen containing
hormone replacement therapy (British National Formulary, chapter 6.4.1.1), systemic corticosteroids, combined oral contraceptive.
The combination of predictor variables required for each risk score varied with the score being validated as
shown in table 1. We used the clinical value recorded
closest to the date on which the patient entered the study for BMI, systolic blood pressure, smoking status, platelets, and total and HDL cholesterol. Patients were considered to be exposed to medication at entry to the cohort if they had at least two prescriptions for the rele-vant medication prescribed prior to the study entry date with the most recent one occurring within 28 days of the study entry date.
Townsend scores
We used the Townsend score evaluated at output area as a proxy for material deprivation. The CPRD data set differs from the QResearch data set in that each patient in the CPRD data set is allocated to a 10th of deprivation (as measured by the Townsend score) and only the cat-egory number is provided. In contrast, each patient in the QResearch data set is allocated the individual Townsend score corresponding to their output area of residence (ie, continuous data). In order to calculate risk scores in the CPRD cohort, we used the median value for each 10th as supplied by CPRD. Patients with missing Townsend scores were excluded from the cohorts.
Discrimination and calibration statistics
We used chained equations with the ice chained
equa-tions (ICE) procedure in STATA14 to perform multiple
imputation to replace missing values for BMI, systolic
Hippisley-Cox J,et al.BMJ Open2014;4:e005809. doi:10.1136/bmjopen-2014-005809 3
Open Access
on September 22, 2020 by guest. Protected by copyright.
http://bmjopen.bmj.com/
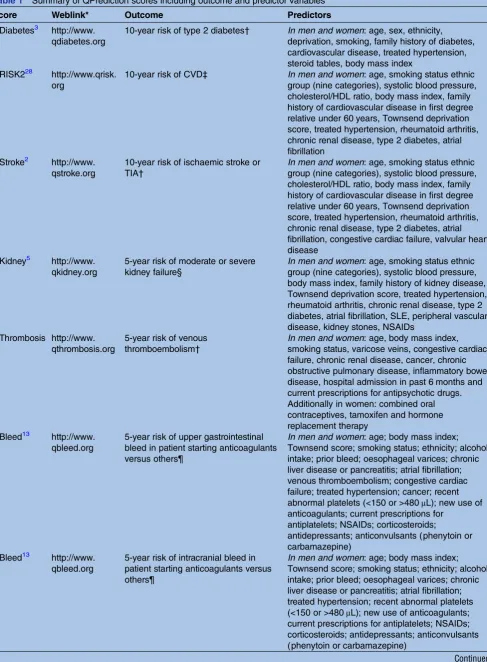
Table 1 Summary of QPrediction scores including outcome and predictor variables
Score Weblink* Outcome Predictors
QDiabetes3 http://www. qdiabetes.org
10-year risk of type 2 diabetes† In men and women: age, sex, ethnicity, deprivation, smoking, family history of diabetes, cardiovascular disease, treated hypertension, steroid tables, body mass index
QRISK228 http://www.qrisk. org
10-year risk of CVD‡ In men and women: age, smoking status ethnic group (nine categories), systolic blood pressure, cholesterol/HDL ratio, body mass index, family history of cardiovascular disease in first degree relative under 60 years, Townsend deprivation score, treated hypertension, rheumatoid arthritis, chronic renal disease, type 2 diabetes, atrial fibrillation
QStroke2 http://www. qstroke.org
10-year risk of ischaemic stroke or TIA†
In men and women: age, smoking status ethnic group (nine categories), systolic blood pressure, cholesterol/HDL ratio, body mass index, family history of cardiovascular disease in first degree relative under 60 years, Townsend deprivation score, treated hypertension, rheumatoid arthritis, chronic renal disease, type 2 diabetes, atrial fibrillation, congestive cardiac failure, valvular heart disease
QKidney5 http://www. qkidney.org
5-year risk of moderate or severe kidney failure§
In men and women: age, smoking status ethnic group (nine categories), systolic blood pressure, body mass index, family history of kidney disease, Townsend deprivation score, treated hypertension, rheumatoid arthritis, chronic renal disease, type 2 diabetes, atrial fibrillation, SLE, peripheral vascular disease, kidney stones, NSAIDs
QThrombosis http://www. qthrombosis.org
5-year risk of venous thromboembolism†
In men and women: age, body mass index, smoking status, varicose veins, congestive cardiac failure, chronic renal disease, cancer, chronic obstructive pulmonary disease, inflammatory bowel disease, hospital admission in past 6 months and current prescriptions for antipsychotic drugs. Additionally in women: combined oral contraceptives, tamoxifen and hormone replacement therapy
QBleed13 http://www. qbleed.org
5-year risk of upper gastrointestinal bleed in patient starting anticoagulants versus others¶
In men and women: age; body mass index; Townsend score; smoking status; ethnicity; alcohol intake; prior bleed; oesophageal varices; chronic liver disease or pancreatitis; atrial fibrillation; venous thromboembolism; congestive cardiac failure; treated hypertension; cancer; recent abnormal platelets (<150 or >480μL); new use of anticoagulants; current prescriptions for
antiplatelets; NSAIDs; corticosteroids;
antidepressants; anticonvulsants (phenytoin or carbamazepine)
QBleed13 http://www. qbleed.org
5-year risk of intracranial bleed in patient starting anticoagulants versus others¶
In men and women: age; body mass index; Townsend score; smoking status; ethnicity; alcohol intake; prior bleed; oesophageal varices; chronic liver disease or pancreatitis; atrial fibrillation; treated hypertension; recent abnormal platelets (<150 or >480μL); new use of anticoagulants; current prescriptions for antiplatelets; NSAIDs; corticosteroids; antidepressants; anticonvulsants (phenytoin or carbamazepine)
Continued
on September 22, 2020 by guest. Protected by copyright.
blood pressure, smoking status, alcohol, and total and
HDL cholesterol. We createdfive multiply imputed data
sets and used Rubin’s rules to combine effect estimates and SEs to allow for the uncertainty due to imputing missing data.15 16
We applied the algorithm for each score to eligible patients in the CPRD study cohort to obtain predicted risks for each of the relevant clinical outcomes. We cal-culated the estimated risk for eligible patients in the CPRD validation data set over 5 or 10 years depending on which score was used. We then tested the perform-ance of each score in the CPRD cohort and compared it with the published results from the original QResearch validation cohorts.
In order to assess calibration (ie, degree of similarity between predicted and observed risks), we calculated
the mean predicted risk and the observed risk17
obtained using the Kaplan-Meier estimate and com-pared the ratio of the mean predicted risk to the observed risk for patients in the validation cohort in each decile of predicted risk. We calculated the area under the ROC statistic to assess discrimination (ie, ability of a risk prediction equation to distinguish between those who do and do not have an event during the follow-up period). We also calculated the D statistic18 and an R2 statistic derived from the D statistic19 which are measures of discrimination and explained variation appropriate for survival models. The D statistic has been
developed as a new measure of discrimination specifi
c-ally for censored survival data, higher values indicate improved discrimination, and an increase in the D statis-tic of at least 0.1 indicates an important difference in prognostic separation between different risk classifi ca-tion schemes. The R2statistic derived from the D statistic
is a measure specific to censored survival data—it
measures explained variation in time to the outcome event and higher values indicate more variation is explained.20We also repeated the assessment of discrim-ination by restricting the analysis for each score to patients without missing data for relevant clinical or laboratory measures used in the risk score (ie, those with complete data for all predictor variables in the risk score).
We identified the proportion of patients in the CPRD
validation cohort who were in the top decile of pre-dicted risk and used this to calculate the sensitivity, spe-cificity and observed risk at this threshold. We used the top decile for comparability across the scores and with previous studies though the choice of threshold for use in clinical practice will depend on the context and cost-effectiveness of relevant interventions. Analyses were conducted using Stata (V.13.1).
Sample size estimation
There is currently no clear guidance on sample size requirements for studies evaluating the performance (validation) of a multivariable risk score, but a com-monly used rule-of-thumb is that it is desirable to seek a data set with at least 100 patients with the outcome of interest. We used all the available data on the CPRD to maximise the power of the study.
RESULTS
Study populations
The CPRD validation cohort consisted of 3.3 million patients, aged 25–99 years registered at 357 general prac-tices with linked data between 1 January 1998 and 31 July 2012. The QResearch cohort consisted of 6.8 million patients from 753 practices with linked data,
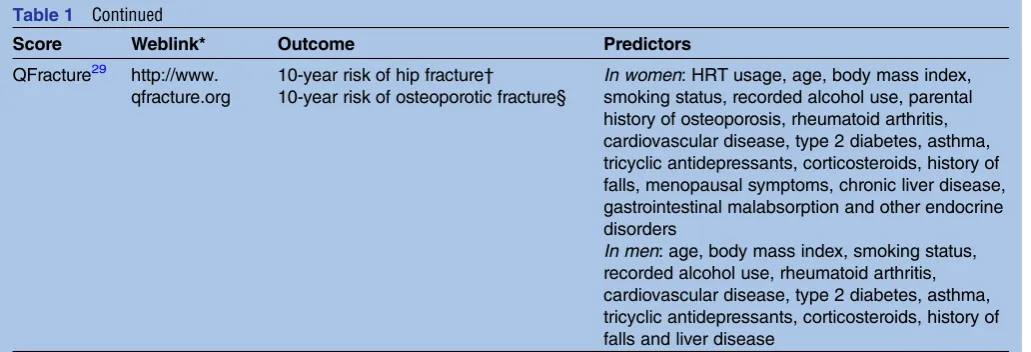
Table 1 Continued
Score Weblink* Outcome Predictors
QFracture29 http://www. qfracture.org
10-year risk of hip fracture†
10-year risk of osteoporotic fracture§
In women: HRT usage, age, body mass index, smoking status, recorded alcohol use, parental history of osteoporosis, rheumatoid arthritis, cardiovascular disease, type 2 diabetes, asthma, tricyclic antidepressants, corticosteroids, history of falls, menopausal symptoms, chronic liver disease, gastrointestinal malabsorption and other endocrine disorders
In men: age, body mass index, smoking status, recorded alcohol use, rheumatoid arthritis, cardiovascular disease, type 2 diabetes, asthma, tricyclic antidepressants, corticosteroids, history of falls and liver disease
*The web link has the relevant calculator, links to academic papers, additional information including links to the open source software.
†Recorded either on GP record or linked ONS mortality record.
‡Recorded either on linked hospital admissions record or ONS mortality or linked hospital admissions record. §Recorded on the GP record.
¶Recorded either on linked hospital admissions record or ONS mortality record.
CVD, cardiovascular disease; GP, general practitioner; HDL, high-density lipoprotein; HRT, hormone replacement therapy; TIA, transient ischaemic attack; NSAIDs, non-steroidal anti-inflammatory drugs; ONS, Office for National Statistics.
Hippisley-Cox J,et al.BMJ Open2014;4:e005809. doi:10.1136/bmjopen-2014-005809 5
Open Access
on September 22, 2020 by guest. Protected by copyright.
http://bmjopen.bmj.com/
registered between 1 January 1998 and until 31 July 2013. The numbers of patients in each geographical region are shown in web extra table 1.
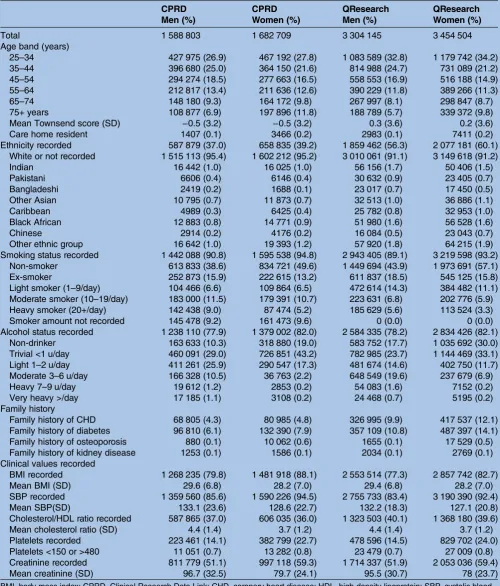
Baseline characteristics
Table 2 shows a comparison of the demographic characteristics for the CPRD and QResearch cohorts.
Table 2 Comparison of baseline characteristics of patients in CPRD validation cohort and QResearch comparison cohort
CPRD CPRD QResearch QResearch
Men (%) Women (%) Men (%) Women (%)
Total 1 588 803 1 682 709 3 304 145 3 454 504
Age band (years)
25–34 427 975 (26.9) 467 192 (27.8) 1 083 589 (32.8) 1 179 742 (34.2)
35–44 396 680 (25.0) 364 150 (21.6) 814 988 (24.7) 731 089 (21.2)
45–54 294 274 (18.5) 277 663 (16.5) 558 553 (16.9) 516 188 (14.9)
55–64 212 817 (13.4) 211 636 (12.6) 390 229 (11.8) 389 266 (11.3)
65–74 148 180 (9.3) 164 172 (9.8) 267 997 (8.1) 298 847 (8.7)
75+ years 108 877 (6.9) 197 896 (11.8) 188 789 (5.7) 339 372 (9.8)
Mean Townsend score (SD) −0.5 (3.2) −0.5 (3.2) 0.3 (3.6) 0.2 (3.6)
Care home resident 1407 (0.1) 3466 (0.2) 2983 (0.1) 7411 (0.2)
Ethnicity recorded 587 879 (37.0) 658 835 (39.2) 1 859 462 (56.3) 2 077 181 (60.1) White or not recorded 1 515 113 (95.4) 1 602 212 (95.2) 3 010 061 (91.1) 3 149 618 (91.2)
Indian 16 442 (1.0) 16 025 (1.0) 56 156 (1.7) 50 406 (1.5)
Pakistani 6606 (0.4) 6146 (0.4) 30 632 (0.9) 23 405 (0.7)
Bangladeshi 2419 (0.2) 1688 (0.1) 23 017 (0.7) 17 450 (0.5)
Other Asian 10 795 (0.7) 11 873 (0.7) 32 513 (1.0) 36 886 (1.1)
Caribbean 4989 (0.3) 6425 (0.4) 25 782 (0.8) 32 953 (1.0)
Black African 12 883 (0.8) 14 771 (0.9) 51 980 (1.6) 56 528 (1.6)
Chinese 2914 (0.2) 4176 (0.2) 16 084 (0.5) 23 043 (0.7)
Other ethnic group 16 642 (1.0) 19 393 (1.2) 57 920 (1.8) 64 215 (1.9)
Smoking status recorded 1 442 088 (90.8) 1 595 538 (94.8) 2 943 405 (89.1) 3 219 598 (93.2) Non-smoker 613 833 (38.6) 834 721 (49.6) 1 449 694 (43.9) 1 973 691 (57.1)
Ex-smoker 252 873 (15.9) 222 615 (13.2) 611 837 (18.5) 545 125 (15.8)
Light smoker (1–9/day) 104 466 (6.6) 109 864 (6.5) 472 614 (14.3) 384 482 (11.1) Moderate smoker (10–19/day) 183 000 (11.5) 179 391 (10.7) 223 631 (6.8) 202 776 (5.9) Heavy smoker (20+/day) 142 438 (9.0) 87 474 (5.2) 185 629 (5.6) 113 524 (3.3)
Smoker amount not recorded 145 478 (9.2) 161 473 (9.6) 0 (0.0) 0 (0.0)
Alcohol status recorded 1 238 110 (77.9) 1 379 002 (82.0) 2 584 335 (78.2) 2 834 426 (82.1) Non-drinker 163 633 (10.3) 318 880 (19.0) 583 752 (17.7) 1 035 692 (30.0) Trivial <1 u/day 460 091 (29.0) 726 851 (43.2) 782 985 (23.7) 1 144 469 (33.1) Light 1–2 u/day 411 261 (25.9) 290 547 (17.3) 481 674 (14.6) 402 750 (11.7) Moderate 3–6 u/day 166 328 (10.5) 36 763 (2.2) 648 549 (19.6) 237 679 (6.9)
Heavy 7–9 u/day 19 612 (1.2) 2853 (0.2) 54 083 (1.6) 7152 (0.2)
Very heavy >/day 17 185 (1.1) 3108 (0.2) 24 468 (0.7) 5195 (0.2)
Family history
Family history of CHD 68 805 (4.3) 80 985 (4.8) 326 995 (9.9) 417 537 (12.1) Family history of diabetes 96 810 (6.1) 132 390 (7.9) 357 109 (10.8) 487 397 (14.1) Family history of osteoporosis 880 (0.1) 10 062 (0.6) 1655 (0.1) 17 529 (0.5) Family history of kidney disease 1253 (0.1) 1586 (0.1) 2034 (0.1) 2769 (0.1) Clinical values recorded
BMI recorded 1 268 235 (79.8) 1 481 918 (88.1) 2 553 514 (77.3) 2 857 742 (82.7)
Mean BMI (SD) 29.6 (6.8) 28.2 (7.0) 29.4 (6.8) 28.2 (7.0)
SBP recorded 1 359 560 (85.6) 1 590 226 (94.5) 2 755 733 (83.4) 3 190 390 (92.4)
Mean SBP(SD) 133.1 (23.6) 128.6 (22.7) 132.2 (18.3) 127.1 (20.8)
Cholesterol/HDL ratio recorded 587 865 (37.0) 606 035 (36.0) 1 323 503 (40.1) 1 368 180 (39.6)
Mean cholesterol ratio (SD) 4.4 (1.4) 3.7 (1.2) 4.4 (1.4) 3.7 (1.2)
Platelets recorded 223 461 (14.1) 382 799 (22.7) 478 596 (14.5) 829 702 (24.0) Platelets <150 or >480 11 051 (0.7) 13 282 (0.8) 23 479 (0.7) 27 009 (0.8) Creatinine recorded 811 779 (51.1) 997 118 (59.3) 1 714 337 (51.9) 2 053 036 (59.4)
Mean creatinine (SD) 96.7 (32.5) 79.7 (24.1) 95.5 (30.7) 78 (23.7)
BMI, body mass index; CPRD, Clinical Research Data Link; CHD, coronary heart disease; HDL, high-density lipoprotein; SBP, systolic blood pressure.
on September 22, 2020 by guest. Protected by copyright.
The QResearch population was marginally younger with
34.2% of women and 32.8% of men aged 24–34 years
com-pared with 27.8% and 26.9% for CPRD.
Recording of ethnicity
QResearch had a higher proportion of patients with self-assigned ethnicity recorded compared with CPRD both overall (58.2% vs 38.1%) and in each of the 10 geo-graphical areas within England (web extra table 2). We
repeated the analysis restricting information on
QResearch to that recorded prior to 31 July 2012 (for comparability with the calendar time available on CPRD). Of the 6 758 649 patients in the QResearch cohort, 3 856 244 (57.1%) had ethnicity recorded prior to this date.
Recording of family history
Recording of a positive family history of coronary heart disease and diabetes was more than twice as high in QResearch compared with CPRD. For example, for family history of coronary heart disease, 11% of patients had a value recorded for QResearch compared with 4.6% for CPRD (web extra table 2). Restricting informa-tion to that recorded prior to July 2012 for QResearch, then 6 758 649 (10.7%) had a positive family history of coronary heart disease recorded.
Recording of alcohol and smoking levels
Recording of alcohol levels was very similar in
QResearch and CPRD. For example, 82.1% of women had alcohol level recorded in both databases. Recording of smoking status was marginally higher in women com-pared with men in QResearch (93.2% vs 89.1%) and also CPRD (94.8% vs 90.8%).
Recording of clinical values
Recording of cholesterol/HDL ratio was marginally higher on QResearch compared with CPRD (40.1% vs 36%). Recording of BMI and systolic blood pressure tended to be marginally higher on CPRD than QResearch. However, the mean values for the various clinical values (BMI, sys-tolic blood pressure, serum creatinine and cholesterol/ HDL ratio) were extremely similar.
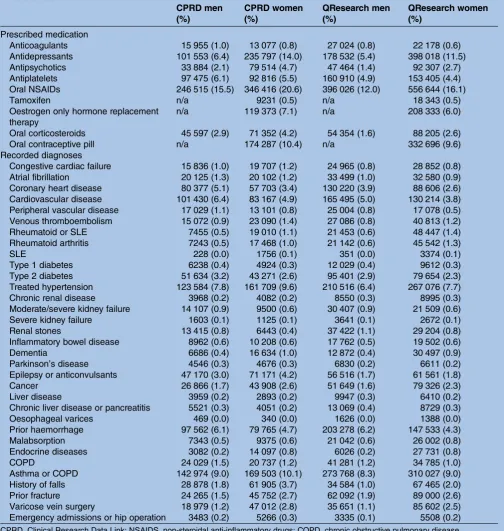
Table 3shows prescribed medication and clinical diag-noses recorded in patients on or prior to entry to the study cohort. Overall, the prevalence of clinical diagno-ses was similar on the two databadiagno-ses with CPRD having marginally higher prescribing rates.
The inclusion and exclusion criteria for each risk score
are shown intable 4along with the numbers of patients
eligible for each analysis on CPRD. For example, there
were 3 177 192 patients aged 25–84 years. Of these,
99 189 had existing diabetes at baseline leaving 3 078 003
for the validation of QDiabetes. Table 4 also shows the
numbers and percentage out of those eligible for inclu-sion with complete data for risk factors necessary for cal-culation of the score which would otherwise need to be imputed (ie, laboratory or clinical values). The amount
of missing data varies substantially between the scores with scores requiring multiple laboratory or clinical values (such as QRISK2) having the lowest levels of completeness.
Comparison between CPRD linked and unlinked data
Web extra table 3 shows characteristics for CPRD cohort with linked data with CPRD cohort without linked data. The CPRD cohort with linked data tended to have higher recorded of ethnicity compared with the CPRD
cohort without linked data (38.1% vs 28.4%).
Recordings of smoking, alcohol, BMI, systolic blood pressure, cholesterol and platelets were all higher on the CPRD cohort with linked data than those without linked data.
Incidence rates of clinical outcomes
Table 5 shows the number of incident events for each clinical outcome in women recorded on GP data and those recorded on either GP data or cause-specific mor-tality data for both the CPRD and QResearch cohorts. It also shows the age standardised incidence rates per 1000
person years.Table 6shows the comparable information
for men.
For example, there were 35 617 incident ischaemic stroke or TIA events for women on CPRD. Of these,
32 283 had been identified on the GP record with an
additional 3334 events identified on the linked ONS
mortality record. The ascertainment of events on the GP record was therefore 32 283/35 617, that is, 90.6%. For QResearch, there were 70 477 incident stroke events recorded on either the GP or linked ONS mortality
record of which 63 572 had been identified on the GP
record. The ascertainment was therefore 90.2%.
For thromboembolism in women, 91.1% of events recorded on either the GP or linked ONS mortality
record on CPRD were identified on the GP record
com-pared with 90.6% for QResearch. Similar results were obtained for men with levels of ascertainment between the two databases being extremely close suggesting similar recording patterns between the two groups of GP practices contributing to each database.
The age standardised incidence rates of events on CPRD tended to be marginally lower than those on QResearch as shown by the ratio of the CPRD rates to those in QResearch (table 5). For example, the rate ratio for fractured neck of femur in women was 0.94 indicating that CPRD had a 6% lower incidence rate compared with QResearch. The effect was more marked for moderate or severe kidney failure where the incidence rates for CPRD were approximately 25% lower than those for QResearch in women and 16% lower in men.
The age standardised incidence rates of upper gastro-intestinal haemorrhage and intracranial haemorrhage among patients prescribed anticoagulants and those not prescribed anticoagulants are shown in web extra table 4. The rates are similar for CPRD and QResearch.
Hippisley-Cox J,et al.BMJ Open2014;4:e005809. doi:10.1136/bmjopen-2014-005809 7
Open Access
on September 22, 2020 by guest. Protected by copyright.
http://bmjopen.bmj.com/
Validation statistics
Table 7shows the discrimination statistics for each score in CPRD in men and women and also the published values from previous validations using QResearch. The validation statistics for each of the risk prediction scores were very similar in the CPRD cohort compared with results from QResearch validation cohorts. For example,
in women, the QDiabetes algorithm explained 50% of the variation within CPRD compared with 51% on QResearch. The D statistic for women was 2.03 within CPRD compared with 2.08 for QResearch. The ROC value for women was 0.85 on both databases.
Of all the scores, QFracture (fractured neck of femur) had the best performance in men in CPRD with a ROC
Table 3 Prescribed medication and clinical diagnoses recorded at baseline in CPRD validation cohort and QResearch comparison cohort
CPRD men (%)
CPRD women (%)
QResearch men (%)
QResearch women (%)
Prescribed medication
Anticoagulants 15 955 (1.0) 13 077 (0.8) 27 024 (0.8) 22 178 (0.6)
Antidepressants 101 553 (6.4) 235 797 (14.0) 178 532 (5.4) 398 018 (11.5)
Antipsychotics 33 884 (2.1) 79 514 (4.7) 47 464 (1.4) 92 307 (2.7)
Antiplatelets 97 475 (6.1) 92 816 (5.5) 160 910 (4.9) 153 405 (4.4) Oral NSAIDs 246 515 (15.5) 346 416 (20.6) 396 026 (12.0) 556 644 (16.1)
Tamoxifen n/a 9231 (0.5) n/a 18 343 (0.5)
Oestrogen only hormone replacement therapy
n/a 119 373 (7.1) n/a 208 333 (6.0)
Oral corticosteroids 45 597 (2.9) 71 352 (4.2) 54 354 (1.6) 88 205 (2.6)
Oral contraceptive pill n/a 174 287 (10.4) n/a 332 696 (9.6)
Recorded diagnoses
Congestive cardiac failure 15 836 (1.0) 19 707 (1.2) 24 965 (0.8) 28 852 (0.8) Atrial fibrillation 20 125 (1.3) 20 102 (1.2) 33 499 (1.0) 32 580 (0.9) Coronary heart disease 80 377 (5.1) 57 703 (3.4) 130 220 (3.9) 88 606 (2.6) Cardiovascular disease 101 430 (6.4) 83 167 (4.9) 165 495 (5.0) 130 214 (3.8) Peripheral vascular disease 17 029 (1.1) 13 101 (0.8) 25 004 (0.8) 17 078 (0.5) Venous thromboembolism 15 072 (0.9) 23 090 (1.4) 27 086 (0.8) 40 813 (1.2) Rheumatoid or SLE 7455 (0.5) 19 010 (1.1) 21 453 (0.6) 48 447 (1.4) Rheumatoid arthritis 7243 (0.5) 17 468 (1.0) 21 142 (0.6) 45 542 (1.3)
SLE 228 (0.0) 1756 (0.1) 351 (0.0) 3374 (0.1)
Type 1 diabetes 6238 (0.4) 4924 (0.3) 12 029 (0.4) 9612 (0.3)
Type 2 diabetes 51 634 (3.2) 43 271 (2.6) 95 401 (2.9) 79 654 (2.3) Treated hypertension 123 584 (7.8) 161 709 (9.6) 210 516 (6.4) 267 076 (7.7)
Chronic renal disease 3968 (0.2) 4082 (0.2) 8550 (0.3) 8995 (0.3)
Moderate/severe kidney failure 14 107 (0.9) 9500 (0.6) 30 407 (0.9) 21 509 (0.6)
Severe kidney failure 1603 (0.1) 1125 (0.1) 3641 (0.1) 2672 (0.1)
Renal stones 13 415 (0.8) 6443 (0.4) 37 422 (1.1) 29 204 (0.8)
Inflammatory bowel disease 8962 (0.6) 10 208 (0.6) 17 762 (0.5) 19 502 (0.6)
Dementia 6686 (0.4) 16 634 (1.0) 12 872 (0.4) 30 497 (0.9)
Parkinson’s disease 4546 (0.3) 4676 (0.3) 6830 (0.2) 6611 (0.2)
Epilepsy or anticonvulsants 47 170 (3.0) 71 171 (4.2) 56 516 (1.7) 61 561 (1.8)
Cancer 26 866 (1.7) 43 908 (2.6) 51 649 (1.6) 79 326 (2.3)
Liver disease 3959 (0.2) 2893 (0.2) 9947 (0.3) 6410 (0.2)
Chronic liver disease or pancreatitis 5521 (0.3) 4051 (0.2) 13 069 (0.4) 8729 (0.3)
Oesophageal varices 469 (0.0) 340 (0.0) 1626 (0.0) 1388 (0.0)
Prior haemorrhage 97 562 (6.1) 79 765 (4.7) 203 278 (6.2) 147 533 (4.3)
Malabsorption 7343 (0.5) 9375 (0.6) 21 042 (0.6) 26 002 (0.8)
Endocrine diseases 3082 (0.2) 14 097 (0.8) 6026 (0.2) 27 731 (0.8)
COPD 24 029 (1.5) 20 737 (1.2) 41 281 (1.2) 34 785 (1.0)
Asthma or COPD 142 974 (9.0) 169 503 (10.1) 273 768 (8.3) 310 027 (9.0) History of falls 28 878 (1.8) 61 905 (3.7) 34 584 (1.0) 67 465 (2.0)
Prior fracture 24 265 (1.5) 45 752 (2.7) 62 092 (1.9) 89 000 (2.6)
Varicose vein surgery 18 979 (1.2) 47 012 (2.8) 35 651 (1.1) 85 602 (2.5) Emergency admissions or hip operation 3483 (0.2) 5266 (0.3) 3335 (0.1) 5508 (0.2)
CPRD, Clinical Research Data Link; NSAIDS, non-steroidal anti-inflammatory drugs; COPD, chronic obstructive pulmonary disease.
on September 22, 2020 by guest. Protected by copyright.
Table 4 Numbers of patients eligible for each score in the Clinical Research Data Link validation cohort and number of patients with complete risk factor recording not requiring multiple imputation
Risk score Clinical outcome
Eligible age range
Exclusion criteria at study entry
Total in age range
Total with exclusions
Total eligible for analysis
Total complete data
Complete data (%)
QDiabetes Type 2 diabetes 25–84 Type 1 or 2 diabetes at study entry
3 177 192 99 189 3 078 003 2 467 642 80.2
QStroke Ischaemic stroke 25–84 Existing stroke or
anticoagulants at study entry
3 177 192 70 961 3 106 231 1 032 184 33.2
QRISK2 CVD 25–84 Existing CVD or statins at study
entry
3 177 192 232 722 2 944 470 906 781 30.8
QThrombosis Thromboembolism 25–84 Existing VTE or anticoagulants at study entry
3 177 192 53 904 3 123 288 2 513 347 80.5
QFracture Fractured neck of femur 30–99 None except age 2 852 381 0 2 852 381 2 087 149 73.2
QFracture Osteoporotic fracture 30–99 None except age 2 852 381 0 2 852 381 2 087 149 73.2
QKidney Moderate or severe kidney failure
35–74 Existing moderate or severe kidney failure
2 069 572 10 518 2 059 054 1 146 619 55.7
QKidney Severe kidney failure 35–74 Existing severe kidney failure 2 069 572 1930 2 067 642 1 153 979 55.8 QBleed Upper gastrointestinal
bleed*
25–99 Anticoagulants in 180 days prior to study entry
2 429 696 35 283 2 394 413 1 890 804 79.0
QBleed Intracranial bleed* 25–99 Anticoagulants in 180 days prior to study entry
2 429 696 35 283 2 394 413 1 890 804 79.0
*Entry date was 1 January 1998 except for upper gastrointestinal bleed and intracranial bleed where entry date was 1 January 2007. CVD, cardiovascular disease; VTE, venous thromboembolism.
Hippisle
y-C
ox
J,
et
al
.
BMJ
Open
2014;
4
:e005809
.
doi:10.113
6/bmjopen-20
14-005809
9
Open
Acces
s
Table 5 Comparison of age standardised incidence rates (95% CI) per 1000 person years for outcomes on CPRD versus QResearch database in women
Outcome
CPRD QResearch
Source for case
identification Cases
Ascertainment (%)
Standardised rates per 1000 person
years (95% CI) Cases
Ascertainment (%)
Standardised rates per 1000 person years (95% CI)
Ratio of CPRD to QR standardised rate
Type 2 diabetes GP data 48 143 99.88 4.13 (4.10 to 4.17) 102 544 99.93 4.33 (4.31 to 4.36) 0.95
GP or ONS 48 203 NA 4.13 (4.10 to 4.17) 102 618 NA 4.34 (4.31 to 4.36) 0.95
Ischaemic stroke GP data 32 283 90.64 2.45 (2.42 to 2.48) 63 582 90.22 2.45 (2.44 to 2.47) 1.00
GP or ONS 35 617 NA 2.62 (2.59 to 2.64) 70 477 NA 2.70 (2.68 to 2.72) 0.97
Cardiovascular disease GP data 55 833 85.71 5.41 (5.37 to 5.46) 107 412 84.96 4.32 (4.30 to 4.35) 1.25
GP or ONS 65 143 NA 6.32 (6.27 to 6.37) 126 433 NA 5.03 (5.01 to 5.06) 1.26
GP or ONS or HES
69 202 NA 6.72 (6.67 to 6.77) 140 510 NA 5.63 (5.60 to 5.66) 1.19
Thromboembolism GP data 18 199 91.1 1.52 (1.49 to 1.54) 35 971 90.55 1.46 (1.44 to 1.47) 1.04
GP or ONS 19 978 NA 1.64 (1.62 to 1.67) 39 727 NA 1.60 (1.58 to 1.62) 1.03
Fractured neck of femur GP data 17 529 99.98 1.32 (1.30 to 1.34) 34 821 99.99 1.40 (1.39 to 1.42) 0.94
GP or ONS 17 533 NA 1.32 (1.30 to 1.34) 34 825 NA 1.40 (1.39 to 1.42) 0.94
Osteoporotic fracture GP data 34 528 NA 2.89 (2.58 to 3.20) 81 334 NA 3.63 (3.61 to 3.66) 0.80
Moderate/severe kidney failure
GP data 19 902 NA 2.06 (1.76 to 2.36) 48 665 NA 2.81 (2.78 to 2.83) 0.73
Severe kidney failure GP data 1737 NA 0.18 (0.09 to 0.27) 4150 NA 0.24 (0.24 to 0.25) 0.74
CPRD, Clinical Research Data Link; GP, general practitioner; HES, hospital episode statistics; NA, not available; ONS, Office for National Statistics.
Hippisle
y-C
ox
J,
et
al
.
BMJ
Open
2014;
4
:e005809.
doi:10.1136/
bmjopen-20
14-005809
n
Ac
Table 6 Comparison of age standardised incidence rates (95% CI) per 1000 person years for outcomes on CPRD versus QResearch database in men
Outcome CPRD QResearch
Source for case
identification Cases
Ascertainment (%)
Standardised rates per 1000 person
years (95% CI) Cases
Ascertainment (%)
Standardised rates per 1000 person years (95% CI)
Ratio of CPRD to QR standardised rate
Type 2 diabetes GP data 60 731 99.92 5.84 (5.79 to 5.89) 128 234 99.94 5.97 (5.94 to 6.00) 0.98
GP or ONS 60 782 NA 5.84 (5.80 to 5.89) 128 317 NA 5.98 (5.94 to 6.01) 0.98
Ischaemic stroke GP data 32 223 93.55 3.17 (3.14 to 3.20) 63 480 92.85 3.10 (3.08 to 3.13) 1.02
GP or ONS 34 443 NA 3.33 (3.30 to 3.37) 68 366 NA 3.37 (3.34 to 3.40) 0.99
Cardiovascular disease GP data 70 283 86.7 7.38 (7.33 to 7.44) 137 136 86.12 7.12 (7.08 to 7.16) 1.03
GP or ONS 81 068 NA 8.52 (8.46 to 8.58) 159 240 NA 8.37 (8.33 to 8.41) 1.02
GP or ONS or HES
84 620 NA 8.90 (8.84 to 8.96) 174 405 NA 9.17 (9.13 to 9.21) 0.97
Thromboembolism GP data 15 655 92.32 1.49 (1.46 to 1.51) 31 503 92.22 1.44 (1.43 to 1.46) 1.03
GP or ONS 16 958 NA 1.61 (1.59 to 1.63) 34 161 NA 1.57 (1.56 to 1.59) 1.02
Fractured neck of femur GP data 5,706 99.98 0.65 (0.63 to 0.67) 12 435 99.98 0.71 (0.70 to 0.73) 0.91
GP or ONS 5,707 NA 0.65 (0.63 to 0.67) 12 438 NA 0.71 (0.70 to 0.73) 0.91
Osteoporotic fracture GP data 11 169 NA 1.29 (1.05 to 1.52) 28 555 NA 1.54 (1.52 to 1.55) 0.84
Moderate/severe kidney failure
GP data 37 597 NA 4.88 (4.37 to 5.38) 86 649 NA 5.82 (5.78 to 5.85) 0.84
Severe kidney failure GP data 3472 NA 0.54 (0.38 to 0.71) 7372 NA 0.47 (0.46 to 0.48) 1.15
CPRD, Clinical Research Data Link; GP, general practitioner; HES, hospital episode statistics; NA, not available; ONS, Office for National Statistics.
Hippisle
y-C
ox
J,
et
al
.
BMJ
Open
2014;
4
:e005809
.
doi:10.113
6/bmjopen-20
14-005809
11
Open
Acces
s
Table 7 Performance of QPrediction scores on the CPRD validation cohort compared with published results for the QResearch validation cohort
CPRD CPRD QResearch QResearch
Women Men Women Men
Statistic Mean (95% CI) Mean (95% CI) Mean (95% CI) Mean (95% CI)
QDiabetes-2013 (type 2 diabetes)30
ROC 0.846 (0.844 to 0.848) 0.818 (0.816 to 0.82) 0.853 (0.851 to 0.856) 0.837 (0.835 to 0.840) R2(%) 49.6 (49.2 to 50.1) 45.7 (45.3 to 46.2) 50.8 (50.3 to 51.4) 48.1 (47.6 to 48.6) D statistic 2.032 (2.015 to 2.049) 1.879 (1.863 to 1.895) 2.081 (2.058 to 2.104) 1.971 (1.951 to 1.991) QKidney-20105
(moderate or severe kidney failure)
ROC 0.875 (0.87 to 0.879) 0.88 (0.878 to 0.883) 0.877 (0.873 to 0.880) 0.878 (0.874 to 0.882) R2(%) 58.3 (57.8 to 58.7) 57.5 (57.1 to 57.8) 56.45 (55.40 to 57.50) 58.29 (55.31 to 61.26) D statistic 2.418 (2.394 to 2.442) 2.379 (2.361 to 2.397) 2.33 (2.28 to 2.40) 2.42 (2.28 to 2.56) QKidney-2010
(severe kidney failure)5
ROC 0.839 (0.822 to 0.855) 0.851 (0.84 to 0.862) 0.843 (0.825 to 0.860) 0.846 (0.829 to 0.862) R2(%) 51.4 (49.5 to 53.2) 53.8 (52.6 to 55.1) 55.39 (52.59 to 58.18) 56.65 (53.94 to 59.35) D statistic 2.103 (2.025 to 2.182) 2.21 (2.154 to 2.266) 2.28 (2.15 to 2.41) 2.34 (2.21 to 2.47) QRISK2-201428
(cardiovascular disease)
ROC 0.883 (0.882 to 0.884) 0.859 (0.858 to 0.861) 0.892 (0.892 to 0.895) 0.871 (0.869 to 0.873) R2(%) 56.4 (56.1 to 56.7) 50.9 (50.6 to 51.2) 58.8 (58.4 to 59.1) 53.3 (52.9 to 53.7) D statistic 2.328 (2.313 to 2.343) 2.085 (2.071 to 2.098) 2.443 (2.423 to 2.463) 2.188 (2.171 to 2.205) QStroke-20132
(ischaemic stroke or TIA)
ROC 0.882 (0.88 to 0.883) 0.869 (0.867 to 0.87) 0.877 (0.875 to 0.879) 0.866 (0.864 to 0.868) R2(%) 58.4 (58.1 to 58.8) 55.3 (54.9 to 55.7) 57.3 (56.8 to 57.8) 55.1 (54.6 to 55.7) D statistic 2.427 (2.408 to 2.446) 2.278 (2.259 to 2.297) 2.37 (2.35 to 2.40) 2.27 (2.24 to 2.30) QThrombosis-20106
(venous thromboembolism)
ROC 0.756 (0.751 to 0.761) 0.765 (0.760 to 0.770) 0.75 (0.74 to 0.76) 0.75 (0.74 to 0.76) R2(%) 35.3 (34.5 to 36.1) 34.5 (33.7 to 35.4) 32.78 (31.08 to 34.48) 33.51 (31.71 to 35.30) D statistic 1.512 (1.485 to 1.538) 1.486 (1.458 to 1.513) 1.43 (1.37 to 1.49) 1.45 (1.39 to 1.51) QBleed-201413
(upper gastrointestinal bleed)
ROC statistic 0.775 (0.770 to 0.781) 0.759 (0.753 to 0.764) 0.766 (0.758 to 0.775) 0.747 (0.738 to 0.756) R2(%) 44.7 (43.6 to 45.9) 41.6 (40.5 to 42.8) 40.7 (38.9 to 42.6) 36.9 (35.1 to 38.7) D statistic 1.842 (1.798 to 1.885) 1.729 (1.687 to 1.771) 1.70 (1.63 to 1.76) 1.57 (1.51 to 1.63) QBleed-201413
(intracranial bleed)
ROC statistic 0.808 (0.801 to 0.816) 0.789 (0.780 to 0.797) 0.847 (0.838 to 0.856) 0.812 (0.80 to 0.824) R2(%) 51.7 (50.1 to 53.3) 50.0 (48.3 to 51.7) 58.0 (56.0 to 60.0) 53.3 (51.1 to 55.4) D statistic 2.118 (2.051 to 2.186) 2.046 (1.977 to 2.116) 2.40 (2.30 to 2.50) 2.19 (2.09 to 2.28) QFracture-201229
(fractured neck of femur)
ROC 0.89 (0.888 to 0.892) 0.872 (0.867 to 0.877) 0.893 (0.890 to 0.896) 0.875 (0.868 to 0.883) R2(%) 70.6 (70.2 to 71) 69.2 (68.5 to 70) 71.73 (71.10 to 72.30) 70.37 (69.25 to 71.49) D statistic 3.171 (3.139 to 3.203) 3.07 (3.016 to 3.124) 3.26 (3.21 to 3.31) 3.15 (3.06 to 3.24) QFracture-201229
(osteoporotic fracture: hip, spine, wrist, humerus)
ROC 0.817 (0.814 to 0.819) 0.768 (0.763 to 0.773) 0.790 (0.787 to 0.793) 0.711 (0.703 to 0.719) R2(%) 56.3 (55.8 to 56.7) 49.8 (48.9 to 50.7) 51.9 (51.2 to 52.6) 38.20 (36.89 to 39.57) D statistic 2.322 (2.301 to 2.343) 2.038 (2.002 to 2.075) 2.13 (2.10 to 2.15) 1.61 (1.56 to 1.66)
D statistic is a measure of discrimination—higher values indicate better discrimination. ROC statistic is a measure of discrimination—higher values indicate better discrimination.
The R2statistic is a measure of explained variation—higher values indicate more variation is explained. CPRD, Clinical Research Data Link; TIA, transient ischaemic attack; ROC, receiver operator curve.
Hippisle
y-C
ox
J,
et
al
.
BMJ
Open
2014;
4
:e005809.
doi:10.1136/
bmjopen-20
14-005809
n
Ac
value of 0.89, R2 value of 71% and D statistic of 3.17.
The corresponding figures for QResearch in men were
0.89, 72% and 3.26.
QThrombosis had the lowest values for men in CPRD with an ROC value of 0.77, R2of 34.5 and D statistic of
1.49. The corresponding figures for men in QResearch
were 0.75, 33.5 and 1.45.
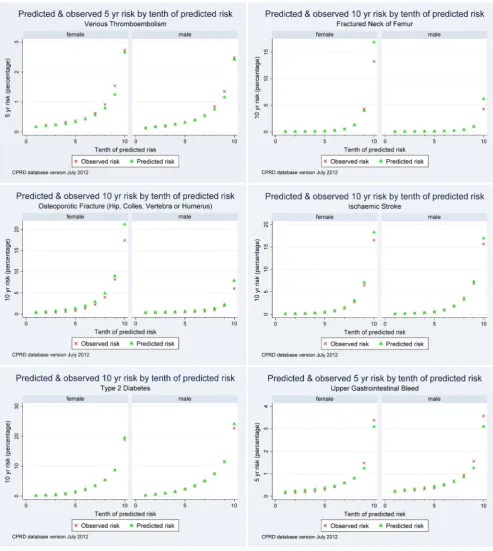
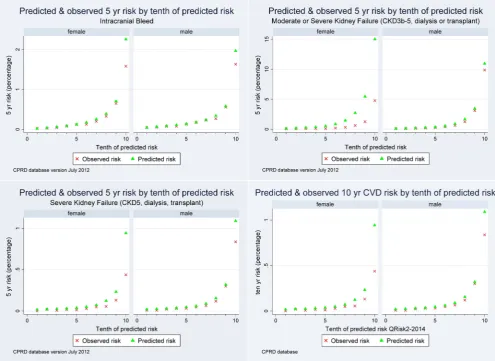
Figure 1A–J compares the mean predicted risks and observed risks for each score across each 10th of pre-dicted risk (1 representing the lowest risk and 10 the
Figure 1 Calibration of each QPrediction score comparing the mean predicted risks with the observed risks in the CPRD cohort. (A) QThrombosis (venous thromboembolism). (B) QFracture (hip). (C) QFracture (hip, colles, spine, shoulder). (D) QStroke (ischaemic stroke). (E) QDiabetes (type 2 diabetes). (F) QBleed (upper gastrointestinal haemorrhage). (G) QBleed (intracranial haemorrhage). (H) QKidney (moderate or severe kidney failure). (I) QKidney (severe kidney failure). ( J) QRisk2 (cardiovascular disease). CPRD, Clinical Research Data Link; CKD, chronic kidney disease; CVD, cardiovascular disease.
Hippisley-Cox J,et al.BMJ Open2014;4:e005809. doi:10.1136/bmjopen-2014-005809 13
Open Access
on September 22, 2020 by guest. Protected by copyright.
http://bmjopen.bmj.com/
highest risk) and demonstrates that the models are gen-erally well calibrated for patients on CPRD.
The QKidney score (moderate or severe kidney failure) showed the observed risk was lower than the pre-dicted risk. This might indicate a degree of over predic-tion of the score. Alternatively, it could be related to the lower incidence rate of kidney failure observed among women on the CPRD compared with QResearch.
Web extratable 5presents the ROC, D and R2statistic for each score restricted to patients from CPRD with complete recording of laboratory and risk factor data for each score. The results were very similar to the results obtained using multiply imputed data set for the major-ity of scores except for QRISK2 and QStroke where values were lower. For example, the results for QFracture (hip fracture) in women on CPRD using multiply
imputed data were ROC of 0.89, R2of 70.6% and D
stat-istic of 3.17. The corresponding results restricted to women on CPRD with complete data were 0.9, 70.4% and 3.16. For QRISK2, the results for women for imputed data on CPRD were ROC of 0.88, R2 of 56.4% and D statistic of 2.33. The corresponding results for complete data were 0.79, 40.9% and 1.7.
Performance for the top decile of risk
Table 8shows the sensitivity, specificity and observed risk for patients in the top decile of each score on CPRD. The observed risk is higher than the risk threshold value since this represents the observed risk within the top decile of predicted risk. For example, the cut-off for the top 10th of risk for QFracture (fractured neck of femur) was a 10-year risk of 3.7%. At this threshold the sensitiv-ity was 66.5%, specificity 90.4% and observed risk 9.4%.
The results are similar to those obtained from
QResearch (not shown).
DISCUSSION
Summary of key findings
This is the first external validation of a set of
QPrediction scores on the CPRD. It is important since CPRD represents a fully independent sample of patients registered with general practices using a different clin-ical computer system (Vision system supplied by In Practice Systems) from the QResearch database (which is based on practices using EMIS clinical systems). Practices using the Vision system together with practices
Figure 1 (Continued)
on September 22, 2020 by guest. Protected by copyright.
using EMIS make up approximately 75% of all the English general practices. The discrimination and cali-bration statistics for each score were remarkably similar in CPRD to those published from validation cohorts from QResearch. Our paper also provides updated infor-mation on a direct comparison between two of the
world’s largest general practice databases which have
both been linked to mortality and second care data. Before a clinical risk score can be reliably used in clin-ical practice, evidence is needed that it can successfully predict the intended outcome in groups of patients other than ones used to develop the score but similar to ones in whom the score might be used. Not all risk
scores perform well in external samples—this can be
due to deficiencies in the design or modelling methods
used to derive the algorithm, if the model is over fitted or if there is an important predictor which is absent.21 Other reasons for poor performance include differences between the setting of patients in the new and derivation samples, differences in how information is recorded and differences in patient characteristics.21 It is for these reasons, that we have meticulously assembled the CPRD cohort using the same inclusion/exclusion criteria, defi -nitions of predictor and outcome variables as in the ori-ginal derivation studies. Any differences observed are therefore more likely to be due to capture of informa-tion and underlying populainforma-tion characteristics. In this study, we have found marginal differences in incidence rates between QResearch and CPRD and higher rates of recording of family history and ethnicity in QResearch though these have not been large enough to materially affect our results.
Strengths and limitations
One strength of using CPRD for risk score validation is that the risk score can be assessed using data collected in a similar manner to the data that would be used
when the risk score is used in clinical practice. CPRD only had Townsend score for patients recorded for approximately half their practices (unlike QResearch where Townsend score is included for all practices), so we had to limit the validation cohort in CPRD for this analysis to those practices with linked Townsend scores. We undertook a comparison between patients registered with CPRD practices with and without linked data. We
found marginally higher recording for ethnicity,
smoking, alcohol, clinical values for the CPRD cohort with linked data compared with the unlinked data but similar characteristics for demographics, comorbidities, medication and clinical values (results not shown), so we have no reason to believe this would have biased our results.
Another strength of general practice databases is the large volume of patients who tend to be representative of the general population. A limitation of routinely col-lected data is that not all patients will have all clinical and laboratory data recorded leading to missing data values in some of the parameters needed to calculate the risk scores. We have reported performance in all patients using multiple imputation to replace missing values and restricted to patients without missing values and found very similar results for the majority of algo-rithms tested. There was some degradation of perform-ance for algorithms, particularly for QRISK2 and QStroke, where there were large amounts of missing data. However, in clinical practice, the risk scores can be calculated using information recorded during consult-ation reducing the amount of missing data. Alternatively, the software which implements QPrediction scores includes algorithms which estimate BMI, systolic blood pressure and cholesterol/HDL ratio. The estimated values can be used where the relevant data are not recorded in order to generate an estimated risk score.
Effectively, the software emulates the multiple
Table 8 Performance of each score for predicting the relevant outcome in the CPRD validation cohort. The cut-off is the threshold of predicted risk for the top decile in the CPRD cohort
Score Outcome Duration
Cut-off (%) for top decile predicted risk
Sensitivity (%)
Specificity (%)
Observed risk (%)
QDiabetes Type 2 diabetes 10-year risk 13.0 44.8 91.0 20.8
QStroke Ischaemic stroke 10-year risk 10.5 54.7 90.8 16.1
QRISK2 Cardiovascular disease 10-year risk 20.7 49.9 91.9 31.8
QThrombosis Venous thromboembolism 5-year risk 1.5 36.2 90.1 2.6
QKidney Moderate-severe kidney failure
5-year risk 6.3 59.1 90.5 6.9
QKidney Severe kidney failure 5-year risk 0.4 58.5 90.0 0.7
QBleed Upper GI bleed 5-year risk 1.6 38.0 90.2 3.5
QBleed Intracranial bleed 5-year risk 0.9 44.2 90.1 1.6
QFracture Fractured neck of femur 10-year risk 3.7 66.5 90.4 9.4
QFracture Osteoporotic fracture 10-year risk 7.8 49.6 90.5 13.1
CPRD, Clinical Research Data Link; GI, gastrointestinal.
Hippisley-Cox J,et al.BMJ Open2014;4:e005809. doi:10.1136/bmjopen-2014-005809 15
Open Access
on September 22, 2020 by guest. Protected by copyright.
http://bmjopen.bmj.com/
imputation used in our validation which then gives the results based on multiply imputed data reasonable face validity.
The difficulty of obtaining a comprehensive code list for any given outcome or exposure is a limitation common to all research in primary care databases. We mitigated this by matching our code lists for the CPRD primary analysis to the code lists in the QResearch deriv-ation data set wherever possible. The CPRD database uses the same clinical coding system as QResearch for clinical values (it uses Read V.2). However, there is a third clinical system in use in England (SystmOne) which uses a different coding system known as Clinical terms V.3 (CTV3). While there is a mapping between Read codes and CTV3, we have not tested the algo-rithms on a database using CTV3 in this study so are unable to draw conclusions regarding the generalisabil-ity of the results of the validation to practices using this system.
The quality of information on CPRD is likely to be good since previous studies have validated similar out-comes and exposures and found levels of completeness and accuracy to be good.22 23
Comparison with other studies
The aim of this study was to validate a collection of QPrediction tools. The details of the derivation andfirst validation of each prediction tool have been separately published in the peer-reviewed literature including infor-mation on definitions of predictor variables with supple-mentary information available on the relevant websites. We have not duplicated information in the present paper but have provided the relevant links and references.
Our validation results confirm earlier studies under-taken on the THIN database (another general practice database which is derived from the Vision system but which is not linked to mortality data). These earlier studies include external validations of QRISK2,10 11 24
QDiabetes,12 QFracture9 and QKidney25 by an
inde-pendent team who were not involved in the develop-ment of the algorithms. These independent validations have demonstrated similar performance compared with the validations performed by study authors using the QResearch database. This study builds on previous vali-dations by providing new information on the perform-ance of scores not previously validated on an external database (QBleed and QThrombosis) and by utilising the linked data which were not available on the THIN database. Together with the present study (which includes a number of scores not previously tested in an external population), the results provide consistent evi-dence that these QPrediction scores are likely to provide appropriate estimates of disease risk in contemporary primary care populations in England and to discrimin-ate between patients at different levels of risk with rea-sonable reliability.
Comparison of QResearch and CPRD baseline characteristics
Overall, our results show a striking similarity between CPRD and QResearch cohorts for nearly all baseline characteristics. There are two notable exceptions. First, recording of ethnicity was higher in QResearch than CPRD. Second, fewer patients in the CPRD cohort had a recorded family history of diabetes and coronary heart
disease in a first degree relative under the age of
60 years. Recording differences in ethnicity and family history were not explained by geographic differences or difference in data capture period between the two data-bases. Given the similarity for the other risk factors and treatments, it is likely that the difference in ethnicity
and family history recording reflects a difference in
recording patterns between the two clinical computer systems rather than a true difference between the two cohorts. A similar pattern for recording of ethnicity and family history was also reported in the validation of
QRISK on the THIN database.11 26 This was thought to
be due to different usage of clinical templates in the clinical system, with EMIS practices having ethnicity and family history included more often thereby prompting the user to enter this information in a more systematic fashion.
Comparison of QResearch and CPRD incidence rates
The age standardised incidence rates for each condition were generally marginally higher on QResearch than
CPRD although the proportions of events identified on
GP data (out of all events recorded on either GP or linked mortality data) were very close. This suggests that patterns of recording of major clinical events are very similar between QResearch and CPRD although the absolute value varies by clinical condition. For example, 91% of ischaemic stroke events recorded on either GP or linked mortality data are identified on the GP record compared with 99% of hip fractures. We also note the lower levels of total cardiovascular events in the GP clin-ical record which was between 13% and 15% lower than the total recorded on either the GP record, the linked mortality record or the linked hospital admissions
record. Some of this will reflect new sudden events
where the first presentation was a hospital admission or
death while others may reflect some
under-representation of existing cases not recorded in the GP record. Our study is unable to distinguish between these two scenarios, though the latter one potentially has
clin-ical consequences if the patient is not identified as
having cardiovascular disease as they may not be offered secondary prevention.
We think that the information on baseline character-istics and incidence rates will have a utility beyond the present study since it suggests that both databases are fundamentally similar in many aspects and likely to gen-erate similar results for a range of epidemiological studies.27
on September 22, 2020 by guest. Protected by copyright.
Summary
In summary, we have tested a set of QPrediction scores using an external independent cohort of practices con-tributing to the CPRD. The results demonstrate good performance, comparable to the results obtained from
QResearch, meaning that the findings of studies
per-formed in either database are likely to be applicable in England.
AcknowledgementsWe thank EMIS and EMIS practices for their contribution to the QResearch database. We thank CPRD and Vision Practices for allowing access to the CPRD for this study.
Contributors JH-C initiated the study, undertook the literature review, data extraction, data manipulation and primary data analysis and wrote the first draft of the paper. JH-C is the guarantor. CC contributed to the design, analysis, interpretation and drafting of the paper. PB contributed to the development of core ideas, the analysis plan, interpretation of the results and drafting of the paper.
Funding The validation of the QPrediction scores is funded by the National Institute for Health Research’s School for Primary Care Research ( project reference number 094).
Competing interests JH-C is professor of clinical epidemiology at the University of Nottingham and codirector of QResearch—a not-for-profit organisation which is a joint partnership between the University of Nottingham and EMIS (leading commercial supplier of IT for 60% of general practices in the UK). JH-C is also director of ClinRisk Ltd which produces open and closed source software to ensure the reliable and updatable implementation of clinical risk algorithms within clinical computer systems to help improve patient care. CC is associate professor of Medical Statistics at the University of Nottingham and a consultant statistician for ClinRisk Ltd. PB has received financial support for undertaking the validation work from the National School for Primary Care Research.
Ethics approval The project was approved in accordance with the QResearch agreement with Trent Research Ethics Committee (ref 03/04/021) and approved by the ISAC committee of the CPRD (ref 13_079).
Provenance and peer review Not commissioned; externally peer reviewed. Data sharing statement No additional data are available.
Open Access This is an Open Access article distributed in accordance with the Creative Commons Attribution Non Commercial (CC BY-NC 4.0) license, which permits others to distribute, remix, adapt, build upon this work non-commercially, and license their derivative works on different terms, provided the original work is properly cited and the use is non-commercial. See: http:// creativecommons.org/licenses/by-nc/4.0/
REFERENCES
1. Hippisley-Cox J, Coupland C, Vinogradova Y,et al. Predicting cardiovascular risk in England and Wales: prospective derivation and validation of QRISK2.BMJ2008;336:1475–82.
2. Hippisley-Cox J, Coupland C, Brindle P. Derivation and validation of QStroke score for predicting risk of ischaemic stroke in primary care and comparison with other risk scores: a prospective open cohort study.BMJ2013;346:f2573.
3. Hippisley-Cox J, Coupland C, Robson J,et al. Predicting risk of type 2 diabetes in England and Wales: prospective derivation and validation of QDScore.BMJ2009;338:b880.
4. Hippisley-Cox J, Coupland C. Predicting risk of osteoporotic fracture in men and women in England and Wales: prospective derivation and validation of QFracture scores.BMJ2009;339:b4229. 5. Hippisley-Cox J, Coupland C. Predicting the risk of chronic kidney
disease in men and women in England and Wales: prospective derivation and external validation of the QKidney(R) scores.BMC Fam Pract2010;11:49.
6. Hippisley-Cox J, Coupland C. Development and validation of risk prediction algorithm (QThrombosis) to estimate future risk of venous thromboembolism: prospective cohort study.BMJ2011;343:d4656. 7. Hippisley-Cox J, Coupland C. Predicting risk of emergency
admission to hospital using primary care data: derivation and validation of QAdmissions.BMJ2013;3:e003482.
8. Hippisley-Cox J, Coupland C, Robson J,et al. Derivation, validation, and evaluation of a new QRISK model to estimate lifetime risk of cardiovascular disease: cohort study using QResearch database. BMJ2010;341:c6624.
9. Collins GS, Mallett S, Altman DG. Predicting risk of osteoporotic and hip fracture in the United Kingdom: prospective independent and external validation of QFracture scores.BMJ2011;342:d3651. 10. Collins GS, Altman DG. An independent and external validation of
QRISK2 cardiovascular disease risk score: a prospective open cohort study.BMJ2010;340:c2442.
11. Collins GS, Altman DG. An independent external validation and evaluation of QRISK cardiovascular risk prediction: a prospective open cohort study.BMJ2009;339:b2584.
12. Collins GS, Altman DG. External validation of the QDScore for predicting the 10-year risk of developing type 2 diabetes.Diabet Med2011;28:599–607.
13. Hippisley- CJ, Coupland C. Predicting risk of upper gastrointestinal bleed and intracranial bleeding with anticoagulants: cohort study to derive and validate the QBleed score.BMJ2014;349:g4606. 14. Royston P, White I. Multiple Imputation by Chained Equations
(MICE): implementation in Stata.J Stat Software2011;45:1–20. 15. Gray A, Clarke P, Farmer A,et al. Implementing intensive control of
blood glucose concentration and blood pressure in type 2 diabetes in England: cost analysis (UKPDS 63).BMJ2002;325:860. 16. Royston P. Multiple imputation of missing values.Stata J
2004;4:227–41.
17. Hippisley-Cox J, Coupland C, Vinogradova Y,et al. Derivation and validation of QRISK, a new cardiovascular disease risk score for the United Kingdom: prospective open cohort study.BMJ
2007;335:136.
18. Royston P, Sauerbrei W. A new measure of prognostic separation in survival data.Stat Med2004;23:723–48.
19. Royston P. Explained variation for survival models.Stata J 2006;6:1–14.
20. Royston P, Altman DG. External validation of a Cox prognostic model: principles and methods.BMC Med Res Methodol2013;13:33. 21. Altman DG, Vergouwe Y, Royston P,et al. Prognosis and prognostic
research: validating a prognostic model.BMJ2009;338(may28_1): b605.
22. Herrett E, Thomas SL, Schoonen WM,et al. Validation and validity of diagnoses in the General Practice Research Database: a systematic review.Br J Clin Pharmacol2010;69:4–14.
23. Khan NF, Harrison SE, Rose PW. Validity of diagnostic coding within the General Practice Research Database: a systematic review.Br J Gen Pract2010;60:e128–36.
24. Collins GS, Altman A. Predicting the 10 year risk of cardiovascular disease in the United Kingdom: independent and external validation of an updated version of QRISK2.BMJ2012;344:e4181.
25. Collins GS, Altman D. Predicting the risk of chronic kidney disease in the UK: an evaluation of QKidney scores using a primary care database.Br J Gen Pract2012;62:e243–50.
26. Hippisley-Cox J, Coupland C, Vinogradova Y,et al. Performance of the QRISK cardiovascular risk prediction algorithm in an
independent UK sample of patients from general practice: a validation study.Heart2008;94:34–9.
27. Reeves D, Springate DA, Ashcroft DM,et al. Can analyses of electronic patient records be independently and externally validated? The effect of statins on the mortality of patients with ischaemic heart disease: a cohort study with nested case–control analysis.BMJ Open2014;4:e004952.
28. Hippisley-Cox J, Coupland C. QRISK2-2014 annual update information, 2014:5.
29. Hippisley-Cox J, Coupland C. Derivation and validation of updated QFracture algorithm to predict risk of osteoporotic fracture in primary care in the United Kingdom: prospective open cohort study.BMJ 2012;344(may22 1):e3427–27.
30. Hippisley-Cox J, Coupland C. QDiabetes 2013 annual update information secondary QDiabetes 2013 annual update information 2013. http://qdiabetes.org/QDiabetes-2013-Annual-Update-Information.pdf
Hippisley-Cox J,et al.BMJ Open2014;4:e005809. doi:10.1136/bmjopen-2014-005809 17
Open Access
on September 22, 2020 by guest. Protected by copyright.
http://bmjopen.bmj.com/