DOI: 10.5958/2230-732X.2017.00084.5 ©2017New Delhi Publishers. All rights reserved
SOIL SCIENCE
Determination of Soil Water Stress Coefficient by different
Methods for Computing Crop Transpiration Under Bed
Planted Pigeon Pea
Vikas Rai
1*, Pragati Pramanik
1, Pramila Aggarwal
1,
Pramila Krishnan
1,
Amitava Rakshit
2, T.K. Das
3and Rekha Meena
11Division of Agricultural Physics, ICAR- Indian Agricultural Research Institute, New Delhi, India
2Department of Soil Science & Agricultural Chemistry, Institute of Agricultural Science, BHU, Varanasi, India 3Division of Agronomy, ICAR- Indian Agricultural Research Institute, New Delhi, India
*Corresponding author: [email protected] (ORCID ID: 0000-0003-3249-2567)
Paper No.: 629 Received: 17-09-2017 Accepted: 16-11-2017
ABSTRACT
To achieve the potential crop yield, time and amount of irrigation required for a particular crop under field condition should be quantified. Since soil water stress occurs after few days of irrigation, it affects root water uptake and hence transpiration rate. This stress effect can be quantified by soil water stress coefficient (Ks). Whenever, total available water (TAW) and readily available water (RAW) data are available, a simple Ks calculation can be done. To present a more realistic scenario, Ks can also be computed from simulated root water uptake (RWU) using HYDRUS-2D model. To check the reliability of model, our study was conducted under permanent raised bed with residue (PBB+R) and conventional tillage (CT) system in a pigeonpea (Cajanus cajan (L.) Millsp.)-wheat (Triticum aestivum) cropping system with the objective to compare actual measured transpiration rate with those simulated from model and calculated from FAO method. Soil water balance simulated (100-125 DAS) from HYDRUS-2D model showed higher cumulative root water uptake (CRWU) (1.72 cm), lower cumulative evaporation (CE) (0.34 cm) and higher soil water retention in PBB+R than in CT. Ks calculated from both the methods showed that under low soil moisture condition in root zone, Ks significantly reduced RWU whereas when root zone is sufficiently wet, Ks have very negligible effect. Model simulated actual transpiration rates were comparable with observed values whereas values computed from FAO method showed substantial deviation. Thus Ks obtained from model output showed the better soil moisture stress condition of the profile as it takes into account root growth parameters, radiation interception and crop canopy conditions. So, this model may be adopted for evaluating different management practices in terms of improvement in soil water use.
Highlights
mPermanent raised bed along with residue retention improves root water uptake in pigeonpea.
mAverage transpiration rate obtained from HYDRUS-2D gives better results
Keywords: Conservation agriculture, HYDRUS-2D, actual transpiration, root water uptake, stress coefficient
Pigeon pea (Cajanus cajan (L.) Millsp.) is usually known as red gram and an main legume crop in the dry-land agriculture, as because it produces large biomass as well as protein-rich seeds (Jat et al.
2010). It is mostly grown in the rainy season (June –Nov). Pigeon peas can grow in the areas where annual average rainfall is less than 650 mm as it
a drought resistant but moisture stress during the crop growth season is one of the main restrictions in pigeon-pea. Yield Many researchers have reported that more than 50% of yield loss in pigeon-pea is due to drought (Roder et al. 1998; Sharma et al.
the reduction in, number of pods, reduction in pod weight etc. The plant physiological processes get affected because of moisture stress in plant (Patel et al. 2001). Few studies reported that moisture stress becomes very serious in early growth stage, grain filling and pod development stages (Srikrishnah et al. 2007), which influence the reduction of the plant’s biometric growth and ultimately reduce the grain yield. The effect of soil water stress can be quantified by soil water stress coefficient (Ks). Water stress in plant can be reduced by soil water management practices. The moisture lost through runoff and evaporation must be reduced and the total amount of water that enters into the soil must be increased. The water stress effect on pigeon pea has not been deeply studied so far (Lopez et al. 1988; Porter Monty et al. 2011). One of the efficient management practices to improve water use in pigeon pea is to adopt conservation agriculture practices. Whenever, total available water (TAW) and readily available water (RAW) data are available, a simple Ks calculation can be done. To present a more realistic scenario, Ks can also be computed from simulated root water uptake (RWU) using HYDRUS-2D model. Hence, objective of our study was to determine Ks from output of Hydrus-2D and to compare it with the value calculated from FAO.
MATERIAL AND METHODS
Details of field experimentation and weather
A Long term conservation agriculture (CA) field experiment was started in May 2010 at the experimental farm of Indian Agricultural Research Institute, New Delhi, India (28°35’ N latitude, 77°12’ E longitude and 228 MSL). The soil was alluvial type and with sandy clay loam texture (fine loamy, illitic, Typic: Haplustept). This research was conducted
during the kharif season of 2016 in pigeonpea
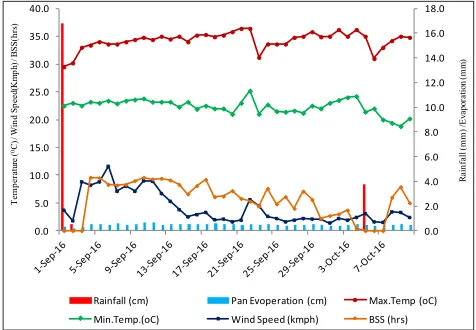
crop under pigeonpea – wheat cropping system. The weather conditions during kharif season for simulation period i.e. 100-125 DAS (8 September to 3 October) are given in Fig. 1.
The meteorological data indicated that daily
maximum temperature during that period fluctuated from 29.5°C to 36.4°C in 2016. Similarly daily minimum temperature during simulation period fluctuated from 18.8 to 25.2°C. There was no rainfall and prolonged dry spell was there. During kharif
2016, pigeonpea variety Pusa 992 was shown. Although the experimental treatments consisted of conventional tillage (CT), permanent narrow bed (PNB) (one row of pigeonpea per 40 cm wide bed and 30 cm wide furrow), permanent broad bed (PBB) (two rows of pigeonpea per 100 cm wide bed and 40 cm wide furrow), PBB along with crop residue (PBB+R), and PNB along with crop residue (PNB+R) since 2011.
From 2012 onwards, two other treatments like zero tillage (ZT) plus ZT along with crop residue retention of previous crops (ZT+R) were taken. But from several previous studies, it has been reported that PBB+R treatment is performing superior over all other treatments (Aggarwal et al.
2017; Bhattacharyya et al. 2015 & Das et al. 2014). So for our study we have selected two treatments i.e. PBB+R and CT. Simulation was done at pod development stage of pigeon pea (i.e. 100 to 125 days after sowing (DAS). Field was once irrigated on 117 DAS during simulation period.
0.0 2.0 4.0 6.0 8.0 10.0 12.0 14.0 16.0 18.0 0.0 5.0 10.0 15.0 20.0 25.0 30.0 35.0 40.0 R ain fa ll ( m m ) /E va po ra tio n ( m m ) T em per at ur e ( 0C ) / W in d S pe ed (K m ph ) / B SS (h rs )
Rainfall (cm) Pan Evoperation (cm) Max.Temp (oC) Min.Temp.(oC) Wind Speed (kmph) BSS (hrs)
Fig. 1: Weather condition during Simulation Period
Hydrus-2D model and its calibration
description of the inverse modeling procedure in determining the hydraulic parameters is available in Šimůnek et al. (2012 (b)).
Transpiration rate
Transpiration rate Tr (t) at a given time t is related to mean transpiration rate Trmean using the following equations (Fayer, 2000):
T(t) = 0.24 Tmean t < 0:264 d; t > 0:736d …(1)
T(t) = 2.75 Tmean Sin
2 2 2
t day
π π
−
t € (0.264d,
0.736d) …(2)
Hence, the maximum transpiration rate Trmax (which occurs when θ= π/2 i.e. Sin π/2 = 1) is equal to 2.75
Trmean
Trmean= Trmax/2.75 …(3)
The maximum transpiration rate (Tmax) was measured in the field using Infra red gas analyzers (IRGA) (Wang et al. 2007) on 102,107, 112 and 119 DAS.
Calculation of KS
KS is calculated according to the Allen et al. (1998) FAO-56 method
_ r
s
TAW D FAO K
TAW RAW −
= − …(4)
Where, TAW: total soil water in the root zone (mm), Dr : root zone depletion (mm) & RAW: readily available water (mm).
From model KS is calculated according to the Deb
et al. (2013)
AET _
PET s
Simulated Model K
Calculated
= …(5)
RESULTS AND DISCUSSION
Optimized soil hydraulic parameters through inverse modeling
The calibrated values for θr, θs α, n and Ks estimated from the inverse modeling for the soil layers are shown in Table 1 for CT and PBB+R plot respectively. The result of inverse modeling shows
that saturated moisture content were comparable in both plots with slightly higher in PBB+R over CT i.e mainly due to more organic matter addition while residual moisture content.
Soil water content (θ) and Root Zone Depletion (Dr) during the simulation period
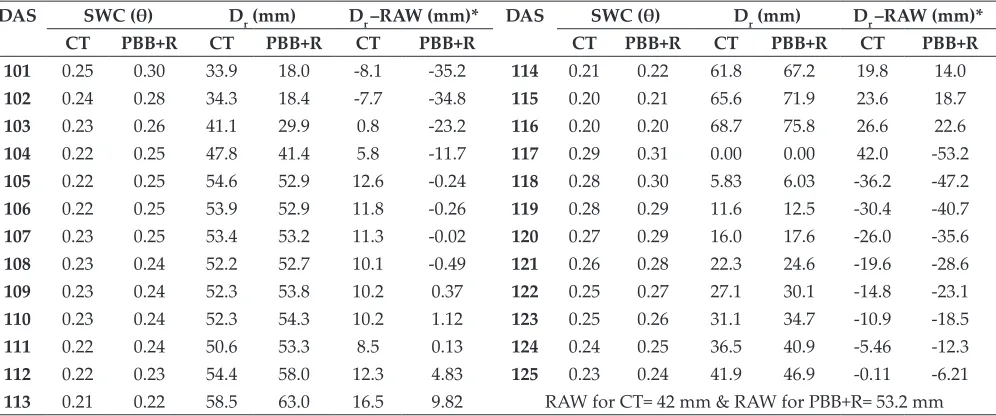
Daily average SWC of 0-45 cm soil depth was higher by 1-4% in PBB+R as compare to CT (Table 1) for the whole period of simulation (i.e. 100-125 days of crop growth). The higher SWC in PBB+R may be because of higher crop residue cover and more soil organic carbon in the soil profile (Bhattacharyya
et al. 2015). Computed Dr values was higher for CT and varied between 0-68.68 mm for the simulation period (Table 2). Dr value of zero showed the SWC for that day was greater than equal to field capacity value and maximum Dr value represented the driest condition of soil i.e. just before irrigation or rainfall. In PBB+R, Dr value ranged between 0- 75.88 mm. Result showed that moisture depletion was more from PBB+R for the simulation period. The reason may be because of more extensive root growth and better crop canopy condition in PBB+R (Aggarwal
et al. 2017). RAW values were 42 mm and 53.2 mm for CT and PBB+R, respectively. The negative value for the term (Dr-RAW) showed that KS was not dominant when Dr< RAW and KS=1 whereas positive value for (Dr-RAW) represented that KS was determining factor when Dr>RAW and KS<1. Available water capacity values for specific soils can be obtained from http://websoilsurvey.nrcs. usda.gov/app/.
Comparison of KS value derived from model and FAO method during simulation period
tabulated values from Allen et al. (1998), In case of PBB+R, ranges of KS reduced which indicated that crop experienced less soil moisture stress and for short duration during the simulation period. It may be because of penetration of root into deeper layer, higher root length density, more LAI, higher
transpiration rate and reduced evaporation from soil surface due to residue retention on soil surface (Aggarwal et al. 2017). Lower value of KS in CT
indicated that soil moisture availability for uptake through plant root was less and plant experienced soil moisture stress for prolonged time during the
Table 1: Soil hydraulic parameters optimized through inverse modeling for CT and PBB+R treatment. (Rai, 2017)
Depth (cm)
θr (cm3cm-3)
θs
(cm3cm-3) α n
Ksat
(cm day-1)
CT PBB+R CT PBB+R CT PBB+R CT PBB+R CT PBB+R
0-15 0.060 0.010 0.39 0.39 0.010 0.010 1.252 1.25 64.72 54
15-30 0.079 0.090 0.38 0.39 0.043 0.027 1.46 1.39 68 53
30-45 0.075 0.085 0.37 0.41 0.054 0.029 1.53 1.34 58 62
Table 2: Calculated SWC and Dr for CT and PBB+R during the simulation period
DAS SWC (θ) Dr (mm) Dr –RAW (mm)* DAS SWC (θ) Dr (mm) Dr –RAW (mm)*
CT PBB+R CT PBB+R CT PBB+R CT PBB+R CT PBB+R CT PBB+R
101 0.25 0.30 33.9 18.0 -8.1 -35.2 114 0.21 0.22 61.8 67.2 19.8 14.0
102 0.24 0.28 34.3 18.4 -7.7 -34.8 115 0.20 0.21 65.6 71.9 23.6 18.7
103 0.23 0.26 41.1 29.9 0.8 -23.2 116 0.20 0.20 68.7 75.8 26.6 22.6
104 0.22 0.25 47.8 41.4 5.8 -11.7 117 0.29 0.31 0.00 0.00 42.0 -53.2
105 0.22 0.25 54.6 52.9 12.6 -0.24 118 0.28 0.30 5.83 6.03 -36.2 -47.2
106 0.22 0.25 53.9 52.9 11.8 -0.26 119 0.28 0.29 11.6 12.5 -30.4 -40.7
107 0.23 0.25 53.4 53.2 11.3 -0.02 120 0.27 0.29 16.0 17.6 -26.0 -35.6
108 0.23 0.24 52.2 52.7 10.1 -0.49 121 0.26 0.28 22.3 24.6 -19.6 -28.6
109 0.23 0.24 52.3 53.8 10.2 0.37 122 0.25 0.27 27.1 30.1 -14.8 -23.1
110 0.23 0.24 52.3 54.3 10.2 1.12 123 0.25 0.26 31.1 34.7 -10.9 -18.5
111 0.22 0.24 50.6 53.3 8.5 0.13 124 0.24 0.25 36.5 40.9 -5.46 -12.3
112 0.22 0.23 54.4 58.0 12.3 4.83 125 0.23 0.24 41.9 46.9 -0.11 -6.21
113 0.21 0.22 58.5 63.0 16.5 9.82 RAW for CT= 42 mm & RAW for PBB+R= 53.2 mm *For Dr > RAW: KS <1 & Dr < RAW: KS =1 (FAO-56 manual by Allen et al. 1998)
Table 3: Calculated KS value from model and FAO method for PBB+R and CT during simulation period
DAS CT
KS_Model
PBB+R KS _Model
CT KS ( FAO)
PBB+R KS ( FAO)
DAS CT
KS_Model
PBB+R KS_Model
CT KS (FAO)
PBB+R KS ( FAO) 101 0.39 0.68 1.00 1.00 112 0.06 0.19 0.80 0.94
102 0.20 0.66 1.00 1.00 113 0.06 0.17 0.74 0.88
103 0.14 0.64 1.00 1.00 114 0.05 0.15 0.69 0.82
104 0.11 0.63 0.91 1.00 115 0.06 0.14 0.63 0.77
105 0.10 0.56 0.80 1.00 116 0.04 0.22 0.58 0.72
106 0.08 0.47 0.81 1.00 117 0.72 0.70 1.00 1.00
107 0.09 0.41 0.82 1.00 118 0.83 0.85 1.00 1.00
108 0.07 0.34 0.84 1.00 119 1.11 0.85 1.00 1.00
109 0.06 0.28 0.84 1.00 120 0.74 0.80 1.00 1.00
110 0.07 0.25 0.84 0.99 121 0.85 0.69 1.00 1.00
simulation period. This was mainly due to the fact that root growth in CT was mainly confined in upper few centimeter of soil depth and plant became unable to extract soil moisture from deeper layer and evaporation from soil surface was more (Aggarwal et al. 2017). Computed Ks from model showed lower value of KS both in PBB+R and CT as compare to KS obtained from FAO method. This may be due to the fact that in FAO method, soil moisture stress has been calculated by only considering the moisture status of the soil but model has considered root characteristics also which played a very significant role in root water uptake.
Transpiration rate variation during simulation period
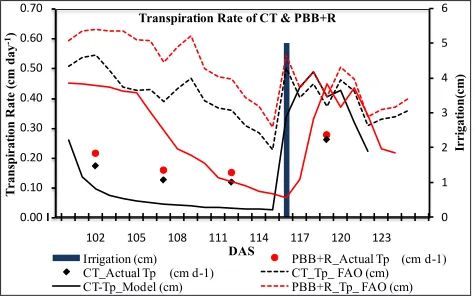
In Fig. 2, it has been seen that during the simulation period (100-125 DAS) model simulated transpiration rate varied from 0.07 to 0.45 cm day-1 with an
average value of 0.26 cm day-1 whereas in CT
transpiration rate varied from 0.02 to 0.49 cm day-1
with an average value of 0.16 cm day-1.
0 1 2 3 4 5 6
0.00 0.10 0.20 0.30 0.40 0.50 0.60 0.70
102 105 108 111 114 117 120 123
Ir
ri
ga
tio
n(c
m)
T
ran
sp
ir
at
ion
R
at
e (
cm
d
ay
-1)
DAS
Transpiration Rate of CT & PBB+R
Irrigation (cm) PBB+R_Actual Tp (cm d-1) CT_Actual Tp (cm d-1) CT_Tp_ FAO (cm) CT-Tp_Model (cm) PBB+R_Tp_ FAO (cm)
Fig. 2: Actual Vs. simulated transpiration for PBB+R and CT during simulation period
Transpiration rate obtained from FAO varied from 0.30 to 0.63 cm day-1 (mean value 0.49 cm day-1) in
PBB+R and 0.22 to 0.54 cm day-1 (mean value 0.40
cm day-1) in CT during the simulation period. Actual
average transpiration rate measured on 102, 110, 115 and 119 DAS. Actual transpiration rate were 0.22, 0.16, 0.15, 0.28 cm day-1 in PBB+R and 0.17, 0.12,
0.12, 0.26 cm day-1 in CT on 102, 110, 115 and 119
DAS, respectively. Transpiration rate obtained by FAO method was higher than observed values as well as model simulated values. This may be due to the fact that FAO method mainly considers the climatic factors whereas plant canopy conditions (i.e LAI), fIPAR, rooting characteristics have been consider in model.
Soil water balance
From Table 4 it is clearly indicated that cumulative root water uptake (CRWU) values of CT (7.11cm) treatments were substantially lower than PBB+R (8.83 cm) treatment. Retention of crop residues in PBB+R treatments significantly improved their CRWU values. While cumulative evaporation (CE) from soils under CT (2.15 cm) was 0.34 cm higher than PBB+R (1.81 cm) which showed retention of crop residues over soil surface reduces CE. Cumulative drainage under PBB+R treatment (3.35 cm) was about 0.51 cm higher than CT (2.84 cm). It was also seen that both initial as well as final SWC values of the profile were significantly higher in PBB+R (15.95 & 8.7 cm) than CT (14.31 & 4.72 cm). The results thus clearly showed that bed planting system significantly enhanced soil water retention in the root zone. Crop residue retention further improved the soil water storage capacity in above CA practice. The balance between both input and output sides of water balance equation showed a change of 2.49 to -1.24 cm. It was mainly because Hydrus 2D model is a numerical simulation model which given an approximate solution of water transport equation (not an exact solution), hence causes an error in computation which is dependent on the size of mesh used in the transport domain.
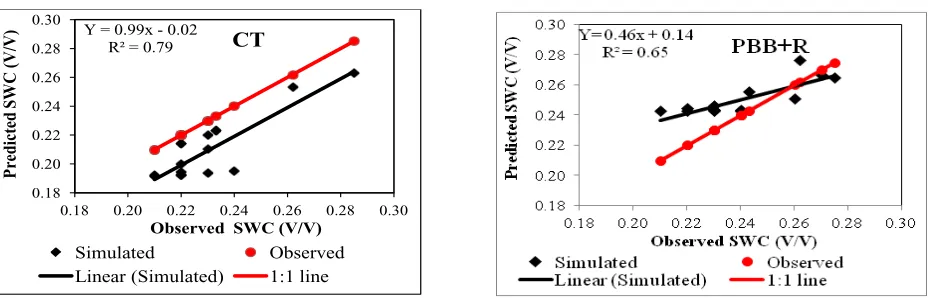
Validation of the model
Fig. 3 compared the SWC predicted by Hydrus 2D model during simulation period along with the Field observed values of SWC (gravimetric method) on 101, 104, 110, 115 and 123 DAS (testing data set (3*5), n=15) in both the treatments. Results showed a
Table 4: Simulated soil water balance components (Rai, 2017)
Treatment Simulation period
(DAS) CRWU (cm) CD (cm) CE (cm) RF/IR (cm) Initial SWC (cm) Final SWC (cm)
CT 100-125 7.11 2.84 2.15 5 14.31 4.72
relatively more strong correlation with CT treatment (R2=0.79) than PBB+R (R2=0.65). Presence of more
organic matter in PBB+R is the major reason behind relatively less correlation as model does not account effect of organic matter on water retention.
CONCLUSION
Accurate evapotranspiration (ET) estimation and its separation into transpiration and evaporation are essential for better water management strategies in pigeon pea under conservation agriculture. Our study proved that model simulated actual transpiration rates were comparable with observed values whereas values computed from FAO method showed substantial deviation. Thus KS (which is very important in irrigation scheduling) obtained from model output showed the better soil moisture stress condition of the profile as it takes into account root growth parameters, radiation interception and crop canopy conditions. We believe that information obtained in our study can be utilized for developing better management practices for different crops. It can be used to further improve the estimates of ET components for different crops. So, this model may be adopted for evaluating different management practices in terms of improvement in soil water use.
ACKNOWLEDGEMENTS
The findings of the paper are a part of M.Sc. thesis. So the authors are thankful to Indian Council of Agricultural Research for providing the financial support in the form of scholarship and Indian Agricultural Research Institute for providing facilities for conducting experiment and come out with a good result.
REFERENCES
Aggarwal, P., Bhattacharyya, R., Mishra, A.K., Das, T.K., Šimůnek, J., Pramanik, P. and Kamble, K.H. 2017. Modelling soil water balance and root water uptake in cotton grown under different soil conservation practices in the Indo-Gangetic Plain. Agriculture, Ecosystems & Environment, 240: 287-299.
Allen, R.G., Pereira, L.S., Raes, D. and Smith, M. 1998. Crop evapotranspiration-Guidelines for computing crop water requirements. FAO Irrigation and drainage paper 56. FAO, Rome, 300(9): D05109.
Bhattacharyya, R., Das, T.K., Sudhishri, S., Dudwal, B., Sharma, A.R., Bhatia, A., and Singh, G. 2015. Conservation agriculture effects on soil organic carbon accumulation and crop productivity under a rice–wheat cropping system in the western Indo-Gangetic Plains. European Journal of Agronomy, 70: 11-21.
Das, T.K., Bhattacharya, R., Sudhishri, S., Sharma, A.R., Saharawat, Y.S., Bandyopadhyay, K.K., Sepat, S., Bana, R.S., Agarwal, P., Sharma, R.K., Bhatia, A., Singh, G., Datta, S.P., Kar, A., Singh, B., Singh, P., Pathak, H., Vyas, A.K., Jat, M.L. 2014. Conservation agriculture in an irrigated cotton-wheat system of the western Indo-Gangetic Plains: crop and water productivity and economic profitability. Field Crops Res.,158: 24–33.
Deb, S.K., Shukla, M.K., Šimůnek, J. and Mexal, J.G. 2013. Evaluation of spatial and temporal root water uptake patterns of a flood-irrigated pecan tree using the HYDRUS (2D/3D) model. Journal of Irrigation and Drainage Engineering, 139(8): 599-611.
Fayer, M.J., 2000. UNSAT-H Version 3.0: Unsaturated Soil Water and Heat Flow Model: Theory, User Manual, and Examples. PNNL-13249. Pacific Northwest National Laboratory, Richland, WA.
https://websoilsurvey.nrcs.usda.gov/app/ (Accessed on December 30, 2016)
Jat, R.A. and Ahlawat, I.P.S. 2010. Effect of organic manure and sulphur fertilization in pigeonpea (Cajanus cajan) + groundnut (Arachis hypogaea) intercropping system. Indian Journal of Agronomy, 55(4): 276.
Y = 0.99x - 0.02 R² = 0.79
0.18 0.20 0.22 0.24 0.26 0.28 0.30
0.18 0.20 0.22 0.24 0.26 0.28 0.30
Pred
ict
ed
S
W
C
(V
/V
)
Observed SWC (V/V)
CT
Simulated Observed
Linear (Simulated) 1:1 line
Patel, N.R., Mehta, A.N., and Shekh, A.M. 2001. Canopy temperature and water stress quantificaiton in rainfed pigeonpea (Cajanus cajan (L.) Millsp.). Agricultural and Forest Meteorology, 109(3): 223-232.
Rai, V. 2017. ‘Modeling soil hydrothermal dynamics, root water uptake and radiation use in pigeon pea under conservation agriculture’. M.Sc. Thesis, Division of Agricultural Physics, Indian Agricultural Research Institute, New Delhi, India, pp. 67.
Rai, V., Aggarwal, P., Pramanik, P., Bhattacharyya, R., Krishnan, P. and Sehgal, V.K. 2017a. Modeling Coupled Water and Heat Transport in the Root Zone of pigeon pea under different conservation agriculture Conditions. . In: Souvenir, International Conference on Agricultural, Allied Sciences & Biotechnology for Sustainability of Agriculture, Nutrition & Food Security, 25-26 November, 2017, Institute of Science, Banaras Hindu University, Varanasi, pp. 89.
Rai, V., Pramanik, P., Aggarwal, P., Krishnan, P. and Bandyopadhyay, K.K. 2017b. Modeling soil water balance and root water uptake in bed planted pigeon pea using Hydrus- 2D. In: Abstract, National Seminar on Developments in Soil Science, Indian Society of Soil Science, 11-14 December, 2017, Amity University, Kolkata, pp.11.
Ritchie, J.T. 1972. Model for predicting evaporation from a row crop with incomplete cover. Water Resources Research, 8(5): 1204-1213.
Roder, W., Maniphone, S. and Keoboulapha, B. 1997. Pigeon pea for fallow improvement in slash-and-burn systems in the hills of Laos?. Agroforestry Systems, 39(1): 45-57. Sharma, A. and Guled, M.B. 2012. Effect of set-furrow method
of cultivation in pigeonpea+ greengram intercropping system in medium deep black soil under rainfed conditions. Karnataka Journal of Agricultural Sciences, 25(1): 22-24.
Šimůnek, J., M.Th. van Genuchten and Šejna, M. 2012 (b). HYDRUS: Model use, calibration, and validation. Transactions of the ASABE, 55(4): 1261-1274.
Srikrishnah, S. and Mahendran, S. 2007. The effects of soil moisture stress on the leaf water potential and yield of mung bean var. MI-6 at different growth stages. Sri Lanka Association for Advancement Science Proceeding 63rd
Annual Session.
Wang, X.B., Cai, D.X., Perdok, U.D., Hoogmoed, W.B. and Oenema, O. 2007. Development in conservation tillage in rainfed regions of North China. Soil Tillage Research,