R E S E A R C H A R T I C L E
Open Access
A meta-analysis of the performance of the
Pima
TM
CD4 for point of care testing
Lesley E. Scott
1*, Jennifer Campbell
2, Larry Westerman
3, Luc Kestens
4,5, Lara Vojnov
2, Luciana Kohastsu
3,
John Nkengasong
3, Trevor Peter
2and Wendy Stevens
1,6Abstract
Background:The Alere point-of-care (POC) Pima™CD4 analyzer allows for decentralized testing and expansion to testing antiretroviral therapy (ART) eligibility. A consortium conducted a pooled multi-data technical performance analysis of the Pima CD4.
Methods:Primary data (11,803 paired observations) comprised 22 independent studies between 2009–2012 from the Caribbean, Asia, Sub-Saharan Africa, USA and Europe, using 6 laboratory-based reference technologies. Data were analyzed as categorical (including binary) and numerical (absolute) observations using a bivariate and/or univariate random effects model when appropriate.
Results:At a median reference CD4 of 383 cells/μl the mean Pima CD4 bias is -23 cells/μl (average bias across all CD4 ranges is 10 % for venous and 15 % for capillary testing). Sensitivity of the Pima CD4 is 93 % (95 % confidence interval [CI] 91.4 % - 94.9 %) at 350 cells/μl and 96 % (CI 95.2 % - 96.9 %) at 500 cells/μl, with no significant difference between venous and capillary testing. Sensitivity reduced to 86 % (CI 82 % - 89 %) at 100 cells/μl (for Cryptococcal antigen (CrAg) screening), with a significant difference between venous (88 %, CI: 85 % - 91 %) and capillary (79 %, CI: 73 % - 84 %) testing. Total CD4 misclassification is 2.3 % cases at 100 cells/μl, 11.0 % at 350 cells/μl and 9.5 % at 500 cells/μl, due to higher false positive rates which resulted in more patients identified for treatment. This increased by 1.2 %, 2.8 % and 1.8 %, respectively, for capillary testing. There was no difference in Pima CD4 misclassification between the meta-analysis data and a population subset of HIV+ ART naïve individuals, nor in misclassification among operator cadres. The Pima CD4 was most similar to Beckman Coulter PanLeucogated CD4, Becton Dickinson FACSCalibur and FACSCount, and less similar to Partec CyFlow reference technologies.
Conclusions:The Pima CD4 may be recommended using venous-derived specimens for screening (100 cells/μl) for reflex CrAg screening and for HIV ART eligibility at 350 cells/μl and 500 cells/μl thresholds using both capillary and venous derived specimens. These meta-analysis findings add to the knowledge of acceptance criteria of the Pima CD4 and future POC tests, but implementation and impact will require full costing analysis.
Keywords:Pima CD4, Point of care testing, Meta-analysis, CD4 misclassification
Background
Globally, 34 million individuals are infected with HIV, and currently nearly 14 million worldwide are receiving antiretroviral therapy (ART) [1]. The number of add-itional HIV-positive patients eligible for ART has in-creased a further 12 million for a total of 25.9 million eligible patients. The treatment gap, however, remains
large and better methodologies or healthcare system changes are required to improve the number of individ-uals initiating treatment [2]. Many HIV-positive patients, however, do not have reliable access to required diagnos-tic laboratory tests, including CD4 enumeration since CD4 testing is often only available in regional laborator-ies. This longer turnaround time on results impacts on patient retention in care [3–5]. It should also be noted that the need for such testing and the thresholds of CD4 counts that clinicians deem relevant for treatment initiation are moving targets [6]. In addition to ART * Correspondence:[email protected]
1Department of Molecular Medicine and Haematology, Faculty of Health
Science, School of Pathology, University of the Witwatersrand, 7 York Road Parktown, Johannesburg, South Africa
Full list of author information is available at the end of the article
initiation, CD4 counts are also being used as a screening tool for reflex testing to screen for and prevent Crypto-coccal meningitis in patients with a CD4 count <100 cells/μl [2]. There is therefore a critical need to expand access to HIV diagnostic testing services.
Generally, method comparison studies of new tech-nologies compared to the reference techtech-nologies are per-formed to address these critical issues. The Pima CD4 (Alere, Jena, Germany) was one of the first commercially available point-of-care (POC) CD4 technologies. It en-tered the market in 2009 and provides a CD4 result in 20 min, is very easy to use, requires no refrigeration of reagents or controls, and can be operated with battery power [7]. Over many years the ART initiation target in many low- and middle-income countries has been CD4 counts <200 cells/μl, expanded more recently to include thresholds of <350 cells/μl [8] and was further raised to <500 cells/μl in the WHO 2013 guidelines [2]. The selection of accurate and affordable POC CD4 technolo-gies that can increase access to testing remains necessary in many regions for attaining ambitious 2015 treatment initiation goals [9]. Implementation of POC CD4 testing in primary health care facilities has been shown to re-duce test turnaround time, rere-duce pre-ART loss to follow-up, and increase prompt ART initiation [10, 11], yet implementing an inaccurate and imprecise CD4 test-ing platform would be costly to patients and national programs.
Despite the more than 50 technical evaluation studies of the Pima CD4 being performed in dozens of coun-tries, this has not been reported in a consolidated format nor has the venous versus capillary blood detection debate reached a conclusion. Each study adds to the breadth of knowledge, but there is little guidance on ac-ceptable evaluation criteria specifically for CD4 testing technologies [12]. We sought to conduct a pooled data meta-analysis to address these issues and generate guid-ance for national programs and future CD4 test devel-opers. The objectives of this pooled multi-data analysis were to summarize the performance of the Alere Pima POC CD4 technology at three clinical thresh-olds [100 cells/μl (to identify patients in need of reflex test-ing for prevention ofCryptococcalmeningitis); 350 cells/μl (to identify patients eligible for ART according to the 2010 WHO guidelines) and 500 cells/μl (to identify patients eligible for ART according to the 2013 WHO guidelines)] compared with several laboratory-based reference technologies and across global regions.
Methods
Study selection and data pooling
An initiative between researchers at the University of the Witwatersrand, the Clinton Health Access Initiative (CHAI), the World Health Organization (WHO) and the
US Centers for Disease Control and Prevention (CDC) led to the formation of a Pima CD4 consortium com-prising 34 individuals. Studies were either undergoing publication, already published evaluations on the Pima CD4, or were in-country regulatory evaluations of the technology and were willing to supply their study data. A PRISMA (Preferred Reporting Items for Systematic Reviews and Meta-Analyses) analysis was performed with a modified checklist since this “meta-analysis” in-volved re-analysis of observation pairs from groups will-ing to supply their data [13]. The STARSD (Standards for Reporting Studies of Diagnostic Accuracy) analysis criteria were followed where applicable to method com-parison of CD4 paired observations [14]. Data sets from each group were received in MS Excel format and merged into one worksheet containing the following minimum set of variables: observation pair number, country, Pima CD4 count (cells/μl), reference CD4 count (cells/μl) and type, specimen type (capillary or venous derived) and year in which observations were collected. The “predicate”, “in-country”, “gold standard”, “standard” and“reference”CD4 technology terminology often applied to CD4 enumeration evaluation studies are collectively referred to in this article as reference CD4 technology. These included the Beckman Coulter PanLeucogated CD4 (Beckman Coulter, Miami, FL, USA), the FACSCount, FACSCalibur and FACScan (Becton Dickinson Biosciences, San Jose, CA, USA), the CyFlow (Partec, Munster, Germany) and the Guava EasyCD4 (Merck Millipore, Billerica, MA).
Statistical analysis
Analyses were performed using MS Excel, Stata 13 (StataCorp, College Station, TX) and SAS (SAS Version 9.2,SAS Institute Inc). Data were analyzed as categorical (including binary) and numerical (absolute) observations and various subset analyses were performed as described in Table 1.
Results
Data characteristics
Table 1Description of data analysis
(a)Catagorical data analysis
Data format Methods
The number (proportion) of CD4 observations in the following CD4 categories: <100 cells/μl; 100–350 cells/μl; 350–500 cells/μl and >500 cells/μl was determined for both Pima CD4 and reference methods. The data were further divided into the type of specimen (venous or capillary) tested on the Pima CD4
Significance (p≤0.05) between categories was determined using the proportions test.
The Pima CD4 and reference CD4 observations were also converted to binary (0 = above the specified threshold and 1 = below the threshold). The observation pairs were also sorted by specimen type, comparator reference technology and year when observations were collected.
The false positive, false negative, sensitivity (ability to correctly identify patients requiring treatment) and specificity (ability to correctly identify patients not requiring treatment) were calculated for the three clinical thresholds of the entire dataset. The total misclassification rate (percentage) was calculated as the addition of false positive rate and false negative rate. The upward (percentage of patients requiring treatment incorrectly identified by the Pima CD4 as above the threshold) and downward (percentage of patients not requiring treatment incorrectly identified by the Pima CD4 as below the threshold) misclassification rates were calculated. The Q-statistic was calculated [35] to quantify and account for the presence of any study heterogeneity due to differences in sample size, study quality, study designs, and/or data collection methods. A bivariate and/or univariate random effects model was applied using METANDI commands in STATA 13.
(b)Numerical data analysis
Methods applied(where applicable, 95 % confidence intervals (CI) were reported)
Description
Data description. The CD4 count paired observations were described by mean (using random effects models), median and standard deviation (SD).
The agreement between the Pima CD4 and reference technology was measured using the Bland-Altman (bias [or mean difference] and SD of the bias) [23],
The Bland-Altman measures the difference between observation pairs (a-b), where method‘a’is the Pima CD4. The mean paired difference (the bias or accuracy) and SD of this bias (precision) were determined. A zero mean difference implies good accuracy between reference and Pima CD4 and a small SD of the bias implies good precision (low variability). The accuracy and precision are visually represented on a modified Bland-Altman difference plot with the paired difference on the vertical axis and the absolute CD4 count of the reference on the horizontal axis.
The agreement between the Pima CD4 and reference technology was also measured using the percentage similarity (mean, SD and coefficient of variation [CV]) [24],
The percentage similarity is calculated as the average between the reference and Pima CD4 technology represented as a percentage of the reference technology: [([a + b]/2) /b] × 100, where‘b’is the reference method. Observation pairs with the same value will be 100 % similar (accurate) and observation pairs where the Pima CD4 is greater than the reference will be > 100 %, and conversely <100 % if Pima CD4 has a value smaller than the reference. The amount of variability (precision) is represented by the percentage similarity SD and overall agreement by the percentage similarity CV.
The agreement between the Pima CD4 and reference technology was also measured using the percent difference (bias, SD) [25]
The percentage difference is calculated as (a-b)/b (or the average between‘a’and‘b’) × 100 % [25]. Observation pairs with the same value will have no difference and therefore low percent difference, as the percentage difference method is more relative than absolute difference over the range of data.
The strength of the agreement (accuracy and precision) was measured by the concordance correlation (Pc) between the Pima CD4 and reference technologies [17,36]
The formula applied is pc (concordance correlation) = p (Pearson correlation [measure of precision]) x Cb (bias correction factor [measure of accuracy]) [17,36]. The value of pc (strength of agreement) is suggested as: <0.9 (poor); 0.90-0.95 (moderate); 0.95–0.99 (substantial); >0.99 (almost perfect) [17,36].
(c)Subset analysis
Description of subset Methods applied
Sample size in method comparison: Few CD4 method comparison studies’sample sizes are based on statistical criteria, but rather constrained by costs. This pooled meta-analysis data set afforded the ability to investigate potential impact of sample size on statistical outcomes. An analysis was therefore performed on a subset of data from the comparison between the Pima CD4 and FACSCount of venous derived specimens, as this was the largest subset of paired observations from a single reference and Pima CD4 comparison.
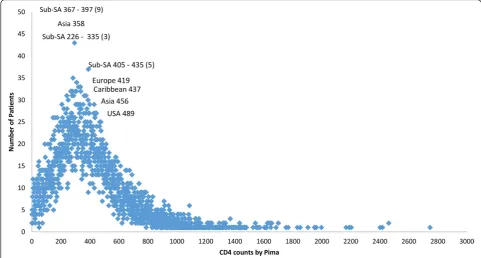
2012 with 62.7 % of the observation pairs from five stud-ies. Overall 69 % of the observations were obtained from studies conducted in sub-Saharan Africa and 47 % of ob-servations were obtained from studies performed in 2011. The distribution plot in Fig. 3 illustrates that the observation pairs have a broad range of CD4 counts from 1 cell/μl to 2,580 cells/μl as reported by the Pima CD4, with a median CD4 count of 363 cells/μl. The median CD4 count for all reference technologies was 383 cells/μl. Of the total number of observations, 65 % were tested by Pima CD4 using venous-derived blood specimens, with a median CD4 count of 373 cells/μl. The median CD4 count of the Pima CD4 using capillary-derived specimens was 342 cells/μl, and studies
performed in 2009 had a lower median CD4 count (290 cells/μl) generated from the Pima CD4 than reference technologies (352 cells/μl) or Pima CD4 median results generated in 2010 (327 cells/μl) compared to reference technologies (357 cells/μl). This may indicate changes or improvements in the Pima CD4 technology over time.
Categorical data analysis
The percentage contribution of observations in the four CD4 categories (<100 cells/μl; 100 – 350 cells/μl; 350–500 cells/μl and >500 cells/μl) as determined by the Pima CD4 and reference technologies found the Pima CD4 had more observations (48.2 %) with CD4 counts <350 cells/μl than reference technologies (44.0 %). In addition, more observations had CD4 counts <350 cells/μl from capillary derived (51 %) than venous derived (46 %) specimens. The proportion test indicated a significant difference (p < 0.001) between the Pima CD4 and reference technologies in the overall numbers of observations in all categories except the 350– 500 cells/μl category (p = 0.243). This was similarly found among capillary derived specimens. Venous derived specimens showed no significant difference in the 0– 100 cells/μl (p = 0.148) and 350–500 cells/μl (p = 1.06) category assignment by the Pima CD4 compared to refer-ence technologies.
A subset of 584 paired observations from two studies [15, 16], that tested the performance of the Pima CD4 with specimens from HIV treatment-naïve patients, was analyzed to ensure that the results found in this pooled data meta-analysis (n = 11,803) can be applied to this critical population. This would also be useful to de-termine if changes in clinical thresholds for ART eli-gibility criteria (350 cells/μl clinical change [17] to 500 cells/μl [2]) using the Pima CD4 would differ from the above analysis. The percentage difference for naïve and meta-analysis observation pairs showed little difference: <100 cells/μl (1 % versus 0.6 %); 100– 350 cells/μl (4 % versus 3.6 %); 350–500 cells/μl (−2 % versus 0 %) and >500 cells/μl (−3 % versus−4 %). The
Table 1Description of data analysis(Continued)
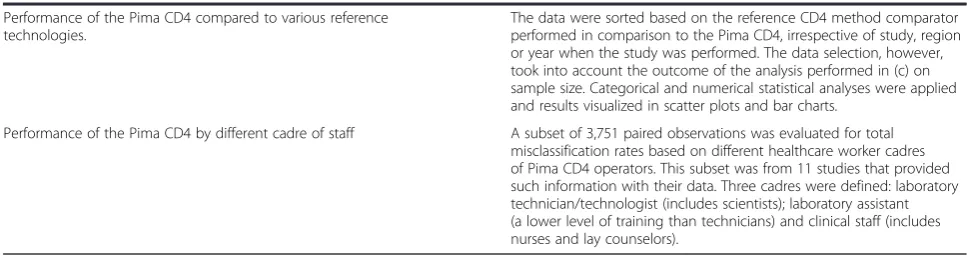
Performance of the Pima CD4 compared to various reference technologies.
The data were sorted based on the reference CD4 method comparator performed in comparison to the Pima CD4, irrespective of study, region or year when the study was performed. The data selection, however, took into account the outcome of the analysis performed in (c) on sample size. Categorical and numerical statistical analyses were applied and results visualized in scatter plots and bar charts.
Performance of the Pima CD4 by different cadre of staff A subset of 3,751 paired observations was evaluated for total misclassification rates based on different healthcare worker cadres of Pima CD4 operators. This subset was from 11 studies that provided such information with their data. Three cadres were defined: laboratory technician/technologist (includes scientists); laboratory assistant (a lower level of training than technicians) and clinical staff (includes nurses and lay counselors).
Pima CD4, therefore, performed comparably to the refer-ence CD4 technologies overall and in each CD4 category in a subset of HIV-positive treatment-naive patients.
The overall sensitivity of Pima CD4 compared to all reference technologies at all clinical thresholds analyzed was >86 %, and improves at higher CD4 cell counts with sensitivities above 93 % at the two ART initiation thresh-olds of 350 cells/μl and 500 cells/μl (Table 2). The 95 % confidence intervals for sensitivity at the 350 cells/μl and 500 cells/μl clinical thresholds overlapped between venous and capillary derived specimens, showing this
technology has similar performance on venous or capil-lary derived specimens for identifying patients below these two clinical thresholds. The overall specificity of the Pima CD4 compared to reference technology was >78 % across the three clinical thresholds measured with the lowest specificity observed at the higher CD4 count threshold of 500 cells/μl. The latter comprised 15.5 % of the total number of observations with Pima CD4 count values close to this threshold.
The overall sensitivity of the Pima CD4 at 100 cells/μl compared to reference technologies was less (86 %) than
Fig. 2Tabulation of study characteristics and observations summarized in pie charts after sorting by (a) comparator reference technologies; (b) geographic location of collected observations; (c) year in which observations reported
its performance at the ART thresholds (sensitivity >93 %). The Pima CD4 may, therefore, have less ability in identify-ing all necessary patients requiridentify-ing reflex CrAg testidentify-ing. There was also a significant difference in this sensitivity
between specimens tested from venous (88 %) compared to capillary (79 %) derived specimens, since the CIs do not overlap. Patients, however, not requiring CrAg reflex test-ing will be correctly identified by the Pima CD4 since the
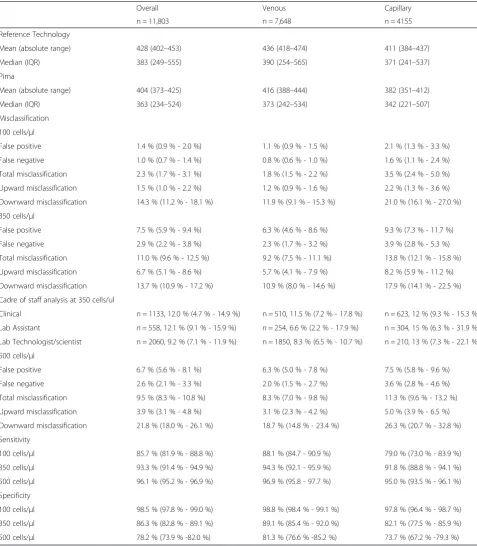
Table 2Categorical meta-analysis summary including random effects modeling
Overall Venous Capillary
n = 11,803 n = 7,648 n = 4155
Reference Technology
Mean (absolute range) 428 (402–453) 436 (418–474) 411 (384–437)
Median (IQR) 383 (249–555) 390 (254–565) 371 (241–537)
Pima
Mean (absolute range) 404 (373–425) 416 (388–444) 382 (351–412)
Median (IQR) 363 (234–524) 373 (242–534) 342 (221–507)
Misclassification
100 cells/μl
False positive 1.4 % (0.9 % - 2.0 %) 1.1 % (0.9 % - 1.5 %) 2.1 % (1.3 % - 3.3 %)
False negative 1.0 % (0.7 % - 1.4 %) 0.8 % (0.6 % - 1.0 %) 1.6 % (1.1 % - 2.4 %)
Total misclassification 2.3 % (1.7 % - 3.1 %) 1.8 % (1.5 % - 2.2 %) 3.5 % (2.4 % - 5.0 %)
Upward misclassification 1.5 % (1.0 % - 2.2 %) 1.2 % (0.9 % - 1.6 %) 2.2 % (1.3 % - 3.6 %)
Downward misclassification 14.3 % (11.2 % - 18.1 %) 11.9 % (9.1 % - 15.3 %) 21.0 % (16.1 % - 27.0 %)
350 cells/μl
False positive 7.5 % (5.9 % - 9.4 %) 6.3 % (4.6 % - 8.6 %) 9.3 % (7.3 % - 11.7 %)
False negative 2.9 % (2.2 % - 3.8 %) 2.3 % (1.7 % - 3.2 %) 3.9 % (2.8 % - 5.3 %)
Total misclassification 11.0 % (9.6 % - 12.5 %) 9.2 % (7.5 % - 11.1 %) 13.8 % (12.1 % - 15.8 %)
Upward misclassification 6.7 % (5.1 % - 8.6 %) 5.7 % (4.1 % - 7.9 %) 8.2 % (5.9 % - 11.2 %)
Downward misclassification 13.7 % (10.9 % - 17.2 %) 10.9 % (8.0 % - 14.6 %) 17.9 % (14.1 % - 22.5 %)
Cadre of staff analysis at 350 cells/ul
Clinical n = 1133, 12.0 % (4.7 % - 14.9 %) n = 510, 11.5 % (7.2 % - 17.8 %) n = 623, 12 % (9.3 % - 15.3 %)
Lab Assistant n= 558, 12.1 % (9.1 % - 15.9 %) n= 254, 6.6 % (2.2 % - 17.9 %) n = 304, 15 % (6.3 % - 31.9 %)
Lab Technologist/scientist n = 2060, 9.2 % (7.1 % - 11.9 %) n = 1850, 8.3 % (6.5 % - 10.7 %) n = 210, 13 % (7.3 % - 22.1 %)
500 cells/μl
False positive 6.7 % (5.6 % - 8.1 %) 6.3 % (5.0 % - 7.8 %) 7.5 % (5.8 % - 9.6 %)
False negative 2.6 % (2.1 % - 3.3 %) 2.0 % (1.5 % - 2.7 %) 3.6 % (2.8 % - 4.6 %)
Total misclassification 9.5 % (8.3 % - 10.8 %) 8.3 % (7.0 % - 9.8 %) 11.3 % (9.6 % - 13.2 %)
Upward misclassification 3.9 % (3.1 % - 4.8 %) 3.1 % (2.3 % - 4.2 %) 5.0 % (3.9 % - 6.5 %)
Downward misclassification 21.8 % (18.0 % - 26.1 %) 18.7 % (14.8 % - 23.4 %) 26.3 % (20.7 % - 32.8 %)
Sensitivity
100 cells/μl 85.7 % (81.9 % - 88.8 %) 88.1 % (84.7 - 90.9 %) 79.0 % (73.0 % - 83.9 %)
350 cells/μl 93.3 % (91.4 % - 94.9 %) 94.3 % (92.1 - 95.9 %) 91.8 % (88.8 % - 94.1 %)
500 cells/μl 96.1 % (95.2 % - 96.9 %) 96.9 % (95.8 - 97.7 %) 95.0 % (93.5 % - 96.1 %)
Specificity
100 cells/μl 98.5 % (97.8 % - 99.0 %) 98.8 % (98.4 % - 99.1 %) 97.8 % (96.4 % - 98.7 %)
350 cells/μl 86.3 % (82.8 % - 89.1 %) 89.1 % (85.4 % - 92.0 %) 82.1 % (77.5 % - 85.9 %)
500 cells/μl 78.2 % (73.9 % -82.0 %) 81.3 % (76.6 % -85.2 %) 73.7 % (67.2 % -79.3 %)
Confidence intervals quoted are at 95 %
specificity of the Pima CD4 compared to reference tech-nologies is high (98.5 %), and there was no significant dif-ference between type of specimen (venous or capillary).
The impact of the sensitivity and specificity of the Pima CD4 used at the three clinical thresholds was fur-ther investigated through the extent of total numbers of patients who would be misclassified (false positive + false negative rates). The total misclassification rate of Pima CD4 was 2.3 %, 11.0 %, and 9.5 % at the 100 cells/μl, 350 cells/μl and 500 cells/μl thresholds, respectively (Table 2). In addition, the false positivity rates were higher across all clinical thresholds indicating that more patients are found eligible for treatment using the Pima CD4 than reference CD4 technology. This relationship was the same irrespective of specimen type; however, there was greater total misclassification with capillary derived blood specimen testing (3.5 % ≤100 cells/μl; 13.8 %≤350 cells/μl and 11.3 % ≤500 cells/μl) compared to venous derived specimen testing (1.8 %≤100 cells/μl; 9.2 %≤350 cells/μl and 8.3 %≤500 cells/μl).
This is similarly reflected in the downward misclassifi-cation rates, where 14 % of patients would be identified by the Pima CD4 as incorrectly requiring treatment at the ART eligibility threshold of 350 cells/μl and up to 22 % at the ART eligibility threshold 500 cells/μl com-pared to reference CD4 technology. The upward mis-classification of Pima CD4 at the two ART initiation clinical thresholds was less: 7 % (at 350 cells/μl) and 4 % (at 500 cells/μl). Both upward and downward mis-classification rates were higher among capillary derived specimens.
A subset of the data (n = 3,751 paired observations) was further analyzed to investigate any differences in the Pima CD4’s performance based on cadre of operator. Seventy percent (n= 558 laboratory assistant; n = 2,060 laboratory technician/scientist) of the tests were con-ducted by laboratory technicians and 30 % (n = 1,133) by clinical staff. Table 2 highlights that the total misclassifi-cation rate at 350 cells/μl was below 13 % for laboratory assistants, laboratory technicians and clinical staff. La-boratory assistants performing the Pima CD4 using venous-derived specimens had the lowest total misclassi-fication rate (7 %), yet they also had the highest mis-classification rate of 15 % performing the Pima CD4 on capillary derived specimens. Clinical staff had similar misclassification rates (12 %) using either venous or ca-pillary derived specimens. All analyses however showed misclassification rates with overlapping CI’s indicating that technical performance of the Pima CD4 does not alter when used by different cadre of operators.
Numerical data analysis
The overall mean bias (difference) of the Pima CD4 was
−23 cells/μl compared to all reference technologies
(Table 3) with overlapping 95 % CI between venous and capillary derived specimen testing. The standard devi-ation of the overall bias (indicator of precision or vari-ability of the mean difference) was +/−100 cells/μl for this set of observation pairs with a median CD4 count of 383 cells/μl. The overall mean percentage similarity shows that the Pima CD4 had good accuracy (101 %) compared with the reference technologies but more variability (116 % SD) among capillary than venous (67 % SD) derived specimens. The strength of this agreement (concordance correlation) between the Pima CD4 and reference technologies is also shown to be moderate (Pc = 0.934) for venous derived specimens and poor (Pc = 0.874) for capillary derived specimens, with CI’s that do not overlap.
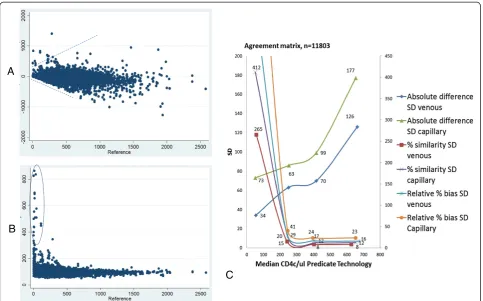
The Bland-Altman, percentage similarity and relative percent bias methods of measuring absolute cell agree-ment are influenced by certain CD4 count ranges: Bland-Altman by higher CD4 counts and the percentage similarity and relative percent bias by lower CD4 counts. This is visualized in Fig. 4 in the scatter plots by the fun-nel shape of the Bland-Altman and the outliers in the percentage similarity plots. The line plot in Fig. 4 there-fore combines all three agreement measurements by representing their SD (amount of variability) in the four CD4 cell range categories based on reference CD4 tech-nology values. Using the absolute cell difference SD for the <100 cells/μl category and the percent similarity SD and/or the relative percent bias SD for the >100 cells/μl categories shows that the Pima CD4 has good overall agreement with reference CD4 technologies from venous derived specimens, and more variability among capillary derived specimens. The latter is more visible among the absolute difference line plot. Table 3 summarizes this overall agreement (accuracy and precision) from the combined agreement measure methods at the three clinical thresholds. Among venous derived specimens, the cell variance ranges from 34 to 53 cells/μl and among capillary derived specimens it ranges from 51 to 79 cells/μl. Capillary derived specimen testing however has twice as much cell variance (73 cells/μl) than ven-ous derived specimens (34 cells/μl) at the 100 cells/μl clinical threshold, which is also reflected by the signifi-cantly reduced sensitivity, 88.1 % (CI 84.7; 90.9 %) vs 79 % (CI 73.0 %; 83.9 %) (Table 2) as previously men-tioned. The overall average percent bias of the Pima CD4 compared to reference technologies is 10 % for venous derived specimens and 15 % for capillary de-rived specimens.
Performance of the Pima CD4 compared to various reference technologies
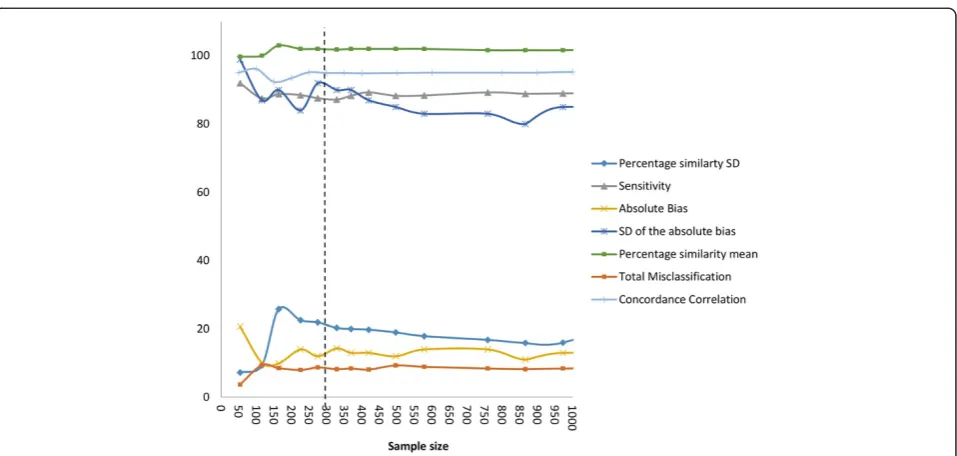
compared to six reference CD4 technologies contribut-ing from 1.7 % to 41 % of the data. An impact of sample size on method comparison was therefore investigated in a subset analysis using the Pima CD4 versus FACSCount observation pairs. Figure 5 illustrates the changes in mis-classification (at the 350 cells/μl threshold), sensitivity (at the 350 cells/μl threshold), measures and strengths of agreement with increasing sample size using the actual clinical data but randomly selecting different sample sizes to include in the analyses. The strength of this agreement (concordance correlation, Pc) remained the most constant in value at a minimum sample size of 226. Misclassification, percentage similarity SD and SD of the absolute bias remained constant at a minimum sample size of 329. The percentage similarity mean remained at a constant minimum sample size of 226, and the absolute bias at a minimum sample size of 370. The sensitivity remained constant at the lowest sample size of 164. Beyond these sample sizes there is little change in the method comparison parameters and therefore interpretation of outcomes. Taking these
considerations of variability in method comparison pa-rameters into account, the range in optimal sample size is between 164 and 370, with the average of 280. Samples sizes <200 show the least consistency among the method comparison parameters.
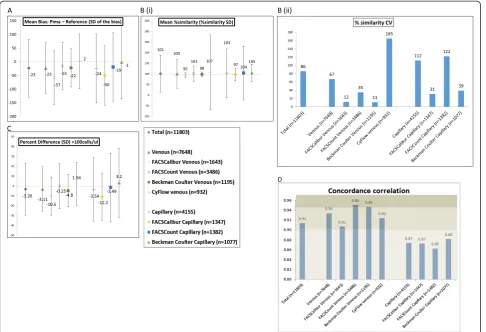
Based on this sample size analysis, reference CD4 tech-nologies versus Pima CD4 comparisons (numeric evalu-ation across all CD4 count ranges) that contributed >370 (maximum) paired observations (from pooled or indi-vidual studies) were evaluated to investigate differences in the Pima CD4 compared to the various reference CD4 technologies. The comparisons with the required sample size were: FACSCount (venous n = 3,486, capil-lary n = 1,382), Beckman Coulter (venous n = 1,195, capillary n = 1,077), FACSCalibur (venous n = 1,643, ca-pillary n = 1,347) and CyFlow (venous n = 932, caca-pillary n = 0). Figure 6 visually represents the method compari-son parameters for these evaluations in bias scatter plots (including SD error bars) and bar charts. The mean absolute bias plot (A) indicates the absolute cell bias of the Pima CD4 compared to reference CD4
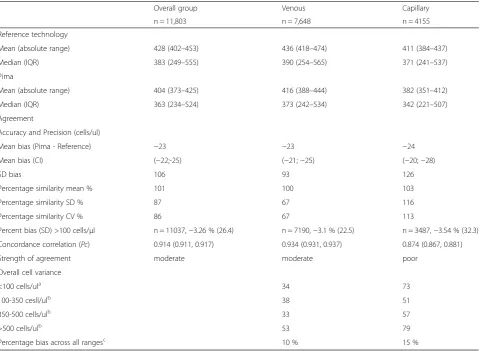
Table 3Method comparison meta-analysis summary using numerical data
Overall group Venous Capillary
n = 11,803 n = 7,648 n = 4155
Reference technology
Mean (absolute range) 428 (402–453) 436 (418–474) 411 (384–437)
Median (IQR) 383 (249–555) 390 (254–565) 371 (241–537)
Pima
Mean (absolute range) 404 (373–425) 416 (388–444) 382 (351–412)
Median (IQR) 363 (234–524) 373 (242–534) 342 (221–507)
Agreement
Accuracy and Precision (cells/ul)
Mean bias (Pima - Reference) −23 −23 −24
Mean bias (CI) (−22;-25) (−21;−25) (−20;−28)
SD bias 106 93 126
Percentage similarity mean % 101 100 103
Percentage similarity SD % 87 67 116
Percentage similarity CV % 86 67 113
Percent bias (SD) >100 cells/μl n = 11037,−3.26 % (26.4) n = 7190,−3.1 % (22.5) n = 3487,−3.54 % (32.3)
Concordance correlation (Pc) 0.914 (0.911, 0.917) 0.934 (0.931, 0.937) 0.874 (0.867, 0.881)
Strength of agreement moderate moderate poor
Overall cell variance
<100 cells/ula 34 73
100-350 cesll/ulb 38 51
350-500 cells/ulb 33 57
>500 cells/ulb 53 79
Percentage bias across all rangesc 10 % 15 %
Calculated froma
bias SD;b
percentage similarity SD;c
the average percentage similarity >200cells/ul
technologies, ranging from 1 to 57 cells/μl difference. The Pima CD4 has a negative bias (generates lower values) against the FACSCount, FACSCalibur and Beckman Coulter reference CD4 technologies, but gener-ates higher values (positive bias) against the CyFlow. In addition, the Pima CD4 has the lowest variability (SD of the bias) against the Beckman Coulter (SD = 70 cells/μl) reference technology, but this only applies to those specimens tested by venous collection, since capillary tested specimens in contrast generated the greatest variability (SD = 134 cells/μl). The mean percentage similarity plot (B) shows that the Pima CD4 is most similar (least variable) to the FACSCalibur (%SD = 11 % venous derived specimens; 30 % capillary derived speci-mens), the Beckman Coulter (%SD = 11 % venous de-rived specimens; 41 % capillary dede-rived specimens) and the FACSCount (%SD = 36 % venous derived specimens)
reference CD4 technologies. In addition the Pima CD4 is least similar (most variable) compared to the CyFlow (%SD = 177 % venous derived specimens) followed by the FACSCount (%SD = 127 % capillary derived specimens). The latter is similarly indicated by the high percent-age similarity CV values of the Pima CD4 compared to the CyFlow (165 % on venous specimens) and FACSCount (122 % on capillary specimens) as shown in the bar chart (B). These relationships are mirrored in the relative percent bias (difference) plot (C), which represents only the CD4 count range of reference CD4 technology >100 cells/μl, with the least difference (and lowest variability) between the Pima CD4 and the Beckman Coulter (−4.8 %, SD = 16.5 %) and between the Pima CD4 and the FACSCalibur (−10.5 %, SD = 19.5 %) on venous derived specimens. The largest percent differ-ence and variability is between the Pima CD4 and
A
B
C
CyFlow (1.94 %, SD = 21.9 %) on venous specimens but even greater percent bias between the Pima CD4 and all capillary derived specimen testing, especially the FACSCount (−1.49 %, SD = 34.8 %) and Beckman Coulter (3.2 %, SD = 35 %). The bar chart in Fig. 6 (d) fur-ther illustrates the strength of these agreements between the Pima CD4 and reference CD4 technologies, and shows that the Pima CD4 has substantial agreement (Pc >0.95) with the FACSCount (on venous specimens) and Beckman Coulter (on venous specimens), and moderate agreement (Pc >0.9) with FACSCalibur (venous specimens) and CyFlow (venous specimens) reference technologies. How-ever, the Pima CD4 has poor agreement (Pc <0.9) with all reference technologies when capillary specimens were tested.
Discussion
This pooled data meta-analysis not only comprises the largest single data set to date published on the perform-ance of a single CD4 enumeration technology, but also comprises observation pairs that are representative of CD4 counts across different geographic regions, obser-vations collected over a fairly short time period (three years) and predominantly (69 %) from high HIV preva-lence settings with 55 % from resource-limited settings. There is good representation of six reference comparator technologies that is seldom possible in a single evalu-ation study. In addition sub-analyses were possible
comparing the performance of the Pima CD4 on venous and capillary derived specimens, different cadres of staff and sub-population of HIV ART-naïve patients. The me-dian CD4 (383 cells/μl) from the reference CD4 technol-ogy also shows that conclusions drawn from this study can be well applied to the important 350 cells/μl clinical threshold for ART initiation and categorizing this large sample size (11,803) allows for conclusions also to be ex-trapolated to the 100 cells/μl and 500 cells/μl clinical thresholds. This meta-analysis, therefore, provides a unique opportunity to evaluate the Pima CD4’s technical performance independent of influence from patient age, immunological status, gender, pregnancy, geographic lo-cation, HIV status, HIV subtype (by geographic location), instrument, reagent lot, assay version, operator training and sample size that may otherwise influence a smaller study’s analyses.
Overall, the Pima CD4 generates lower CD4 count values than reference technologies with the effect that more patients’CD4 counts are categorized <350 cells/μl by the Pima CD4, and this is more marked among capil-lary than venous tested specimens. In absolute cell num-bers this equates to an average bias between the Pima CD4 and reference technologies of −23 cells/μl with variability in the bias (SD) across the range in CD4 counts (1-2,800 cells/μl) increasing to SD = 93 cells/μl difference (23 % relative bias and 67 % similarity CV) for venous derived specimens and up to SD = 126 cells/μl
difference (32 % relative bias and 113 % similarity CV) for capillary derived specimens. The overall bias across all CD4 ranges may be summarized as 10 % for venous derived and 15 % for capillary derived specimens.
Some variability was noted among the reference tech-nologies (as has been noted by others [18]), with the outlier (higher variability, least similarity) being the Pima CD4 compared to the CyFlow. When the Pima CD4 was compared to the CyFlow reference technology only, this generated a positive bias and the most variability. This may be due to both technologies being based on volumetric testing and using testing volumes <50 μl. The Pima CD4 compared to the Beckman Coulter Pan-Leucogated reference CD4 technology yielded the least variability, but only among venous tested specimens. This may be due to the Beckman Coulter technology being based on counting total white cells to generate a CD4 count and therefore differences between fresh
capillary tested Pima CD4 specimens versus >1 hour old anti-coagulated Pima CD4 and Beckman coulter tested specimens [19]. The Pima CD4 also compared well to the FACSCalibur and FACSCount technologies, but for the FACSCount this was found only for venous derived specimens. The FACSCalibur testing requires a highly skilled operator’s input for manual gating, inter-pretation and complex software compared to the FACSCount and Pima CD4 which are closed with no operator input to refine the software selection of the CD4 positive cell cluster. The heterogeneity among the reference technologies illustrates the importance of selecting the most appropriate reference technology comparator for such technical evaluations of new tech-nologies. Furthermore, it is critical that the reference technologies meet all quality requirements including participation in external proficiency testing before commencing evaluations.
Improvement in misclassification of the Pima CD4 over time was also noted, and may be due to changes in software, hardware, changes in the type and use of lancets as well as training of operators during tation. Operator training is key to successful implemen-tation of new technologies. This should be considered for future evaluations of early versions of new platforms that may not be fully optimized, to ensure that promis-ing products are not unduly excluded from consider-ation for implementconsider-ation. It is also important for national HIV treatment programs wishing to implement the Pima CD4 (or fast followers) to be aware of allow-able differences in bias, resulting in misclassification rates and reduced sensitivity compared to the reference CD4 (or current “in-country”) technology, that may im-pact treatment costs and weigh the performance and costs with the increased patient access such a technology will allow.
The impact of these differences between the Pima CD4 and reference CD4 technologies was investigated through misclassification and overall sensitivity at three clinical thresholds, summarized in Table 4. Overall, the misclassification by the Pima CD4 compared to refer-ence technology is predominantly due to higher false positive than false negative rates and therefore more pa-tients identified for treatment using the Pima CD4. This results in greater downward misclassification at all thresholds, and is also reflective in the overall specificity of the Pima CD4 of 86 % (CI 82.8 % - 89.1 %) at the 350 cells/μl ART threshold and 78.2 % (CI 73.9 % -82.0 %) at the 500 cells/μl ART threshold with no significant differ-ence between venous and capillary tested specimens. The sensitivity, however, of the Pima CD4 at the 100 cells/μl is 86 % (CI 82 % - 89 %), with a significant differ-ence between venous and capillary derived specimens.
Programmatic implications are important to consider when implementing a new testing technology, and these increased false positive and downward misclassification rates mean that more patients will be identified as eli-gible for treatment. While this will lead to initial in-creases in overall program costs, treatment is initiated sooner with greater impact on patients’ life years saved [3, 10, 20–22]. It is worth stressing that these implica-tions apply across the different thresholds irrespective of the changes in treatment guideline to the 500 cells/μl threshold, and additional studies can now be undertaken to determine the impact Pima CD4 could have on out-comes and costs.
Not only does this analysis highlight some difference in reference technologies, but also in some method com-parison parameters. Testing a CD4 blood specimen on the same or on a different platform or test will yield a different CD4 count due to variability in accuracy and precision of both the platforms and tests. Where this variability in the CD4 count becomes important is whether or not the variability becomes clinically relevant and patient management is altered. It is this variability that is investigated in method comparisons and we are beyond the inappropriate use of correlation and linear regression for performing such analyses with CD4 counts [23, 24] but also realize a newer approach using concordance correlation has value in scaling the strength of agreement between two technologies. Appropriate methods reported in the literature for the analysis of continuous values of CD4 counts are the difference [23], the percentage difference [25], the percentage similarity [24] and the ratio [26]. The latter three transform the observation pairs into values that can be compared between studies (even where different samples were tested). Specific parameters from these methods are also
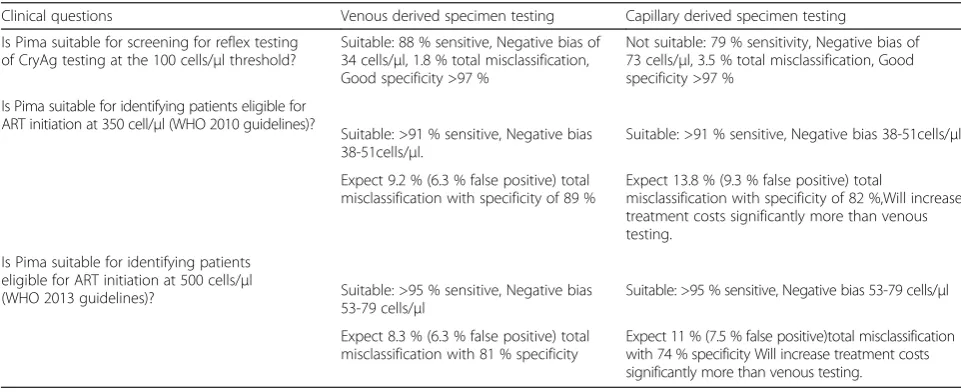
Table 4Clinical relevance of meta-analysis findings, for venous and capillary derived specimen testing by the Pima CD4
Clinical questions Venous derived specimen testing Capillary derived specimen testing
Is Pima suitable for screening for reflex testing of CryAg testing at the 100 cells/μl threshold?
Suitable: 88 % sensitive, Negative bias of 34 cells/μl, 1.8 % total misclassification, Good specificity >97 %
Not suitable: 79 % sensitivity, Negative bias of 73 cells/μl, 3.5 % total misclassification, Good specificity >97 %
Is Pima suitable for identifying patients eligible for ART initiation at 350 cell/μl (WHO 2010 guidelines)?
Suitable: >91 % sensitive, Negative bias 38-51cells/μl.
Suitable: >91 % sensitive, Negative bias 38-51cells/μl.
Expect 9.2 % (6.3 % false positive) total misclassification with specificity of 89 %
Expect 13.8 % (9.3 % false positive) total
misclassification with specificity of 82 %,Will increase treatment costs significantly more than venous testing.
Is Pima suitable for identifying patients eligible for ART initiation at 500 cells/μl
(WHO 2013 guidelines)? Suitable: >95 % sensitive, Negative bias 53-79 cells/μl
Suitable: >95 % sensitive, Negative bias 53-79 cells/μl
Expect 8.3 % (6.3 % false positive) total misclassification with 81 % specificity
more informative than others for interpreting acceptable versus non-acceptable performance limits, for example, the mean bias interpreted with the confidence interval for accuracy and standard deviation of the bias for preci-sion, and both accuracy and precision interpreted in the context of the median CD4 count of the observation set. This pooled data meta-analysis also highlighted the flaws associated with using stand-alone method comparison parameters. The Bland-Altman mean bias is not relative over the range of CD4 counts, especially >100 cells/μl and the percentage similarity and relative percentage mean bias is influenced by outliers (non-clinical) in the <200 cells/μl range. The combination of these method comparison parameters provides a more optimal evalu-ation across the range of CD4 counts. Analyses such as sensitivity, specificity and misclassification are not typ-ical of CD4 techntyp-ical evaluations, but in the context of CD4 being used for treatment initiation or screening for reflex testing have proved informative.
The sub-study analyses showed no difference in the Pima CD4 performance in a subset of HIV-positive ART-naïve individuals versus the meta-analysis findings. This was also true for the Pima CD4 testing performed by different cadres of operators. In addition to these findings, the subset analysis of the impact of sample size on method comparison parameters determined an average optimal sample size of 280 paired observations (n = 164 for sensitivity and n = 370 for bias calculation) for analyzing CD4 enumeration technologies. This there-fore may be a guide to inform future evaluation studies for minimum sample size requirements for different methods of comparison.
While designing and conducting technical evaluations takes time and significant resources, it is critical to en-sure that a technology performs comparably to reference standards. This pooled data meta-analysis implies that immunological population differences do not signifi-cantly affect the performance of CD4 diagnostic tests, especially in countries within the same geographic re-gion. Performing a technical evaluation in every country considering a new product would, therefore, lead to sig-nificant delays in product approval, implementation in health care facilities, and improving the lives of patients. Thus, a harmonized approach could be attained with one large evaluation across sites and pooled data.
Conclusion
This meta-analysis focused on a method comparison using CD4 observation pairs, and no qualitative analysis of the Pima CD4 technology itself was investigated. Im-plementation of POC CD4 technologies will require strengthening of decentralized health care networks, in-cluding supply chain, quality assessment and program monitoring. POC CD4 technologies, however, will help
achieve the bold goals set out by WHO, UNAIDS, and other global stakeholders of initiating significantly more patients on ART and improving patient access to quality care. In conclusion, this meta-analysis demonstrated that the Pima CD4 platform can generate accurate CD4 counts to be used for ART initiation in both laboratory and non-laboratory settings used by either skilled or non-skilled operators.
Competing interests
The authors declare that they have no competing interests.
Authors’contributions
LES and JC designed all statistical analyses; LES and LV prepared all drafts of the manuscript; LW, LK, LK provided additional statistical input; JN and WS provided critical modifications to the manuscript and interpretations; TP and WS sourced data through collaborations and obtained the necessary permissions. All authors read and approved the final manuscript.
Acknowledgments
We thank Willy Urassa from the World Health Organisation, Geneva, Switzerland and Braimoh Bello (consultant statistician residing at Centre for Statistical Analysis and Research in South Africa), and Marta Prescott and Jessica Joseph (from the Clinton Health Access Initiative) for added discussions and statistical input. The findings and conclusions in this report are those of the authors and do not necessarily represent the views of the U.S. Centers for Disease Control and Prevention. This research has been supported by the President’s Emergency Plan for AIDS Relief (PEPFAR) through the Centers for Disease Control and Prevention. Use of trade names is for identification purposes only and does not constitute endorsement by the U.S. Centers for Disease Control. Grand Challenges Canada (grant 0007-02-01-01-01 [to W.S.]) provided support for WS and LES. All authors were involved in communications with the consortium members.
Funding
This meta-analysis was initiated and led by LS and WS as a need realized during their“Multiple Point of care for HIV ART initiation feasibility”project funded by Grand Challenges Canada (grant: 0007-02-01-01-01).
Author details
1Department of Molecular Medicine and Haematology, Faculty of Health
Science, School of Pathology, University of the Witwatersrand, 7 York Road Parktown, Johannesburg, South Africa.2Clinton Health Access Initiative,
Boston, MA, USA.3US Centers for Disease Control, Atlanta, GA, USA.
4Department of Biomedical Sciences, University of Antwerp, Antwerp,
Belgium.5Laboratory of Immunology, Department of Biomedical Sciences, Institute of Tropical Medicine, Antwerp, Belgium.6National Health Laboratory
Service, Johannesburg, South Africa.
Received: 10 March 2015 Accepted: 11 June 2015
References
1. UN AIDS. The Gap Report 2014. 2014. http://www.unaids.org/en/resources/ campaigns/2014/2014gapreport/gapreport. Accessed November 2014. 2. World Health Organisation. Consolidated guidelines on the use of
antiretroviral drugs for treating and preventing HIV infection 2013. 2013. http://www.who.int/hiv/pub/guidelines/arv2013/en/.
3. Larson BA, Brennan A, McNamara L, Long L, Rosen S, Sanne I, et al. Lost opportunities to complete CD4+ lymphocyte testing among patients who tested positive for HIV in South Africa. Bull World Health Organ. 2010;88:675–80. 4. Rosen S, Fox MP. Retention in HIV care between testing and treatment in
sub-Saharan Africa: a systematic review. PLoS Med. 2011;8:e1001056. 5. Faal M, Naidoo N, Glencross DK, Venter WD, Osih R. Providing immediate
CD4 count results at HIV testing improves ART initiation. J Acquir Immune Defic Syndr. 2011;58:e54–9.
6. Stevens WS, Ford N. Time to reduce CD4+ monitoring for the management of antiretroviral therapy in HIV-infected individuals. S Afr Med J.
2014;104:559–60.
7. UNITAID. HIV/AIDS diagnostics technology landscape. 4th ed. 2014. http://www.unitaid.eu/images/marketdynamics/publications/UNITAID-HIV_Diagnostic_Landscape-4th_edition.pdf.
8. World Health Organisation. Antiretroviral therapy for HIV infection in adults and adolescents. Recommendations for a public health approach: 2010 revision. 2010. http://www.who.int/hiv/pub/arv/adult2010/en/. 9. World Health Organisation. HIV Programme: Achieving our Goals 2014.
http://apps.who.int/iris/bitstream/10665/112666/1/9789241507110_eng.pdf. UNAIDS. Treatment 2015, http://www.unaids.org/sites/default/files/ media_asset/JC2484_treatment-2015_en_1.pdf
10. Jani IV, Sitoe NE, Alfai ER, Chongo PL, Quevedo JI, Rocha BM, et al. Effect of point-of-care CD4 cell count tests on retention of patients and rates of antiretroviral therapy initiation in primary health clinics: an observational cohort study. Lancet. 2011;378:1572–9.
11. Jani IV, Peter TF. How point-of-care testing could drive innovation in global health. N Engl J Med. 2013;368:2319–24.
12. Stevens W, Gelman R, Glencross DK, Scott LE, Crowe SM, Spira T. Evaluating new CD4 enumeration technologies for resource-constrained countries. Nat Rev Microbiol. 2008;6:S29–38.
13. Moher D, Liberati A, Tetzlaff J, Altman DG, Group P. Preferred reporting items for systematic reviews and meta-analyses: the PRISMA statement. PLoS Med. 2009;6:e1000097.
14. Bossuyt PM, Reitsma JB, Bruns DE, Gatsonis CA, Glasziou PP, Irwig LM, et al. Towards complete and accurate reporting of studies of diagnostic accuracy: the STARD initiative. BMJ. 2003;326:41–4.
15. Mtapuri-Zinyowera S, Chideme M, Mangwanya D, Mugurungi O, Gudukeya S, Hatzold K, et al. Evaluation of the PIMA point-of-care CD4 analyzer in VCT clinics in Zimbabwe. J Acquir Immune Defic Syndr. 2010;55:1–7.
16. Mnyani CN, McIntyre JA, Myer L. The reliability of point-of-care CD4 testing in identifying HIV-infected pregnant women eligible for antiretroviral therapy. J Acquir Immune Defic Syndr. 2012;60:260–4.
17. McBride GB. A proposal for strength of agreement criteria for Lin’s Concordance correlation coefficient. Hamilton, New Zealand: NIWA client report HAM2005-062 Report for Ministry of Health; 2005.
18. Mwau M, Adungo F, Kadima S, Njagi E, Kirwaye C, Abubakr NS, et al. Evaluation of PIMA(R) point of care technology for CD4 T cell enumeration in Kenya. PLoS One. 2013;8:e67612.
19. Glencross D, Scott LE, Jani IV, Barnett D, Janossy G. CD45-assisted PanLeucogating for accurate, cost-effective dual-platform CD4+ T-cell enumeration. Cytometry. 2002;50:69–77.
20. Wynberg E, Cooke G, Shroufi A, Reid SD, Ford N. Impact of point-of-care CD4 testing on linkage to HIV care: a systematic review. J Int AIDS Soc. 2014;17:18809.
21. Hyle EP, Jani IV, Lehe J, Su AE, Wood R, Quevedo J, et al. The clinical and economic impact of point-of-care CD4 testing in Mozambique and other resource-limited settings: a cost-effectiveness analysis. PLoS Med. 2014;11:e1001725.
22. Larson B, Schnippel K, Ndibongo B, Long L, Fox MP, Rosen S. How to estimate the cost of point-of-care CD4 testing in program settings: an example using the Alere Pima Analyzer in South Africa. PLoS One. 2012;7:e35444.
23. Bland JM, Altman DG. Statistical methods for assessing agreement between two methods of clinical measurement. Lancet. 1986;1:307–10.
24. Scott LE, Galpin JS, Glencross DK. Multiple method comparison: statistical model using percentage similarity. Cytometry B Clin Cytom. 2003;54:46–53. 25. Pollock MA, Jefferson SG, Kane JW, Lomax K, MacKinnon G, Winnard CB.
Method comparison–a different approach. Ann Clin Biochem. 1992;29:556–60. 26. Denny TN, Gelman R, Bergeron M, Landay A, Lam L, Louzao R, et al. A North
American multilaboratory study of CD4 counts using flow cytometric panLeukogating (PLG): a NIAID-DAIDS Immunology Quality Assessment Program Study. Cytometry B Clin Cytom. 2008;74:S52–64.
27. Sukapirom K, Onlamoon N, Thepthai C, Polsrila K, Tassaneetrithep B, Pattanapanyasat K. Performance evaluation of the Alere PIMA CD4 test for monitoring HIV-infected individuals in resource-constrained settings. J Acquir Immune Defic Syndr. 2011;58:141–7.
28. Jani IV, Sitoe NE, Chongo PL, Alfai ER, Quevedo JI, Tobaiwa O, et al. Accurate CD4 T-cell enumeration and antiretroviral drug toxicity monitoring in primary healthcare clinics using point-of-care testing. AIDS. 2011;25:807–12. 29. Manabe YC, Wang Y, Elbireer A, Auerbach B, Castelnuovo B. Evaluation of
portable point-of-care CD4 counter with high sensitivity for detecting patients eligible for antiretroviral therapy. PLoS One. 2012;7:e34319. 30. Diaw PA, Daneau G, Coly AA, Ndiaye BP, Wade D, Camara M, et al. Multisite
evaluation of a point-of-care instrument for CD4(+) T-cell enumeration using venous and finger-prick blood: the PIMA CD4. J Acquir Immune Defic Syndr. 2011;58:e103–11.
31. Glencross DK, Coetzee LM, Faal M, Masango M, Stevens WS, Venter WF, et al. Performance evaluation of the Pima point-of-care CD4 analyser using capillary blood sampling in field tests in South Africa. J Int AIDS Soc. 2012;15:3.
32. Gous N, Scott L, Potgieter J, Ntabeni L, Enslin S, Newman R, et al. Feasibility of performing multiple point of care testing for HIV anti-retroviral treatment initiation and monitoring from multiple or single fingersticks. PLoS One. 2013;8:e85265.
33. Myer L, Daskilewicz K, McIntyre J, Bekker LG. Comparison of point-of-care versus laboratory-based CD4 cell enumeration in HIV-positive pregnant women. J Int AIDS Soc. 2013;16:18649.
34. Wade D, Daneau G, Aboud S, Vercauteren GH, Urassa WS, Kestens L. WHO multicenter evaluation of FACSCount CD4 and Pima CD4 T-cell count systems: instrument performance and misclassification of HIV-infected patients. J Acquir Immune Defic Syndr. 2014;66:e98–107.
35. Takkouche B, Cadarso-Suarez C, Spiegelman D. Evaluation of old and new tests of heterogeneity in epidemiologic meta-analysis. Am J Epidemiol. 1999;150:206–15.