VOLUME 37, ARTICLE 22, PAGES 709
,
726
PUBLISHED 19 SEPTEMBER 2017
http://www.demographic-research.org/Volumes/Vol37/22/ DOI: 10.4054/DemRes.2017.37.22
Descriptive Finding
Parental nonstandard work schedules during
infancy and children’s BMI trajectories
Afshin Zilanawala
Jessica Abell
Steven Bell
Elizabeth Webb
Rebecca Lacey
© 2017 Afshin Zilanawala et al.
This open-access work is published under the terms of the Creative Commons Attribution NonCommercial License 2.0 Germany, which permits use, reproduction, and distribution in any medium for noncommercial purposes, provided the original author(s) and source are given credit.
1 Introduction 710
2 Data 712
2.1 BMI 713
2.2 Parental nonstandard employment 713
2.3 Time-invariant covariates 714
3 Statistical analysis 714
4 Results 715
5 Discussion 719
References 722
Parental nonstandard work schedules during infancy
and children’s BMI trajectories
Afshin Zilanawala1
Jessica Abell2
Steven Bell3
Elizabeth Webb4
Rebecca Lacey5
Abstract
BACKGROUND
Empirical evidence has demonstrated adverse associations between parental nonstandard work schedules (i.e., evenings, nights, or weekends) and child developmental outcomes. However, there are mixed findings concerning the relationship between parental nonstandard employment and children’s body mass index (BMI), and few studies have incorporated information on paternal work schedules.
OBJECTIVE
This paper investigated BMI trajectories from early to middle childhood (ages 3–11) by parental work schedules at 9 months of age, using nationally representative cohort data from the United Kingdom. This study is the first to examine the link between nonstandard work schedules and children’s BMI in the United Kingdom.
METHODS
We used data from the Millennium Cohort Study (2001‒2013,n= 13,021) to estimate trajectories in BMI, using data from ages 3, 5, 7, and 11 years. Joint parental work schedules and a range of biological, socioeconomic, and psychosocial covariates were assessed in the initial interviews at 9 months.
1 University College London (UCL), UK. E-Mail:[email protected]. 2 Institut national de la santé et de la recherche médicale (Inserm), France. 3 University of Cambridge, UK.
RESULTS
Compared to children in two-parent families where parents worked standard shifts, we found steeper BMI growth trajectories for children in two-parent families where both parents worked nonstandard shifts and children in single-parent families whose mothers worked a standard shift. Fathers’ shift work, compared to standard shifts, was independently associated with significant increases in BMI.
CONCLUSIONS
Future public health initiatives focused on reducing the risk of rapid BMI gain in childhood can potentially consider the disruptions to family processes resulting from working nonstandard hours.
CONTRIBUTION
Children in families in which both parents work nonstandard schedules had steeper BMI growth trajectories across the first decade of life. Fathers’ nonstandard shifts were independently associated with increases in BMI.
1. Introduction
The prevalence of overweight and obesity in school-age children has increased dramatically in the United Kingdom in the last two decades and is estimated to affect nearly one-third of children (van Jaarsveld and Gulliford 2015). High body mass index (BMI) in early childhood has implications for concurrent and future physical and psychological health (Daniels 2009), and overweight children are more likely to be obese as adults and develop obesity-related illnesses (Nader et al. 2006).
correlated to optimal child health and development (Li et al. 2014). For example, nonstandard work during early childhood may increase parents’ stress and fatigue (Li et al. 2014). Mental health, fatigue, and stress may impinge on healthy eating behaviors and activities (e.g., physical exercise and healthy dietary choices) that children subsequently adopt (Morrissey, Dunifon, and Kalil 2011). Compromised socioemotional resources may make it difficult to establish an organized and supportive home environment (Heymann and Earle 2001), which in turn could have implications for children’s BMI (Asarnow, McGlinchey, and Harvey 2015; Snell, Adam, and Duncan 2007).
Nonstandard schedules may have a positive, negative, or neutral association with children’s BMI. A nonstandard schedule may be preferred by parents who try to avoid nonparental childcare and choose to be available to their children during the day (Presser 1989). In two-parent families, where one or both parents work nonstandard hours, parents may have more equitable parental care of children and choose to engage in “tag-team” parenting (Presser 2003). Additionally, parents may work nonstandard hours because an employer offers higher wages. However, census data suggests nonstandard workers have little decision latitude over these work arrangements and are in such work arrangements due to constraints rather than personal preferences (McMenamin 2007). Alternatively, nonstandard shifts may impinge on family routines that are important for children’s weight. For example, parents who work nonstandard hours may not be available during key times, such as weekends, late afternoons, dinner time, or bedtimes/waking times, during which family meals, organized physical activity, and bedtime routines may occur. Parents’ fatigue, stress, and depression may be important channels through which nonstandard shifts are related to children’s BMI (Morrissey, Dunifon, and Kalil 2011). Parents who are sleep-deprived or stressed may be less likely to plan mealtimes and more likely to rely on fast or prepared food (Devine et al. 2006; Jabs et al. 2007), which could unfavorably influence children’s BMI (Anderson, Butcher, and Levine 2003).
study of Australian children found no increased risk for overweight or obesity for any combination of parental work schedules (Champion et al. 2012). However, a recent longitudinal examination of US children found a higher risk of overweight or obesity for children whose mothers worked nonstandard shifts at a secondary job, irrespective of fathers’ work schedules (Miller and Chang 2015). Such conflicting evidence may be due to differences in analytical techniques, child age at assessment, and/or cultural context studied, making it difficult to extrapolate to the UK context.
A recent review of the literature on nonstandard work schedules and child outcomes has highlighted family structure as a salient moderator of the role of nonstandard work (Li et al. 2014). Families with more social and economic resources may be better able to respond to the challenges of nonstandard work schedules. Particularly, it has been hypothesized that single-parent families may have limited economic and time resources and these disadvantages may exacerbate the potential adverse associations between nonstandard work schedules and children’s health. Surprisingly, research examining differences in the relationship between nonstandard employment and children’s risk of overweight/obesity by family structure has consistently found nonstandard shift work to be associated with an increased risk of overweight/obesity for children in two-parent families (Miller and Chang 2015; Miller and Han 2008).
Our analyses will complement and extend prior research in several important ways. First, no study has investigated the association between nonstandard work schedules and children’s BMI in the United Kingdom. Second, the contribution of joint parental nonstandard work schedules on BMI trajectories has not been examined. Third, we will distinguish between one- and two-parent families when we examine joint parental work schedules measured at 9 months of age (Champion et al. 2012; Miller and Chang 2015), as family structure is a potential moderator of the association of nonstandard work and child outcomes (Li et al. 2014).
2. Data
2.1 BMI
BMI was derived as weight (kg) divided by the square of height (m2). Height and
weight measurements were collected from children at ages 3, 5, 7, and 11 years using Tanita scales and stadiometers (Hansen and Joshi 2007). Changes in raw BMI provide estimates that are more interpretable over other BMI (e.g., percent, z score, or centile) measures when investigating childhood adiposity changes (Berkey and Colditz 2007). BMI is a limited measure of adiposity because it does not distinguish between fat and muscle (Burkhauser and Cawley 2008), but it is used to establish adiposity in children in both clinical and research settings (Krebs et al. 2007).
2.2 Parental nonstandard employment
Information on maternal and paternal nonstandard work was collected at 9 months. Parents who reported being in paid work were asked to state the frequency they worked each type of nonstandard work schedule: evening (6 p.m.‒10 p.m.), night (10 p.m.‒ 7 a.m.), away from home overnight, and weekends. The response categories were ‘every week,’ ‘at least once a month,’ ‘less than once a month,’ and ‘never.’ These were collapsed into a binary variable in which respondents were coded as 1 if they worked a particular schedule every week and 0 if otherwise. Respondents were categorized as working a standard schedule if they were employed but indicated that they did not have any of the nonstandard work schedules described. A mutually exclusive variable described nine joint parental work schedules, in line with previous research (Champion et al. 2012): (1 ‒ referent) both parents standard; (2) both parents nonstandard; (3) mother nonstandard/father standard; (4) mother standard/father nonstandard; (5) one parent employed standard, one-parent family; (6) one parent employed standard, two-parent family; (7) one two-parent employed nonstandard, one-two-parent family; (8) one two-parent employed nonstandard, parent family; or (9) neither parent employed (one- or two-parent family).
captured from parents who may be in sales or service jobs alongside parents who reported professional or managerial jobs ‒ industries represented in nonstandard employment (Han 2008; Presser 2003).
2.3 Time-invariant covariates
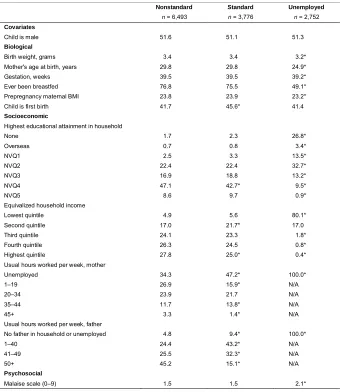
Biological, socioeconomic, and psychosocial covariates were also measured at 9 months. Informed by previous research, we controlled for variables that are associated with both nonstandard work schedules and children’s BMI growth (Martinson, McLanahan, and Brooks-Gunn 2015; Miller and Chang 2015). These were child’s gender, birth weight, mother’s age in years, gestational age at birth, whether ever breastfed, prepregnancy maternal BMI, birth order, highest educational attainment in the household, equivalized household income in quintiles (adjusted for household size), usual hours worked per week (mothers and fathers separately), and mother’s psychological distress. There was considerable variation in these covariates between families who worked any nonstandard shift and families who did not work these schedules (see Appendix Table A-1), and these differences across families justified the inclusion of these covariates.
3. Statistical analysis
We analyzed singleton children because of the moderating effect of multiple births on child development (Hansen and Joshi 2007). Descriptive statistics and longitudinal analyses were conducted on a sample of children for whom the main respondent was the mother (~99% of parents interviewed at 9 months) and there was complete information on parental work schedules, covariates, and at least one BMI measurement (n = 13,021; 43,141 child-years).
child BMI and obesity, we assessed changes in BMI per year (Miller and Chang 2015; Morrissey, Dunifon, and Kalil 2011). To account for potentially nonlinear BMI trajectories, we included a squared term for time. Wald tests revealed that the squared term did not vary by work schedules. In sensitivity analyses, a cubed term of time was added, which produced results consistent with those described below.
In supplementary analyses, we examined whether the association between parental work schedules and BMI trajectories varied by gender. We added an interaction between parental work schedules and gender and a three-way interaction among parental work schedules, gender, and time. The same strategy was used to investigate potential heterogeneity in the association between parental work schedules and BMI trajectories by work hours.
We present tables illustrating estimated BMI at age 3 and rate of change in BMI by parental work schedules for both age- and gender-adjusted and multivariable-adjusted models. To decrease complexity, results for control variables are not shown in regression models. All analyses are weighted to account for nonresponse and the unequal probability of being sampled.
4. Results
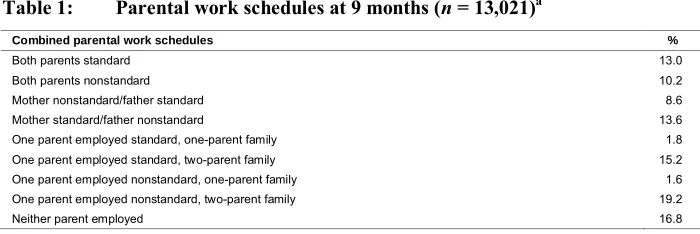
Table 1 describes parental work schedules at 9 months. Over 50% of families, irrespective of family structure, had at least one parent working a nonstandard schedule. One-third of families had two employed parents and at least one parent working a nonstandard schedule. Almost 2% of families were a single-parent family in which the mother worked a nonstandard schedule. Nearly 17% of all families had one or both parents unemployed.
Table 1: Parental work schedules at 9 months (n= 13,021)a
Combined parental work schedules %
Both parents standard 13.0
Both parents nonstandard 10.2
Mother nonstandard/father standard 8.6
Mother standard/father nonstandard 13.6
One parent employed standard, one-parent family 1.8
One parent employed standard, two-parent family 15.2
One parent employed nonstandard, one-parent family 1.6
One parent employed nonstandard, two-parent family 19.2
Neither parent employed 16.8
Table 2 presents estimates from growth curve analyses. The intercept coefficients represent differences in BMI at age 3 (baseline) by parental work schedules. Children in two-parent families in which only one parent was working (irrespective of schedule type) had significantly lower BMI at age 3 than children in two-parent families in which both parents worked standard schedules (coefficient: ‒0.13, standard error: 0.06; coefficient: ‒0.18, standard error: 0.06; Model 1); however, these baseline differences were attenuated in models that also accounted for biological and socioeconomic factors.
Table 2: BMIa trajectory growth models from combined parental work
schedulesb
Model 1c Model 2d
Baseline Growth Baseline Growth
Intercept 16.4*** ‒0.31*** 14.9*** ‒0.31***
(0.050) (0.014) (0.43) (0.014)
Wave squared 0.075*** 0.075***
(0.0010) (0.0010)
Both parents nonstandard ‒0.0015 0.056** ‒0.011 0.056**
(0.068) (0.018) (0.069) (0.018)
Mother nonstandard/father standard 0.032 0.0080 0.058 0.0075e
(0.078) (0.019) ‒ (0.075) (0.019)
Mother standard/father nonstandard ‒0.064 0.023 ‒0.046 0.023
(0.066) (0.018) (0.065) (0.018)
One parent employed standard, one-parent family ‒0.21 0.15*** ‒0.073 0.15***
(0.12) (0.043) (0.14) (0.043)
One parent employed standard, two-parent family ‒0.18** 0.013 0.0099 0.013e
(0.061) (0.016) (0.074) (0.016)
One parent employed nonstandard, one-parent family 0.0021 0.041 0.19 0.039f
(0.14) (0.028) (0.15) (0.028)
One parent employed nonstandard, two-parent family ‒0.13* 0.026 0.063 0.026
(0.060) (0.015) (0.073) (0.015)
Neither parent employed ‒0.011 0.092*** 0.36** 0.092***
(0.065) (0.017) (0.12) (0.017)
Variance 2.0 0.14 1.9 0.14
Covariance between baseline and growth ‒0.01 ‒0.05
Model fit
AIC 183,315.6 182,379.1
BIC 183,523.7 182,760.6
a Weight (kg)/height (m2)
b Total number of children in Models 1 and 2 is 13,021, and number of child-years is 43,141. All estimates are weighted by sample weights. Reference category is both parents working standard schedules. Standard errors in parentheses.
c Model 1 includes age and gender.
d Model 2 includes age, gender, and all covariates.
e Work schedule significantly different from both parents working nonstandard shifts at p <0.05. f
Three groups of children had faster rates of BMI growth across childhood than their peers whose parents both worked standard schedules: children in two-parent families in which both parents worked nonstandard schedules, children in one-parent families whose parent worked a standard schedule, and children in families in which neither parent was employed. These associations were robust to adjustment for confounding factors. Figure 1 depicts predicted BMI trajectories for children in two-parent families in which both two-parents worked standard schedules and in which both parents worked nonstandard schedules, and in one-parent families in which the parent worked a standard schedule.
Figure 1: Predicted BMI trajectories by parental work schedules
Note: This figure presents predicted BMI trajectories by parental work schedules in children aged from 3 to 11 years using the modal value of categorical and the mean value of continuous control variables. Predictions are displayed only for significant parental work schedules as reported in Table 2.
associations of BMI at age 3 with any of the other parent and child characteristics were statistically significant, all else being equal.
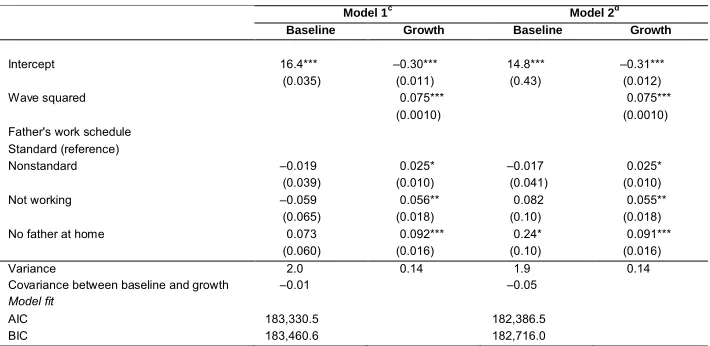
We examined maternal and paternal nonstandard work separately and found only paternal nonstandard work (Table 3), as compared to working a standard schedule, to be associated with significant increases in BMI across childhood. These estimates were robust to adjustments for covariates. We also examined factors that may moderate the association between parental work schedules and BMI trajectories (data not shown). We tested whether parental work schedules differentially impacted boys and girls, given evidence of gender differences in the maternal employment literature (Han and Miller 2009; Han, Waldfogel, and Brooks-Gunn 2001). Our key findings on parental work schedules noted above did not vary by gender at baseline; however, BMI trajectories for children in two-parent families in which both parents worked nonstandard schedules did. Girls had a faster rate of BMI growth than boys. Finally, given the evidence on the linkages between the intensity of employment and increased risk of overweight/obesity (Benson and Mokhtari 2011; Coley and Lombardi 2012), we examined moderation by parental total work hours, observing no significant variation in the associations for baseline BMI or BMI trajectories by total work hours.
Table 3: Growth curve analyses predicting BMIa from fathers’ work
schedulesb
Model 1c Model 2d
Baseline Growth Baseline Growth
Intercept 16.4*** ‒0.30*** 14.8*** ‒0.31***
(0.035) (0.011) (0.43) (0.012)
Wave squared 0.075*** 0.075***
(0.0010) (0.0010)
Father's work schedule Standard (reference)
Nonstandard ‒0.019 0.025* ‒0.017 0.025*
(0.039) (0.010) (0.041) (0.010)
Not working ‒0.059 0.056** 0.082 0.055**
(0.065) (0.018) (0.10) (0.018)
No father at home 0.073 0.092*** 0.24* 0.091***
(0.060) (0.016) (0.10) (0.016)
Variance 2.0 0.14 1.9 0.14
Covariance between baseline and growth ‒0.01 ‒0.05
Model fit
AIC 183,330.5 182,386.5
BIC 183,460.6 182,716.0
a Weight (kg)/height (m2)
b Total number of children in Models 1 and 2 is 13,021, and number of child-years is 43,141. All estimates are weighted by sample weights. Standard errors in parentheses.
c Model 1 includes age and gender.
5. Discussion
Using nationally representative longitudinal data from the United Kingdom, we found that children’s BMI trajectories between the ages of 3 and 11 years were associated with parental work schedules at 9 months of age. Children in families in which both parents worked nonstandard schedules and children in one-parent families whose parent worked a standard schedule had significantly increased BMI growth across early to mid-childhood, as compared to their peers in families whose parents worked standard schedules. Our finding on two parents working nonstandard schedules can be considered more robust than a prior study which used a cross-sectional sample and found a borderline significant association between joint work schedules and child overweight/obesity (Champion et al. 2012), but it is inconsistent with a recent analysis of US children which found no association between both parents working nonstandard schedules and risk for overweight or obesity (Miller and Chang 2015). This could be due to our more detailed joint work classification and incorporation of family structure. Two studies more closely related to our analysis have used raw BMI scores but have conflicting findings. One study found no relationship between maternal shift work and BMI z scores among 8- and 12-year-olds (Morrissey, Dunifon, and Kalil 2011), whereas another study found that maternal nonstandard work was correlated with higher BMI among 13- and 14-year-olds (Miller and Han 2008). Given the paucity of studies in this research area, it is difficult to draw consistent conclusions on the link between parental work shifts and children’s BMI. Indeed, the variation in the age of the children under examination may explain these different findings. The potential role of a child’s age in modifying the relationship between parental nonstandard work schedules and BMI warrants more research attention.
Examining maternal and paternal nonstandard schedules separately revealed steeper BMI trajectories for children whose fathers worked nonstandard schedules, as compared to standard shifts, but no associations between maternal work schedules and children’s BMI trajectories. Consistent with recent findings (Champion et al. 2012), our results suggest the greater importance of the timing of fathers’ employment. Further research is needed to clarify the mechanisms that link fathers’ nonstandard employment and children’s weight as the biological and socioeconomic characteristics considered in this study did not explain observed associations.
disentangle the influence of family structure and psychosocial factors among parents working nonstandard schedules.
Our study is not without its weaknesses. First, our data is ideal for examining joint parental work schedules at 9 months, but unfortunately less than ideal from the perspective of examining their role across childhood because the MCS does not collect data on fathers’ nonstandard work schedules consistently across waves of data. Information on joint parental nonstandard work is not collected again until children are nearly 7 years old. Thus we do not know when and how changes in joint work schedules may occur between 9 months and 7 years of age. This is an important omission as evidence suggests that factors affecting child well-being may operate differentially across child developmental stages (Duncan and Brooks-Gunn 1997). The implication is that a father’s nonstandard work and its associated mechanisms may depend on a child’s stage of development. Clearly, an important task for future research is to understand whether and how the developmental implications of fathers’ nonstandard shifts change over time. Second, our descriptive study and trajectory modeling strategy do not allow us to draw causal conclusions. Our results may be biased if unobservable factors select parents into particular work schedules when their children are 9 months old. However, this is a general concern for most research on parental employment for which randomized control trials or suitable instrumental variables are uncommon. Nevertheless, we see our research as an important first step in establishing a baseline relationship between combined joint parental work schedules and BMI trajectories, challenging the emphasis on the adverse effects of maternal employment (Fertig, Glomm, and Tchernis 2009). Third, we lack information on the extent to which parents had control over their work schedules, which limits the strength of our conclusions as greater autonomy in work conditions is linked to time with children which is beneficial to their health (Champion et al. 2012). Lastly, parents on parental leave at 9 months (only 2%) are excluded from questions asking about nonstandard schedules and are therefore excluded from our analyses.
Refe
r
ences
Anderson, P.M., Butcher, K.F., and Levine, P.B. (2003). Maternal employment and overweight children. Journal of Health Economics 22(3): 477‒504.
doi:10.1016/S0167-6296(03)00022-5.
Asarnow, L.D., McGlinchey, E., and Harvey, A.G. (2015). Evidence for a possible link between bedtime and change in body mass index. Sleep 38(10): 1523.
doi:10.5665/sleep.5038.
Barker, D.J., Eriksson, J.G., Forsen, T., and Osmond, C. (2002). Fetal origins of adult disease: Strength of effects and biological basis. International Journal of Epidemiology 31(6): 1235‒1239.doi:10.1093/ije/31.6.1235.
Benson, L. and Mokhtari, M. (2011). Parental employment, shared parent–child activities and childhood obesity.Journal of Family and Economic Issues 32(2): 233‒244.doi:10.1007/s10834-011-9249-0.
Berkey, C.S. and Colditz, G.A. (2007). Adiposity in adolescents: Change in actual BMI works better than change in BMI z score for longitudinal studies. Annals of Epidemiology 17(1): 44‒50.doi:10.1016/j.annepidem.2006.07.014.
Burkhauser, R.V. and Cawley, J. (2008). Beyond BMI: The value of more accurate measures of fatness and obesity in social science research. Journal of Health Economics 27(2): 519‒529.doi:10.1016/j.jhealeco.2007.05.005.
Champion, S.L., Rumbold, A.R., Steele, E.J., Giles, L.C., Davies, M.J., and Moore, V.M. (2012). Parental work schedules and child overweight and obesity.
International Journal of Obesity36(4): 573‒580.doi:10.1038/ijo.2011.252. Coley, R.L. and Lombardi, C.M. (2012). Early maternal employment and childhood
obesity among economically disadvantaged families in the USA. Early Child Development and Care 182(8): 983‒998.doi:10.1080/03004430.2012.678594. Daniels, S. (2009). Complications of obesity in children and adolescents.International
Journal of Obesity 33: S60‒S65.doi:10.1038/ijo.2009.20.
Devine, C.M., Jastran, M., Jabs, J., Wethington, E., Farell, T.J., and Bisogni, C.A. (2006). ‘A lot of sacrifices’: Work–family spillover and the food choice coping strategies of low-wage employed parents. Social Science and Medicine 63(10): 2591‒2603.doi:10.1016/j.socscimed.2006.06.029.
Dunifon, R., Kalil, A., Crosby, D.A., and Su, J.H. (2013). Mothers’ night work and children’s behavior problems.Developmental Psychology 49(10): 1874–1885. Fertig, A., Glomm, G., and Tchernis, R. (2009). The connection between maternal
employment and childhood obesity: Inspecting the mechanisms. Review of Economics of the Household 7(3): 227.doi:10.1007/s11150-009-9052-y. Han, W.-J. (2005). Maternal nonstandard work schedules and child cognitive outcomes.
Child Development 76(1): 137‒154.doi:10.1111/j.1467-8624.2005.00835.x. Han, W.-J. (2006). Maternal work schedules and child outcomes: Evidence from the
National Survey of American Families. Children and Youth Services Review
28(9): 1039‒1059.doi:10.1016/j.childyouth.2005.10.007.
Han, W.-J. (2008). Shift work and child behavioral outcomes.Work, Employment and Society 22(1): 67‒87.doi:10.1177/0950017007087417.
Han, W.-J. and Fox, L.E. (2011). Parental work schedules and children’s cognitive trajectories. Journal of Marriage and Family 73(5): 962‒980.
doi:10.1111/j.1741-3737.2011.00862.x.
Han, W.-J. and Miller, D.P. (2009). Parental work schedules and adolescent depression.
Health Sociology Review 18(1): 36‒49.doi:10.5172/hesr.18.1.36.
Han, W.-J. and Waldfogel, J. (2007). Parental work schedules, family process, and early adolescents’ risky behavior. Children and Youth Services Review 29(9): 1249‒ 1266.doi:10.1016/j.childyouth.2007.05.011.
Han, W.-J., Waldfogel, J., and Brooks-Gunn, J. (2001). The effects of early maternal employment on later cognitive and behavioral outcomes. Journal of Marriage and Family 63(2): 336‒354.doi:10.1111/j.1741-3737.2001.00336.x.
Hansen, K. and Joshi, H. (2007). Millennium Cohort Study Second Survey: A user’s guide to initial findings. London: Centre for Longitudinal Studies.
Heymann, S.J. and Earle, A. (2001). The impact of parental working conditions on school-age children: The case of evening work. Community, Work and Family
4(3): 305‒325.doi:10.1080/01405110120089369.
Jabs, J., Devine, C.M., Bisogni, C.A., Farrell, T.J., Jastran, M., and Wethington, E. (2007). Trying to find the quickest way: Employed mothers’ constructions of time for food. Journal of Nutrition Education and Behavior 39(1): 18‒25.
Krebs, N.F., Himes, J.H., Jacobson, D., Nicklas, T.A., Guilday, P., and Styne, D. (2007). Assessment of child and adolescent overweight and obesity. Pediatrics
120(Supplement 4): S193‒S228.doi:10.1542/peds.2007-2329D.
Li, J., Johnson, S.E., Han, W.-J., Andrews, S., Kendall, G., Strazdins, L., and Dockery, A. (2014). Parents’ nonstandard work schedules and child well-being: A critical review of the literature. The Journal of Primary Prevention 35(1): 53‒73.
doi:10.1007/s10935-013-0318-z.
Martinson, M.L., McLanahan, S., and Brooks-Gunn, J. (2015). Variation in child body mass index patterns by race/ethnicity and maternal nativity status in the United States and England. Maternal and Child Health Journal 19(2): 373‒380.
doi:10.1007/s10995-014-1519-7.
McMenamin, T.M. (2007). A time to work: Recent trends in shift work and flexible schedules.Monthly Labor Review 130: 3‒15.
Miller, D.P. and Chang, J. (2015). Parental work schedules and child overweight or obesity: Does family structure matter? Journal of Marriage and Family 77(5): 1266–1281.doi:10.1111/jomf.12215.
Miller, D.P. and Han, W.-J. (2008). Maternal nonstandard work schedules and adolescent overweight. American Journal of Public Health 98(8): 1495‒1502.
doi:10.2105/AJPH.2007.123885.
Morrissey, T.W., Dunifon, R.E., and Kalil, A. (2011). Maternal employment, work schedules, and children’s body mass index. Child Development 82(1): 66‒81.
doi:10.1111/j.1467-8624.2010.01541.x.
Nader, P.R., O’Brien, M., Houts, R., Bradley, R., Belsky, J., Crosnoe, R., Friedman, S., Mei, Z., and Susman, E.J. (2006). Identifying risk for obesity in early childhood.
Pediatrics 118(3): e594‒e601.doi:10.1542/peds.2005-2801.
Phipps, S.A., Lethbridge, L., and Burton, P. (2006). Long-run consequences of parental paid work hours for child overweight status in Canada. Social Science and Medicine 62(4): 977‒986.doi:10.1016/j.socscimed.2005.06.054.
Plewis, I., Calderwood, L., Hawkes, D., Hughes, G., and Joshi, H. (2004). Millennium Cohort Study: Technical report on sampling. London: Institute of Education. Presser, H.B. (1989). Some economic complexities of child care provided by
grandmothers. Journal of Marriage and the Family 51(3): 581‒591.
Presser, H.B. (2003). Working in a 24/7 economy: Challenges for American families.
New York: Russell Sage Foundation.
Singer, J.D. and Willett, J.B. (2003). Applied longitudinal data analysis: Modeling
change and event occurrence. New York: Oxford University Press.
doi:10.1093/acprof:oso/9780195152968.001.0001.
Snell, E.K., Adam, E.K., and Duncan, G.J. (2007). Sleep and the body mass index and overweight status of children and adolescents. Child Development 78(1): 309‒ 323.doi:10.1111/j.1467-8624.2007.00999.x.
Strauss, R. (1999). Childhood obesity. Current Problems in Pediatrics 29(1): 5‒29.
doi:10.1016/S0045-9380(99)80011-5.
van Jaarsveld, C.H. and Gulliford, M.C. (2015). Childhood obesity trends from primary care electronic health records in England between 1994 and 2013: Population-based cohort study. Archives of Disease in Childhood 100(3): 214‒219.
doi:10.1136/archdischild-2014-307151.
Zilanawala, A. (2017). Maternal nonstandard work schedules and breastfeeding behaviors. Maternal and Child Health Journal 21(6): 1308‒1317.
doi:10.1007/s10995-016-2233-4.
Zilanawala, A., Sacker, A., and Kelly, Y. (2016). Mixed ethnicity and behavioural problems in the Millennium Cohort Study. Archives of Disease in Childhood.
Appendix
Table A-1: Descriptive statistics by work schedules at 9 months (mean or %)
Nonstandard Standard Unemployed
n = 6,493 n = 3,776 n = 2,752
Covariates
Child is male 51.6 51.1 51.3
Biological
Birth weight, grams 3.4 3.4 3.2*
Mother's age at birth, years 29.8 29.8 24.9*
Gestation, weeks 39.5 39.5 39.2*
Ever been breastfed 76.8 75.5 49.1*
Prepregnancy maternal BMI 23.8 23.9 23.2*
Child is first birth 41.7 45.6* 41.4
Socioeconomic
Highest educational attainment in household
None 1.7 2.3 26.8*
Overseas 0.7 0.8 3.4*
NVQ1 2.5 3.3 13.5*
NVQ2 22.4 22.4 32.7*
NVQ3 16.9 18.8 13.2*
NVQ4 47.1 42.7* 9.5*
NVQ5 8.6 9.7 0.9*
Equivalized household income
Lowest quintile 4.9 5.6 80.1*
Second quintile 17.0 21.7* 17.0
Third quintile 24.1 23.3 1.8*
Fourth quintile 26.3 24.5 0.8*
Highest quintile 27.8 25.0* 0.4*
Usual hours worked per week, mother
Unemployed 34.3 47.2* 100.0*
1‒19 26.9 15.9* N/A
20‒34 23.9 21.7 N/A
35‒44 11.7 13.8* N/A
45+ 3.3 1.4* N/A
Usual hours worked per week, father
No father in household or unemployed 4.8 9.4* 100.0*
1‒40 24.4 43.2* N/A
41‒49 25.5 32.3* N/A
50+ 45.2 15.1* N/A
Psychosocial
Malaise scale (0‒9) 1.5 1.5 2.1*
Notes: All means and percentages are weighted. Sample sizes are unweighted. Work categories include one- and two-parent families. Nonstandard includes families in which at least one parent is working a nonstandard shift. Standard is exclusive to families that are not working any nonstandard shift but at least one parent is employed. Significance testing is in reference to nonstandard shifts.