VOLUME 38, ARTICLE 33, PAGES 897
,
928
PUBLISHED 8 MARCH 2018
http://www.demographic-research.org/Volumes/Vol38/33/ DOI: 10.4054/DemRes.2018.38.33
Research Article
Can a cash transfer to families change fertility
behaviour?
Synøve N. Andersen
Nina Drange
Trude Lappegård
© 2018 Synøve N. Andersen, Nina Drange & Trude Lappegård.
This open-access work is published under the terms of the Creative Commons Attribution 3.0 Germany (CC BY 3.0 DE), which permits use, reproduction, and distribution in any medium, provided the original author(s) and source are given credit.
1 Introduction 898
2 Theoretical expectations 900
2.1 The cash-for-care benefit 902
2.2 Contextual policy reforms 903
2.3 Hypotheses 904
3 Analytical strategy 906
3.1 Treatment and comparison groups 907
3.2 Data and sample 908
3.3 Models 911
4 Results 912
4.1 Full sample 913
4.2 Different mothers, different adaptations? 915
4.3 Sensitivity analyses 918
4.4 Results: Summary 919
5 Discussion and conclusion 920
6 Acknowledgements 922
References 923
Can a cash transfer to families change fertility behaviour?
Synøve N. Andersen1
Nina Drange2
Trude Lappegård3
Abstract
OBJECTIVE
This paper assesses the much-disputed relationship between family policy and fertility, and cash transfers and fertility in particular.
METHODS
We take advantage of a cash-for-care (CFC) policy introduced in Norway in 1998, and compare the subsequent fertility behaviour of eligible and ineligible mothers over a four-year period. We estimate linear models assessing both the occurrence and timing of second births, relying on a rich set of covariates and a sensitivity analysis to ensure the robustness of our results.
RESULTS
Contrary to theoretical expectations, the results show that CFC-eligible mothers had a slower progression to second births and lower short-term fertility. The patterns differ between different groups of mothers, and the decline in subsequent childbearing is only statistically significant among mothers with upper secondary (but not higher) education and part-time or full-time employment. We find no increase in short-term fertility in any group of mothers, and suggest that this pattern may be driven by an interaction between the CFC benefit and the already established Norwegian parental leave scheme.
CONTRIBUTION
The paper demonstrates how policy changes may indeed be associated with changes in fertility behaviour, and that this association may run in theoretically unexpected directions when a given policy is implemented in a wider policy framework. Moreover, it demonstrates how eligible parents may differ in their response to policies depending on the policy’s income effect and the parents’ opportunity costs of childbearing.
1 Statistics Norway, Oslo, Norway. Email:[email protected]. 2 Statistics Norway, Oslo, Norway.
1. Introduction
The relationship between family policy and childbearing is of great interest to researchers and policymakers alike. There is a concern in all modern societies about the dramatic changes in family dynamics – and in fertility levels in particular – that have taken place during the last forty to fifty years, and family policy has become an important aspect of this discussion. For instance, the Nordic countries are known to have both high levels of fertility and high female employment rates, and this is often ascribed to generous social policies directed at families. However, the empirical questions remain unanswered regarding whether introducing various policies can actually change people’s fertility behaviour and whether there is a causal relationship between family policy and fertility.
Korpi (2000) argues that family policies can be divided into two main groups: general family policies directed at nuclear families, and dual-earner policies that focus on the mother’s participation in the labour market and the father’s participation in childcare. Looking at family decision-making from an economic perspective, both groups of policies can affect continued childbearing by altering the direct and indirect costs of having another child (cf. Björklund 2007; Gustafsson 2001; Walker 1995). In this article we aim to examine the relationship between the introduction of a general family policy – represented here by a cash benefit policy – and future childbearing. The cash benefit policy in question is the so-called cash-for-care (CFC) benefit introduced in Norway in 1998, which entitles all parents of one- and two-year-old children who are not enrolled in publicly subsidised child care to a monthly payment equivalent to the public subsidy for a child care place (approx. EUR 3604). As cash benefits can be seen
as direct compensation for the cost of having children, our main expectation is that fertility increased after the introduction.5 However, as the benefit is a fixed amount per
child, we expect to see different adaptions depending on the mother’s human capital investments and opportunity costs of childbearing. For instance, mothers with low education may find the cash benefit an attractive alternative to employment, which consequently makes them more likely to withdraw from the labour market and care for the child than mothers who are more highly educated.
Previous studies have shown a positive correlation between CFC benefit uptake and subsequent fertility in Norway, a finding that corresponds with the international literature on the relationship between cash benefits and fertility (see, e.g., Gauthier 2007 for an overview). First, Aassve and Lappegård (2009) find a positive association
4 Converted from NOK to EUR on 15 March 2017. This applies to all monetary amounts mentioned
throughout the article.
5 Due to reasons that are explained more thoroughly in Section 3, we only measure subsequent childbearing
between take-up of the CFC benefit and fertility timing, especially for mothers with low education and for the likelihood of having a second child during the benefit period. The authors highlight that mothers with low education are more likely to take the benefit in the first place, but that mothers with high education that do take the benefit are also more likely to have another child than mothers with high education that do not take the benefit. Second, Aassve and Lappegård (2010) point out that there is substantial heterogeneity in the response to the policy between different groups of mothers. Those who take the maximum length of the benefit transition more quickly to a second birth, and this scenario is more pronounced among mothers with low education. Mothers taking cash benefits for a shorter time period are less likely to have a second child during the period they receive the benefit, but more likely later on. This latter pattern is more pronounced among mothers with high education. A possible suggested explanation is that these mothers return to the labour market to renew their eligibility for paid parental leave. Finally, a third study addresses the relationship between family policies and fertility in Norway by looking at three different policies: parental leave, formal childcare, and the CFC benefit (Lappegård 2010). This study shows a positive correlation between the introduction of the CFC and having a third birth, and a positive correlation between the parental leave policy and a second birth.
While all studies suggest a positive relationship between the CFC benefit and fertility, none claim causality, and all explicitly underline the possibility that the findings might be a result of selection. The latter study (Lappegård 2010) has certain similarities to our study, in that it starts out with the entire population of mothers who have had a first or a second child. However, the methodological approach is different than that applied in this analysis: whereas Lappegård (2010) compares the fertility behaviour of mothers who take the benefit to those who do not (both groups giving birth after the implementation), we compare all eligible mothers to all ineligible mothers (the first group giving birth after the implementation and the latter before). The two analyses hence compare different groups of mothers and account for selection in different ways.
reform (i.e., the comparison group with children born before the introduction, in 1994). We rely on population-wide data and account for possible trends in fertility behaviour between 1994 and 1998 by including a rich set of covariates from Norwegian administrative registries (see Section 3.2 for further details). This approach has its shortcomings, and we therefore go on to perform a series of sensitivity analyses to test the robustness of our results (see Section 4.3).
Contrary to previous studies on the uptake of CFC as well as our theoretical expectations, which suggest that the introduction of the CFC benefit should lead to faster parity progression and hence to higher short-term fertility, our results show an overall pattern of slower parity progression and hence lower short-term fertility. In sum, our results may suggest that the results of previous studies are driven by selection effects where mothers who take the CFC benefit are also inclined to have more children. Moreover, and as expected, we see that the changes in fertility behaviour differ between different groups of mothers. The decline in parity progression is only statistically significant for mothers with upper secondary (but not higher) education and for mothers in part-time or full-time employment. Among mothers without upper secondary education we do observe positive effects for the early parts of the follow-up period, but there are no (short-term) effects for the whole follow-up period in either this group or among mothers with higher education or without attachment to the labour market. We suggest that these patterns may be mediated by the already established paid parental leave scheme, and argue that the somewhat surprising results may be an example of how one isolated policy can have unexpected consequences when implemented in a wider policy framework.
2. Theoretical expectations
Following classical economic theory (e.g., Becker 1960, 1981; Easterlin 1975), children can be regarded as a normal good analogous to other goods and services providing satisfaction (i.e., utility) to a family. The decision to have another child will hence depend on the cost or shadow price of childbearing, which, according to Walker (1995), can be said to comprise three components. Firstly, it comprises the direct costs of, e.g., food, clothes, and housing. Secondly, it comprises what is commonly referred to as the opportunity cost of childbearing, namely the loss of income from paid work while the parent (most often the mother6) withdraws from the labour market and cares for the
child. Thirdly, it comprises the loss of (or a lack of growth in) human capital
6 As mothers take the lion’s share of parental leave in Norway and are the primary caregiver during a child’s
investments while the mother is absent from the labour market (cf. Björklund 2007; Gustafsson 2001; Walker 1995). The latter two components are often referred to as the indirect costs of childbearing, and their size will depend on the expected levels of return from both income and human capital had the mother not withdrawn from the labour market (see Walker 1995: 237).
Assessing the impact of various policies on these three cost components can indicate the potential impact of family policy on fertility behaviour (see Björklund 2007). Cash transfers to families can affect fertility decisions by altering the direct cost of childbearing and parental leave benefits (which compensate for lost income) by altering the indirect opportunity cost (see Walker 1995: 237). As the benefit we consider here is a universal benefit that is subject to conditions (see Section 2.1 below), it may affect childbearing through different components, depending on the pre-birth labour market attachment of the mother in a given family. Firstly, the benefit will alter the direct costs of childbearing in families where the mother is nonemployed and can provide care for the child without any opportunity cost and in families where the child can be cared for (free of charge) while both parents maintain their pre-birth labour market attachment. In these families the benefit would add to the family’s existing disposable income and thereby induce a pure income effect. Secondly, the benefit will alter the indirect costs of childbearing in families where the mother temporarily exits the labour market to care for the child. This happens because the benefit provides (limited) compensation for lost income and hence a reduction in her opportunity cost. In these families the introduction of the CFC benefit will lower the shadow price of childbearing, and, all other things being equal, we therefore expect to see an increase in the number of children being born to eligible mothers. Because the CFC benefit is a fixed amount per child we expect to see a larger increase among mothers with part-time employment – for whom the benefit leads to a (relatively speaking) more substantial compensation for lost income – than among mothers in full-time employment.
Vaage 2010). Moreover, the mother’s labour market attachment could be a proxy for her family/work orientation as well as her entitlement to paid parental leave (see below).
It is important to note that this theoretical framework primarily addresses completed fertility, and that it has been thoroughly demonstrated in the demographic literature that there is no inevitable accordance between tempo and quantum effects (see, e.g., Aassve and Lappegård 2010; Kreyenfeld 2002). We are only able to address short-term changes in fertility; however, most new births occur within a four-year time frame (Lappegård 2000) (i.e., within our follow-up). We therefore considered this to be an appropriate relevant theoretical framework for our analysis.
2.1 The cash-for-care benefit
The Norwegian cash-for-care benefit was implemented on August 1, 1998. From this date the law encompassed all one-year-old children, and it was expanded to include two-year-olds from January 1, 1999. All children who turned two between August 1998 and January 1999 were also eligible for the cash transfer in this period so that no children had a break in eligibility. Eligibility started the month after the child turned one year old, and lasted until the month the child turned three (i.e., from 13 to 36 months). Hence, all children born from 1998 onwards were eligible for 24 months of the benefit. Children born before 1996 remained unaffected by the benefit, while children born in 1996 or 1997 were eligible for between 1 and 23 months of the benefit (see Drange 2015).
The CFC benefit consisted of a monthly flat (and tax-exempt) rate of NOK 3,300 (= EUR 360), and the only requirement was that the child did not attend publicly subsidised childcare.7 Apart from this, the benefit was flexible in several respects: it
could be claimed on a part-time basis if the child attended a publicly subsidised childcare centre for between 1 and 32 hours per week, and there was no requirement that one of the parents should stay at home to take care of their child. In other words, the benefit could be spent on private care arrangements such as child-minders, friends, or relatives. We know from a 1999 survey (Reppen and Rønning 1999) that 76% of parents of eligible children received the CFC subsidy. The main childcare arrangement of most parents that applied for the subsidy was parental care; however, a substantial share of children whose parents received the CFC had other informal childcare arrangements. Around 15% had a nanny, and 13% had a combination of parents,
7 Both public and private formal childcare in Norway is subsidised as long as the centres meet certain
relatives, and nannies. Five per cent of the children were looked after by relatives, and the remaining 5% had a part-time childcare slot (implying that the family would receive a reduced subsidy).
The political motivation behind the introduction of the CFC benefit was threefold: 1) to provide parents with more time to take care of their children, 2) to improve freedom of choice regarding care practices within families, and 3) to ensure equality in public transfers between families irrespective of their care practices (Act on Cash Grants to Families with Small Children 1998). The policy gave rise to considerable political debate, and, while those in favour saluted it for improving families’ ‘real freedom of choice’ regarding care practices, its critics argued that the reform reduced incentives for women to participate in the labour market and therefore encouraged a more traditionally gender-differentiated family (Ellingsæter and Leira 2006). Even though the policy is presumed to be gender-neutral, mothers are the most frequent recipients (NAV 2013), and numerous studies have reported negative effects on mothers’ labour market supply (Hardoy and Schøne 2010; Rønsen 2009; Schøne 2004; Drange and Rege 2013). In terms of fertility behaviour, Aassve and Lappegård (2009, 2010) show that those who utilise the CFC benefit accelerate childbearing significantly compared to those who do not. However, it seems likely that mothers who utilise a cash transfer (and thereby decline a full-time childcare place) are qualitatively different from mothers who do not. Hence, the association between benefit uptake and fertility might be explained, in whole or in part, by selection. We attempt to account for such selection by exploring consequences of the introduction of the CFC policy, rather than its uptake.
2.2 Contextual policy reforms
The paid parental leave scheme is the core of Norwegian family policy, and in the period before the introduction of the CFC policy in 1998 (and hence before potential influence on the fertility decisions of the parents studied in our analysis) two main changes were implemented. Firstly, there was a large step-wise extension of the paid parental leave period from the mid-1980s to the early 1990s, from 18 weeks in 1986 to 42 weeks in 1993. The uptake of this extended leave was relatively immediate, and we might therefore expect both the uptake and the duration of paid parental leave to be similar for the comparison group (1994) and the treatment group (1998) in the analysis. The parental leave scheme entitled (in the period we consider here) all Norwegian parents who had worked at least 50% of the time for six out of the ten months before the child was born to up to one year8 of paid parental leave, after which a return to the
8 The leave could then be taken for 42 weeks with 100% income coverage or 52 weeks with 80% income
same job was guaranteed by Norwegian labour market legislation. After this period – i.e., when the child became eligible for the CFC benefit – the parents were entitled to one year of unpaid leave with the same labour market protection as before. During the 1990s the father’s eligibility for paid leave depended on the mother’s eligibility.9
Mothers who were not entitled to leave received a lump sum, which was considerably lower than the parental leave payments. One important feature of the leave scheme is that full eligibility requires employment prior to birth. This means that mothers who wanted full income replacement for subsequent children had to return to work before having another child, unless they decided to have two very closely spaced children10 or
accepted the low lump sum. For most families, however, the latter option would lead to a large decrease in disposable income.
The second change in the paid parental leave scheme was the introduction in 1993 of the father’s quota for paid parental leave. This reserved four weeks of the parental leave period exclusively for the father, but, unlike the extension of the leave, the uptake of this father’s quota was more gradual. This means that those who had children in 1998 had a higher uptake of the father’s quota than those who had children in 1994, and, if this in turn affects subsequent fertility behaviour, our estimates may be biased either downwards or upwards, depending on the direction of this effect. However, studies of the father’s quota find no significant causal effect of the introduction on continued childbearing (Cools, Fiva, and Kirkebøen 2015; Duvander, Lappegård, and Johansson 2016). We therefore do not consider this to be a likely confounder in our analysis.
2.3 Hypotheses
We start off with a general hypothesis of increased (short-term) fertility among mothers who are eligible for the CFC benefit. Due to the fixed size of the cash transfer, we expect to see more substantial increases among mothers with low indirect costs of childbearing, and less – or no – increase among mothers with higher costs.
In addition to the economic incentives resulting from the CFC benefit, we see it as useful to consider possible spillover from the incentives already built into the complexities of existing Norwegian family policies, where the paid parental leave scheme is of particular importance. As already described in more detail, this gives employed parents the opportunity to stay out of employment for one year on paid leave
9 This was changed in 2000, and fathers can now take leave independent of the mother’s right, except for their
use of the father’s quota (see below), which still depends on mothers’ eligibility.
10 For those choosing one year of leave, having two children with less than 16 months spacing entitles the
and another year on unpaid leave. If we assume that a mother uses all the paid leave she is entitled to, she can claim the CFC benefit and stay at home with a child for a total of two years before she needs to return to her job. Furthermore, the fact that paid parental leave depends on employment before (a new) birth means that the mother must return to work before giving birth to another child in order to again become eligible for paid leave. With these two considerations in mind, we can outline two main scenarios for how the introduction of the CFC policy – in interaction with the already established paid parental leave scheme – may have affected fertility behaviour among employed mothers.
Firstly, the CFC benefit might be used as an alternative source of income for up to four years if the mother has her next child within two years (and for up to six years if she has yet another child within four years). This might be a plausible adaption among mothers with low indirect costs of childbearing and some, although weak, attachment to the labour market. In this scenario we might see an acceleration in the transition to a new birth, and hence an increase in short-term fertility.
In a second scenario the CFC benefit could be used as an extension of the paid parental leave period, which is then followed by a (delayed) return to the labour market to regain full eligibility for paid parental leave for future children and to maintain a foothold in the labour market. Delayed return to the labour market could, in turn, delay the next birth, and in this scenario we expect to see a slower transition to a new birth and a decrease in short-term fertility. We see this as a plausible adaptation among mothers with moderate indirect costs of childbearing.
Based on these considerations, we outline two main hypotheses:
Hypothesis 1 – Acceleration: The introduction of the CFC benefit decreases the
cost of childbearing, which in turn increases the demand for children. All other things being equal, the introduction of the CFC benefit therefore speeds up subsequent childbearing and increases short-term fertility. We expect this pattern to be evident among three groups of mothers: 1) mothers with no attachment to the labour market, who experienced a pure income effect of the CFC benefit and therefore have more children, 2) mothers without upper secondary education whose indirect costs of childbearing are low, and 3) part-time employed mothers who accelerate their childbearing to use the CFC benefit as an alternative source of income while completing (or exceeding) their fertility intentions.
Hypothesis 2 – Postponement: The introduction of the CFC policy creates the
lower short-term fertility, which – due to the fixed size of the CFC benefit and relatively low indirect costs of childbearing – is most evident among two groups of mothers: 1) mothers with upper secondary (but not higher) education, and 2) part-time employed mothers who, due to the eligibility criteria of the paid parental leave scheme, are eligible for paid parental leave for their child.
In sum, we expect three patterns to be evident: 1) an increase in short-term fertility among mothers with no or part-time employment and mothers without upper secondary education, 2) a decrease in short-term fertility among mothers with upper secondary education and mothers in part-time employment, and 3) no change among mothers with higher education and mothers in full-time employment. This entails two different outcomes for part-time employed mothers, depending on whether it is the change in the costs of childbearing or the incentive to prolong the leave period that is most influential for the continued fertility behaviour of mothers in this group.
3. Analytical strategy
3.1 Treatment and comparison groups
The CFC policy created exogenous variation in the framework conditions facing parents of young children before and after its introduction. We take advantage of this change, and compare the fertility behaviour of mothers eligible for the benefit to the fertility behaviour of mothers ineligible for the benefit. Our post-reform group (hereafter called the treatment group) comprises mothers who gave birth to their first child in 1998, since children born in 1998 are the first ‘fully treated’ cohort eligible for 24 months of CFC benefit. As a comparison group we use mothers who gave birth to their first child in 1994 (see Drange 2015). The reason for choosing this cohort is twofold. Firstly, we need a cohort whose fertility behaviour we can monitor for some time without them entering the post-introduction period (and hence CFC ‘treatment’). A large proportion of new births occur within four years (Lappegård 2000), and using the 1994 cohort allows us to follow mothers for four years after the birth of their first child (i.e., until December 30, 1998 for children born December 31, 1994). It is worth noting that some of the children subsequently born to mothers in the comparison group may be either partially or fully eligible for the CFC benefit (i.e., those born in 1996/1997 and 1998, respectively), but that this does not challenge our empirical strategy because the decision to have these children was unaffected by the introduction of the CFC benefit.11
Secondly, we need to pay particular attention to relevant policy reforms and social, political, or economic ‘shocks’ that might affect subsequent childbearing in the two cohorts differently. Because of the extension of parental leave in 1990 and the introduction of the fathers’ quota in 1993, we chose to avoid this period when constructing our analysis. This improves our chances of comparing families facing similar framework conditions, but with the important distinction that mothers in the 1998 cohort are eligible for the benefit, whereas mothers in the 1994 cohort are not.
There remain two main challenges to this strategy. Firstly, a key question is whether it was possible for the treatment group to strategically time the birth of their child so that it took place in the eligible period, as this would violate the assumption that the treatment and the comparison groups are similar – apart from the ‘random’ eligibility of the 1998 cohort. The proposal to implement the CFC policy was first presented by the Ministry of Children and Family Affairs to the Council of State on the 30th April 1998, before the law on cash grants was sanctioned on June 26, 1998
(Stortinget 2014). Hence the timing of a birth in 1998 should not be a major concern, and, reassuringly, Drange and Rege (2013) find no evidence that birth patterns in 1998 differ from patterns in 1997 and 1996. Secondly, since all mothers became eligible at the same time, we do not have a group of noneligible mothers to help us to control for general trends. We will rely on a large set of covariates measured before eligibility to
ensure that observable characteristics are not themselves a product of the treatment.12
To account for economic trends resulting in differences in labour market conditions facing the different groups of mothers, we will rely on municipal unemployment rates.
Although we account for economic trends and observable differences between mothers as best as possible, the question of fertility trends unrelated to the policy change remains a challenge. One way of testing the plausibility of our empirical approach is to explore if outcomes of mothers with children born closer together yield similar results. If they do, we should worry less about challenges connected to possible trends and unique features of our chosen treatment group. Thus, to explore robustness, we will implement specifications where we compare outcomes for mothers with children born in 1993, 1995, and 1996 to mothers with children born in 1998. These results are discussed in more detail in Section 4.3.
3.2 Data and sample
We base all analyses on data from Norwegian population registers covering the period 1993–2002. The dataset comprises demographic information on all married or cohabiting parents who had their first common child in either 1994 or 1998, given that the child was born in Norway to Norwegian-born parents or immigrant parents with permanent residence permits. We exclude parents who experience multiple births and births occurring with less than nine months spacing, as we consider these to be special cases. We then record any subsequent birth occurring before the child born in 1994 or 1998 turns four (i.e., for up to 47 months), and register the spacing (in months) between these births. This demographic data on birth histories is merged with other sociodemographic information, such as income, education, and union status, which is retrieved from other administrative registers.
The covariates are included to control for any differences in birth occurrence and timing between our treatment and comparison groups that can be explained by other observable factors than the introduction of the CFC benefit. To avoid covariates being endogenous to the reform, we mainly measure them the year before the child in the treatment and control group was born (i.e., in 1997 and 1993, respectively).
The parents’ age at birth of the treatment or comparison child is included as a continuous variable, with the polynomial ‘age2’ for each parent.
The union status at the birth of the treatment or comparison child is captured as a dummy variable, labelled 1 if the parents were cohabiting and 0 if they were married.
12 Most covariates are measured the year before the child is born, i.e., in 1993 for the pre-reform cohort and in
As already mentioned, those who were not living together the year they became parents are not included in the analysis.
The highest completed educational level the year before the birth of the treatment or comparison child is included as two dummy variables for each parent: ‘upper secondary’ indicates whether the parent has completed upper secondary education (labelled 1) or not (labelled 0), while ‘higher education’ indicates whether the parent has completed higher education (labelled 1) or not (labelled 0). Moreover, we include the variable ‘student’, labelled 1 if the mother had more than 5 months’ (i.e., 50%) student workload in the year before giving birth and 0 otherwise.
The joint family income from paid work (i.e., the sum of both the mother’s and the father’s earnings) the year before the birth is measured as a continuous variable with the polynomial ‘inc2’. This sum is inflation-adjusted by dividing it by the basic amount thresholds in the Norwegian National Insurance scheme (commonly labelled ‘G’), which is updated each year to equal the national wage growth.13 It should be noted that
this income measure does not include social transfers and hence cannot be seen as a measure of total disposable income. We do, however, expect earnings to be a good proxy for both disposable income and labour market attachment, given that social transfers would add equally to the total income for everyone except those with the absolute lowest earnings, for whom social transfers are crucial.
The mother’s relative contribution to the family income is measured as the proportion of her earnings relative to the joint earnings of both parents. This is included as a continuous variable aimed at capturing the pre-birth specialisation within the couple.
The mother’s labour market attachment the year before giving birth is determined by comparing her wages to the basic amount thresholds in the Norwegian National Insurance scheme, which were mentioned earlier. We consider mothers whose labour market income was less than half the basic amount to be nonemployed. Hence, we allow for some labour market activity, but consider it to be negligible. We then distinguish between part-time and full-time employed mothers, where those with earnings of more than half but less than four times the basic amount are considered part-time employed, while those who earn four times the basic amount and above are considered full-time employed. For a similar approach, see Havnes and Mogstad (2011).
The immigrant background of the parents is included as a dummy variable labelled 1 if both parents are born abroad and 0 if at least one parent is born in Norway.
The unemployment rate in the municipality the year before birth is included as a continuous variable to account for economic trends occurring between the two periods.
13 One basic amount (G) equaled about EUR 4,000 (NOK 37,300) in 1993 and EUR 4,600 (NOK 42,500) in
We set missing observations to zero, and include a dummy variable, labelled 1, if unemployment information is missing (and 0 otherwise).
Finally, and only used in the sensitivity analysis (see Table B-2, panel (b)), the kindergarten coverage rate is entered as a continuous variable measuring the proportion of 1-year-olds in the municipality of birth who are enrolled in kindergarten the year the focal child is born. Here we also include a dummy variable labelled 1 if information on kindergarten coverage rates is missing and 0 otherwise. 14
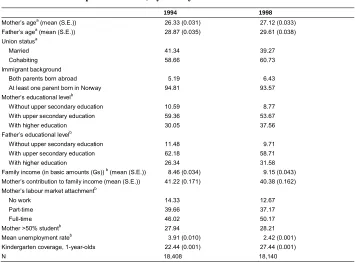
Table 1: Descriptive statistics, by birth year of child
1994 1998
Mother’s agea (mean (S.E.)) 26.33 (0.031) 27.12 (0.033) Father’s agea (mean (S.E.)) 28.87 (0.035) 29.61 (0.038) Union statusa
Married 41.34 39.27
Cohabiting 58.66 60.73
Immigrant background
Both parents born abroad 5.19 6.43 At least one parent born in Norway 94.81 93.57 Mother’s educational levelb
Without upper secondary education 10.59 8.77 With upper secondary education 59.36 53.67 With higher education 30.05 37.56 Father’s educational levelb
Without upper secondary education 11.48 9.71 With upper secondary education 62.18 58.71 With higher education 26.34 31.58 Family income (in basic amounts (Gs))b (mean (S.E.)) 8.46 (0.034) 9.15 (0.043) Mother’s contribution to family income (mean (S.E.)) 41.22 (0.171) 40.38 (0.162) Mother’s labour market attachmentb
No work 14.33 12.67
Part-time 39.66 37.17
Full-time 46.02 50.17
Mother >50% studentb 27.94 28.21 Mean unemployment rateb 3.91 (0.010) 2.42 (0.001) Kindergarten coverage, 1-year-olds 22.44 (0.001) 27.44 (0.001)
N 18,408 18,140
Note: Percentages unless otherwise specified. N = 36,584. a Measured at the birth of the treatment or comparison child. b Measured the year before birth of the treatment or comparison child.
Background characteristics of the treatment and comparison groups are presented in Table 1 above. There are minor-to-small differences between the treatment and comparison groups on most variables included, suggesting that controlling for these
14 We have also tested whether controlling for the kindergarten coverage rates of 2-year-olds impacts the
observable characteristics is important. Four differences stand out as particularly salient. Firstly, a substantially larger proportion of both mothers and fathers have completed higher education in the treatment group; 38% vs. 30% for mothers and 32% vs. 26% for fathers, respectively. This corresponds with general trends in education during this period (see Statistics Norway 2014). Secondly, more mothers in the treatment group work full-time, while fewer are outside the labour market (50% vs. 46% and 13% vs. 14%, respectively). Thirdly, the unemployment rate is lower in the treatment group than in the comparison group (2.4% vs. 3.9%). These two latter discrepancies likely reflect overall labour market conditions at the time (OECD 2005: 237). Fourth, the kindergarten coverage rate among 1-year-olds is higher in the treatment group than in the control group. This reflects investments in public kindergartens during the period.
3.3 Models
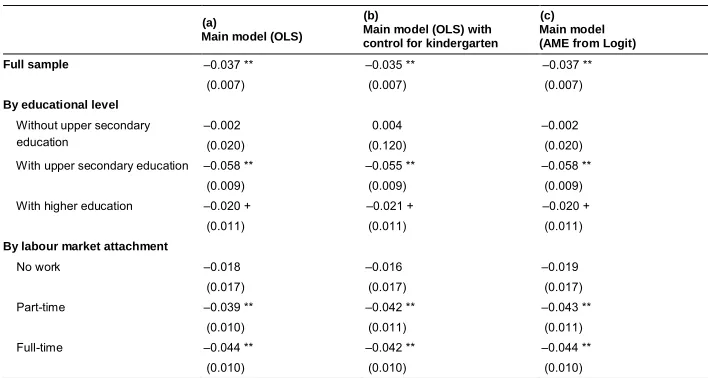
All models are linear regression models, as these provide estimates that remain unaffected by the degree of unobserved heterogeneity and are more intuitive than logit estimates (see Angrist and Pischke 2009; Hellevik 2009; Mood 2010). However, to assure that the choice of model specification does not compromising the validity of our results, we have compared the OLS estimates to the marginal effects from logit models. Reassuringly, the differences are negligible (see Appendix B, Table B-2, for details). We also implement robust standard errors to account for heteroskedasticity.
We start by estimating the overall change in short-term fertility during the follow-up for the full sample. This model takes the form
i i i
i treat X
Y <∗α ∗χ ∗δ , (1)
whereYi is a dummy variable taking the value 1 if motherigives birth to another child before the first child turns four years old.treati is a dummy variable taking the value 1 if mother i gave birth in 1998 and 0 if she gave birth in 1994, and this is the main variable of interest.Xi is a vector of covariates andεiis a random error term.
To examine when any difference between the two groups emerges, and how this may change during our follow-up period, we move on to a model estimating the proportion of parents who have had another child when their first/second child is m
months old. This model, in the following referred to as ‘the cumulative model’, takes the form
i i i
im treat X
whereYim is a dummy variable taking the value 1 if motherihas had a new child when the previous child ism months old. This is a cumulative variable, valued 0 until the mother has a new child and 1 thereafter.15 We choose this approach to assess timing
instead of an event history model (using mas an independent variable) to avoid the reform changing the composition of mothers who have not (yet) had a child.treati is a dummy variable taking the value 1 if parentsigave birth in 1998 (and 0 if they gave birth in 1994).Xi is a vector of covariates andεi is a random error term.
In addition to estimating these models for the full sample, we reiterate them for subsamples split by the mother’s educational level and labour market attachment the year before birth. This is done to further test the postulations in our two hypotheses, as we see education and employment as good proxies for the mother’s opportunity costs of childbearing. Moreover, her labour market attachment may provide insight into the possible influence of the paid parental leave scheme.
We wish to briefly highlight that we choose this approach to analyse fertility behaviour over, e.g., survival models, as our focus is on the difference in fertility behaviour between eligible and noneligible mothers. This model provides us with more hands-on information on change than would, e.g., separate survival models for the treatment and comparison groups (wherein the significance level of the difference in question would be unknown) or models with interaction terms between time and treatment status (wherein the number of estimates would become unreasonably high). We therefore perceive this approach to be better suited to answer the question at hand, while at the same time acknowledging that it might differ from common practice in the field of fertility research.
4. Results
The results are presented in two main subsections, one for the full sample and one for the subsamples. Within each of these subsections we address both the overall and cumulative models, presenting the results from the latter in plots. We have estimated the main model for both parity one and two, but will only report parity one results here.16
15 Say, for instance, that a new child is born when the previous child is 25 months old.m0-m24 then has the
value 0, andm25-m47 has the value 1. In other words, mothers are not censored at the time of a new birth, as would be the case in a survival analysis.
16 Results from second parity estimations are similar to that of first parity and are available from the authors
4.1 Full sample
In sum, about 63% of our sample goes on to have a second child during the follow-up period. If we split the samples by the year of birth we see that the 1998 cohort had a somewhat lower likelihood of having another child during the follow-up period than the 1994 cohort: a 1.08 percentage point reduction (from 63.76% to 62.68%). These crude differences are reflected in panel (a) of Table 2 below, which also shows that the difference is statistically significant at the 5% level. As these parameters are derived from a linear model, the estimate shows the difference in proportion points between those who had their child in 1998 and those who had their child in 1994. We will primarily refer to the estimates as percentage points (by multiplying the coefficients by 100), as this gives a more intuitive interpretation.
Table 2: Treatment estimates when adding covariates stepwise
(a) (b) (c) (d) (e) (f) (g) (h)
Intercept 0.638 ** –1.258 ** –0.985 ** –0.949 ** –0.510 ** –0.520 ** –0.477 ** –0.417 ** Treatment –0.011 * –0.011 * –0.006 –0.005 –0.013 * –0.013 ** –0.013 ** –0.037 ** Mother’s age 0.108 ** 0.098 ** 0.100 ** 0.066 ** 0.070 ** 0.068 ** 0.068 ** Father’s age 0.023 ** 0.028 ** 0.028 ** 0.021 ** 0.020 ** 0.019 ** 0.019 ** Mother’s age2 –0.002 ** –0.104 ** –0.002 ** –0.001 ** –0.001 ** –0.001 ** –0.001 ** Father’s age2 –0.001 ** –0.000 ** –0.001 ** –0.000 ** –0.000 ** –0.000 ** –0.000 ** Cohabiting parents –0.104 ** –1.112 ** –0.096 ** –0.095 ** –0.095 ** –0.094 ** Immigrant parents –0.065 ** –0.011 –0.017 –0.011 –0.012 M. upper secondary ed. 0.037 ** 0.043 ** 0.041 ** 0.041 ** M. higher ed. 0.095 ** 0.098 ** 0.097 ** 0.098 ** F. upper secondary ed. 0.061 ** 0.058 ** 0.057 ** 0.057 ** F. higher ed. 0.044 ** 0.044 ** 0.045 ** 0.046 ** Mother student –0.035 ** –0.397 ** –0.037 ** –0.038 ** Family income –0.000 –0.002 * –0.002 * Family income2 –2.9e–06 6.52e–06 6.69e–06 ** M. income percent –0.001 ** –0.001 ** –0.00 ** M. part-time 0.030 ** 0.029 ** M. full-time 0.046 ** 0.0443 **
Unemployment rate –1.569 **
Unemployment missing –0.047 **
Note: N = 36,548. *: p<0.05, **: p<0.01.
this change. These are both well-known correlates of fertility behaviour (see, e.g., Currie and Schwandt 2014), in which the treatment and control groups differed substantially. We therefore see the drop from the simple to the extended model as plausible.
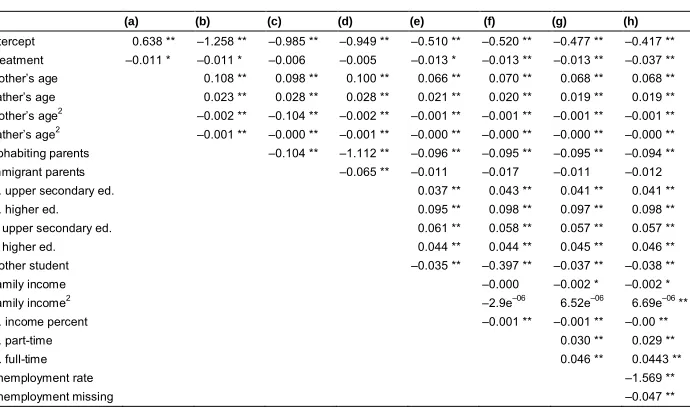
We now move on to the cumulative model, which provides information about the timing of the change we observe in Table 2. The results – all derived from models with covariates – are presented in Figure 1 below, while the treatment estimates and their corresponding p-values are shown in Appendix A.
Figure 1: Difference in share of mothers (reported on y-axis) having a second child by a certain month (reported on x-axis)
Note: With and without control variables. Estimates and p-values are found in Table A-1.
The point estimates in this figure show the difference (in proportion points) in the share of mothers who had given birth to another child when the first child was m
in 1998 than among those whose first child was born in 1994. As the model is cumulative, the new child could have been born in any of the months preceding and including the 20th month.
Looking closer at the upper, blue line in Figure 1, we see that the estimates from the simple model fluctuate around zero for the first part of the follow-up and then drop to about –1 percentage points for the latter half. The difference between the treatment and the comparison groups is only statistically significant in months 10, 35–36, and 42, and then from the 44th month onwards. However, as we can see from the lower, red
line, the extended model displays a more consistent, downward trend in which the estimates drop after about 18 months and remain negative and statistically significant at the <5% level from the 20th month onwards.
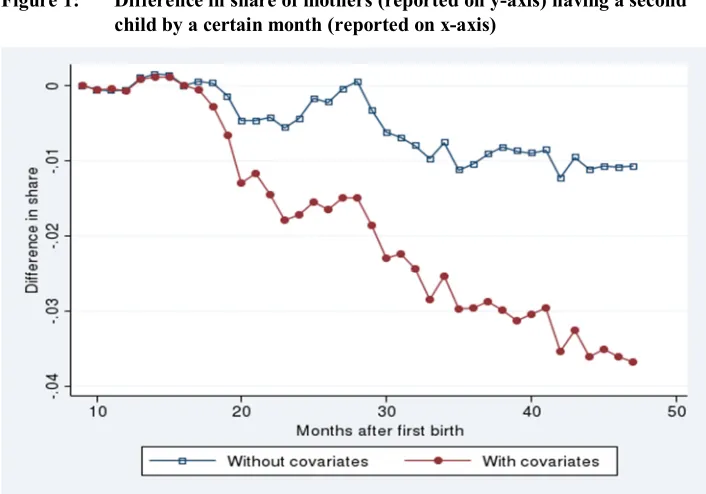
4.2 Different mothers, different adaptations?
To further test our two hypotheses, and hereby gain further insight into the mechanisms underlying this somewhat surprising negative pattern, we now move on to the results from the subsample analyses. We start by splitting the sample by educational level, before proceeding to a split by labour market attachment. We only assess the estimates from the extended, cumulative models here, presenting them in plots similar to the one above.
Starting with Figure 2, which shows the cumulative treatment estimates split by the mother’s educational level, there seem to be distinctive developments over time for the three different groups. For mothers without upper secondary education the point estimates show an overall positive trend, which reaches statistical significance in months 13–17, 23–24, and 28–29. However, after 47 months there is no significant change in second births in this group.
However, at the end of the follow-up the only significant change in births has occurred among mothers with upper secondary (but not higher) education.
Figure 2: Difference in share of mothers (reported on y-axis) having a second child by a certain month (reported on x-axis), by the mother’s educational level before birth
Note: Control variables are included. Estimates and p-values are found in Table A-1.
sample analysis (and hence its support for the postponement hypotheses) does not apply to all groups of mothers.
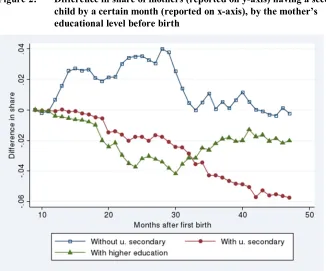
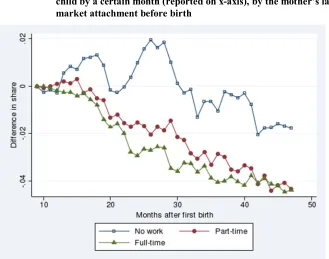
Splitting the sample by the mother’s labour market attachment the year before birth (see Figure 3), two main patterns emerge. On one side there is a slightly downward but statistically insignificant trend for mothers without labour market attachment. On the other side there is a steady downward trend for both part-time and full-time employed mothers. These estimates are statistically significant from the 30th
month onwards for the part-time employed, and from the 19th month onwards for the
full-time employed. At the end of the follow-up period the difference between the treatment and comparison groups is –4.34 percentage points for the part-time employed and –4.39 percentage points for the full-time employed, both estimates significant at the <1% level. In sum, these results provide support for the postponement hypothesis for part-time employed mothers, while at the same time rejecting our postulation that there would be no change in fertility behaviour among full-time employed mothers.
Figure 3: Difference in share of mothers (reported on y-axis) having a second child by a certain month (reported on x-axis), by the mother’s labour market attachment before birth
4.3 Sensitivity analyses
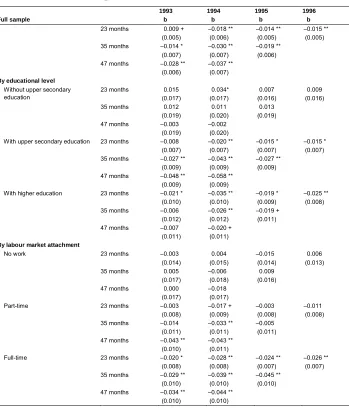
The main challenge to our analytical strategy is that there may be trends in fertility between 1994 and 1998 that are driven by factors other than the introduction of CFC (and the sociodemographic variables we control for in our models). To explore this possibility further we conduct three identical analyses using the 1993, 1995, and 1996 cohorts as our comparison groups, under the assumption that the results should be similar in the absence of unobserved trends. To avoid the comparison group entering eligibility we are restricted to a follow-up of three years for the 1995 cohort and two years for the 1996 cohort. A clear downside to this approach is that some of the differences between the treatment group and comparison group in our main analysis only become statistically significant towards the end of the follow-up. However, we are still able to compare the samples up to this point in time.
Table B-1 in Appendix B reports the results from this sensitivity analysis. From left to right, we read results for different comparison groups. If trends in fertility not picked up by our covariates explain our results, we expect to see more pronounced estimates the longer the time gap between the first births of the comparison group and the treatment group. That is, results should be larger in the first column compared to our main results, and then the third and fourth column should show decreasing estimates. We do not observe increasing estimates the larger the time gap between the first births of the comparison group and the treatment group. This is reassuring, as it indicates that trends cannot explain our treatment estimates. However, the estimates are generally somewhat smaller in the sensitivity models than in the main model, and this suggests that the absolute effects that are derived from our main model might be somewhat generous. In sum, we see the sensitivity analysis as reassuring in that it primarily displays similar patterns to the main analysis.
4.4 Results: Summary
Our full sample analysis shows that mothers who are eligible for the cash-for-care benefit have, on average, fewer children than ineligible mothers during the four-year follow-up period. After controlling for the observable sociodemographic characteristics of both parents, of which educational level and local unemployment trends are the most influential, the decline is statistically significant after approximately 20 months. At the end of the follow-up the proportion of mothers having another child before the previous child is four years old is 3.68 percentage points lower in the treatment group. This equals a relative decline of 5.8%. This result is supported by our sensitivity analysis, although the estimates are somewhat smaller. This means that our overall finding is that the introduction of the CFC had a negative effect on short-term fertility, a finding that stands in contrast to the international literature (Gauthier 2007). This finding also suggests that the positive associations found between CFC uptake and fertility in Aassve and Lappegård (2009, 2010) and Lappegård (2010) are driven by selection. In making sense of this latter inconsistency it is important to remember who comprise the comparison group in the different studies, and that it is possible for mothers who take the CFC benefit to have higher fertility than those who do notand lower fertility than mothers who are similar to themselves, except for having had their child prior to the CFC implementation.17
When running the models separately by mother’s educational level and labour market attachment, we see that the full sample analysis covers quite disparate changes in fertility behaviour in different groups of mothers. Splitting the models by the mother’s educational level before birth, overall the estimates do suggest an acceleration in parity progression among mothers without upper secondary education and a postponement among mothers with upper secondary and higher education. However, at the end of the follow-up the estimates are statistically significant only for mothers with upper secondary (but not higher) education, leaving no significant change in second births in either of the other two groups. Finally, splitting the models by the mother’s labour market attachment the year before birth, the point estimates tell an even clearer story of a polarization, with no change occurring among nonemployed mothers and a negative, statistically significant decline occurring among both part-time and full-time
17 LetM be all mothers, of whichC (the compliers) would take the benefit if they were eligible whileN (the
employed mothers. Except for certain aspects of the tempo patterns among part-time employed mothers, all subsample analyses are supported by our sensitivity analysis.
5. Discussion and conclusion
This analysis set out to test two main hypotheses regarding the effect of cash transfers to families on subsequent fertility behaviour. To reiterate their contents, we will address each of them in their proposed order.
The acceleration hypothesis postulated that the introduction of the CFC policy reduced the cost of childbearing, which in turn would increase the demand for children. All other things being equal, we therefore expected the introduction of the CFC benefit to speed up future childbearing and increase short-term fertility. When looking at the analyses for the full sample, which show lower short-term fertility among mothers eligible for the CFC benefit, this hypothesis does not receive any support from our data. However, the acceleration hypothesis also predicted that the speed-up pattern would primarily be evident among three groups of mothers: 1) mothers with no attachment to the labour market, 2) mothers without upper secondary education, and 3) part-time employed mothers. The subsample analyses provide some support as regards the second group, although only before the first child is 30 months old. This acceleration hypothesis was seen as a likely adaption for women who might see the CFC benefit as an alternative income source, and that we do not see any significant short-term effects in any of the groups suggests that the size of the CFC benefit might have been too small to create any substantial income effect.
The postponement hypothesis postulated that the introduction of the CFC policy would lower short-term fertility by creating a possible compensation for lost income while the mother extended her leave period, which in turn would delay her labour market return as well as her subsequent childbearing. Contrary to the acceleration hypothesis, this hypothesis is strongly supported by our data. The overall pattern is a consistent downward trend, which is statistically significant from 20 months onwards. We suggest that this pattern is driven by the Norwegian institutional setting, where mothers must return to work for six months before they can take a renewed period of paid parental leave. This postulation is substantiated by studies that find an increase in fertility when a policy similar to the CFC benefit is implemented in an institutional context where this return to work is not encouraged or required (see, e.g., Lalive and Zweimüller 2009).
(but not higher) education. Our subsample models support this, although the sensitivity analysis suggests that we should interpret the details of the tempo patterns in part-time employment with some caution. This still means that out of the two theoretically plausible outcomes for part-time employed mothers, it is the postponement mechanism that is supported by our data. This is a noteworthy finding, as it runs counter to what we would expect based on classical economic theory (e.g., Becker 1960, 1981; Easterlin 1975). We have argued that this result is plausibly driven by the features of the Norwegian paid parental leave scheme, but similar analyses conducted in different institutional contexts would be a welcome opportunity to explore the relevance of this argument further. Finally, the subsample analyses support our expectation of no change among mothers with higher education (as measured after four years), but discard the expectation of no change among mothers with full-time employment. Both the main models and the sensitivity models suggest a statistically significant change in parity progression among mothers in full-time employment, suggesting that some employment may be as important to the mother’s indirect costs of childbearing as the strength of her labour market attachment.
Studies looking at the take-up of the CFC subsidy and subsequent fertility find, overall, that those accepting the subsidy are more likely to have a second or third child earlier than those who do not (Aassve and Lappegård 2010; cf. Gauthier 2007). As we also mention in Sections 1 and 4.4, we should not be surprised by the different findings from studies using such different methods. We note, however, that Aassve and Lappegård (2010) find that mothers that do take up parts of the CFC are more likely to postpone their second birth than mothers who take the maximum benefit. This may imply that mothers with a strong attachment to the labour market, but who also choose to make use of the CFC benefit, adjust their behaviour by postponing childbearing to re-qualify for the parental leave programme, in line with our findings.
introduction, as well as in the timing of this transition. Finally, the analysis demonstrates that a given policy can have theoretically unexpected consequences when implemented in a wider policy framework that mediates its effect. In this particular case, an interaction between the CFC benefit and the paid parental leave scheme may explain the unexpected pattern we observe. In sum, the current study demonstrates how a universal family policy can have different consequences for family behaviour depending on its income effect and the mothers’ opportunity cost of childbearing, as well as its interaction with other family policies. This demonstrates, yet again, the complex nature of the relationship between public policy and demographic behaviour.
6. Acknowledgements
References
Aakvik, A., Salvanes, K.G., and Vaage, K. (2010). Measuring heterogeneity in the returns to education using an education reform. European Economic Review
54(4): 483–500.doi:10.1016/j.euroecorev.2009.09.001.
Aassve, A. and Lappegård, T. (2009). Childcare cash benefits and fertility timing in Norway. European Journal of Population 25(1): 67–88. doi:10.1007/s10680-008-9158-6.
Aassve, A. and Lappegård, T. (2010). Cash-benefit policy and childbearing decisions in Norway. Marriage and Family Review 46(3): 149–169.doi:10.1080/01494929. 2010.490094.
Angrist, J.D. and Pischke, J.-S. (2009).Mostly harmless econometrics: An empiricist’s comparison. Princeton: Princeton University Press.
Becker, G.S. (1960). An economic analysis of fertility. In: Roberts, G.B. (ed.).
Demographic and economic change in developed countries. Princeton: National
Bureau of Economic Research: 209–240.
Becker, G.S. (1981).A treatise on the family. Cambridge: Harvard University Press. Björklund, A. (2007). Does a family-friendly policy raise fertility levels? Stockholm:
Swedish Institute for European Policy Studies (Report 2007: 3).
Cools, S., Fiva, K., and Kirkebøen, L. (2015). Causal effects of paternity leave on children and parents.The Scandinavian Journal of Economics 117(3): 801–828.
doi:10.1111/sjoe.12113.
Currie, J. and Schwandt, H. (2014). Short- and long-term effects of unemployment on fertility.Proceedings of the National Academy of Science of the United States of
America 111(41): 14734–14739.doi:10.1073/pnas.1408975111.
Drange, N. (2015). Crowding out dad? The effect of a cash-for-care subsidy on family time allocation.Nordic Journal of Political Economy 40(2): 1–29.
Drange, N. and Rege, M. (2013). Trapped at home: The effect of mothers’ temporary labour market exits on their subsequent work career. Labour Economics 24: 125–136.doi:10.1016/j.labeco.2013.08.003.
Easterlin, R.A. (1975). An economic framework for fertility analysis.Studies in Family Planning 6(3): 54–63.doi:10.2307/1964934.
Ellingsæter, A.L. and Leira, A. (2006).Politicising parenthood in Scandinavia. Bristol: Policy Press.
Gauthier, A.H. (2007). The impact of family policies on fertility in industrialized countries: A review of the literature. Population Research and Policy Review
26(3): 323–346.doi:10.1007/s11113-007-9033-x.
Gustafsson, S. (2001). Optimal age at motherhood: Theoretical and empirical considerations on postponement of maternity in Europe. Journal of Population
Economics 14(2): 225–247.doi:10.1007/s001480000051.
Hardoy, I. and Schøne, P. (2010). Incentives to work? The impact of a ‘cash-for-care’ benefit for immigrant and native mothers labour market participation. Labour
Economics 17(6): 963–974.doi:10.1016/j.labeco.2010.02.008.
Havnes, T. and Mogstad, M. (2011). No child left behind: Subsidized child care and children’s long-run outcomes. American Economic Journal: Economic Policy
3(2): 97–129.doi:10.1257/pol.3.2.97.
Hellevik, O. (2009). Linear versus logistic regression when the dependent variable is a dichotomy.Quality and Quantity 43(1): 59–74.doi:10.1007/s11135-007-9077-3. Korpi, W. (2000). Faces of inequality: Gender, class and patterns of inequality in different types of welfare states.Social Politics 7(2): 127–191.doi:10.1093/sp/7. 2.127.
Kreyenfeld, M. (2002). Time-squeeze, partner effect or self-selection? An investigation into the positive effect of women’s education on second birth risks in West Germany.Demographic Research 7(2): 15–47.doi:10.4054/DemRes.2002.7.2. Lalive, R. and Zweimüller, J. (2009). How does parental leave affect fertility and return
to work? Evidence from two natural experiments. The Quarterly Journal of
Economics 124(3): 1363–1402.doi:10.1162/qjec.2009.124.3.1363.
Lappegård, T. (2000). New fertility trends in Norway. Demographic Research 2(3).
doi:10.4054/DemRes.2000.2.3.
Lappegård, T. (2010). Family policies in Norway. European Journal of Population
Lappegård, T. (2012). Couples’ parental leave practices: Workplace situations.Journal
of Family and Economic Issues 33(2): 167–182.
doi:10.1007/s10834-012-9291-6.
Mood, C. (2010). Logistic regression: Why we cannot do what we think we can do, and what we can do about it.European Sociological Review 26(1): 64–82.doi:10.10 93/esr/jcp006.
NAV (2013). Mottakere av kontantstøtte pr. Desember, etter kjønn og alder: 2000–2010 [Recipients of the cash-for-care benefit, as of December, by sex and age: 2000– 2010] [electronic resource]. Oslo: The Norwegian Labour and Welfare Administration. https://www.nav.no/no/NAV+og+samfunn/Statistikk/Familie+-+statistikk/Relatert+informasjon/Arkiv+-+Kontantst%C3%B8tte+pr.+desember +2000-2010.356713.cms.
OECD (2005).OECD employment outlook: Statistical annex. Paris: Organisation for Economic Co-operation and Development.
Reppen, H.K. and Rønning, E. (1999). Barnefamiliers tilsynsordninger, yrkesdeltakelse og bruk av kontantstøtte våren 1999 [The care arrangements, labour market participation and cash-for-care uptake of families with children, spring of 1999]. Oslo: Statistics Norway (Report 1999/27).
Rønsen, M. (2009). Long-term effects of cash for childcare on mothers’ labour supply.
Labour 23(3): 507–533.doi:10.1111/j.1467-9914.2009.00456.x.
Schøne, P. (2004). Labour supply effects of a cash-for-care subsidy. Journal of
Population Economics 17(4): 703–727.doi:10.1007/s00148-003-0176-8.
Statistics Norway (2014). StatBank table 08921: Persons 16 years and older, by sex, age and level of education [electronic resource]. Oslo: Statistics Norway.
https://www.ssb.no/statistikkbanken/selecttable/hovedtabellHjem.asp?KortNavn Web=utnivandCMSSubjectArea=utdanningandPLanguage=1andchecked=true. Stortinget (2014). Lov om kontantstøtte til småbarnsforeldre (kontantstøtteloven) [The
law on cash grants to parents with young children] [electronic resource]. Oslo: Stortinget. https://www.stortinget.no/no/Saker-og-publikasjoner/Saker/Sak/?p=2 589.
Walker, J.R. (1995). The effect of public policies on recent Swedish fertility behavior.
Appendix A: Main analysis
Table A-1: Treatment estimates, with covariates unless otherwise specified
All, no cov. All
Without upper secondary education With upper secondary education Higher
education No work Part-time Full-time
9 –0.000 –0.000 0.000 –0.000 0.000 –0.000 –0.000 0.000 10 –0.001 * –0.001 + –0.002 –0.000 –0.001 + –0.003 –0.001 0.000 11 –0.001 –0.001 –0.001 –0.000 –0.001 –0.002 0.000 –0.001 12 –0.001 –0.001 0.007 –0.001 –0.004 * –0.003 0.001 –0.002 13 0.001 0.001 0.016 * 0.000 –0.004 + 0.006 0.002 –0.003 14 0.002 0.001 0.026 ** –0.001 –0.005 + 0.008 0.001 –0.003 15 0.001 0.001 0.027 * –0.001 –0.006 + 0.007 0.003 –0.004 16 –0.000 0.000 0.026 * –0.002 –0.007 0.012 –0.003 –0.003 17 0.001 –0.001 0.027 * –0.003 –0.008 0.012 –0.001 –0.005 18 0.000 –0.003 0.021 –0.005 –0.010 0.013 –0.005 –0.008 + 19 –0.002 –0.007 0.019 –0.005 –0.020 ** 0.009 –0.006 –0.014 * 20 –0.005 –0.013 ** 0.021 –0.015 * –0.024 ** –0.002 –0.013 + –0.017 ** 21 –0.005 –0.012 * 0.022 –0.014 * –0.021 * –0.003 –0.012 –0.016 * 22 –0.004 –0.015 ** 0.030 + –0.016 * –0.030 ** –0.000 –0.016 + –0.020 ** 23 –0.006 –0.018 ** 0.034 * –0.020 ** –0.035 ** 0.004 –0.017 + –0.028 ** 24 –0.004 –0.017 ** 0.035 * –0.017 * –0.037 ** 0.010 –0.015 + –0.029 ** 25 –0.002 –0.016 ** 0.035 + –0.018 * –0.032 ** 0.016 –0.017 + –0.026 ** 26 –0.002 –0.017 ** 0.033 + –0.020 * –0.030 ** 0.020 –0.020 * –0.027 ** 27 –0.001 –0.015 * 0.031 –0.016 * –0.032 ** 0.016 –0.017 + –0.026 ** 28 0.001 –0.015 * 0.040 * –0.018 * –0.034 ** 0.019 –0.019 + –0.026 ** 29 –0.003 –0.019 ** 0.038 * –0.021 * –0.038 ** 0.010 –0.015 –0.035 ** 30 –0.006 –0.023 ** 0.025 –0.024 ** –0.042 ** 0.001 –0.022 * –0.036 ** 31 –0.007 –0.023 ** 0.014 –0.025 ** –0.036 ** –0.003 –0.023 * –0.032 ** 32 –0.008 –0.024 ** 0.005 –0.029 ** –0.031 * –0.001 –0.028 * –0.033 ** 33 –0.010 + –0.029 ** –0.000 –0.035 ** –0.031 * –0.013 –0.031 ** –0.036 ** 34 –0.008 –0.025 ** 0.005 –0.034 ** –0.025 * –0.006 –0.028 * –0.034 ** 35 –0.011 * –0.030 ** 0.011 –0.043 ** –0.026 * –0.006 –0.033 ** –0.039 ** 36 –0.010 * –0.030 ** 0.001 –0.043 ** –0.022 + –0.011 –0.029 * –0.040 ** 37 –0.009 + –0.029 ** 0.005 –0.044 ** –0.019 –0.002 –0.030 ** –0.040 ** 38 –0.008 –0.030 ** 0.001 –0.046 ** –0.018 –0.004 –0.035 ** –0.038 ** 39 –0.009 + –0.031 ** 0.006 –0.048 ** –0.021 + –0.005 –0.036 ** –0.040 ** 40 –0.0090 + –0.030 ** 0.012 –0.049 ** –0.020 + –0.003 –0.033 ** –0.042 ** 41 –0.0086 + –0.030 ** 0.005 –0.050 ** –0.013 –0.008 –0.035 ** –0.038 ** 42 –0.0123 * –0.035 ** 0.000 –0.057 ** –0.018 –0.021 –0.041 ** –0.041 ** 43 –0.0096 + –0.033 ** –0.001 –0.053 ** –0.016 –0.018 –0.038 ** –0.039 ** 44 –0.0112 * –0.036 ** –0.003 –0.056 ** –0.020 + –0.018 –0.044 ** –0.041 ** 45 –0.0107 * –0.035 ** –0.004 –0.055 ** –0.019 + –0.016 –0.042 ** –0.042 ** 46 –0.0109 * –0.036 ** 0.001 –0.056 ** –0.022 * –0.017 –0.041 ** –0.045 ** 47 –0.0108 * –0.037 ** –0.0024 –0.058 ** –0.020 + –0.018 –0.043 ** –0.044 ** N 36,548 36,548 3,541 20,662 12,345 4,935 14,042 17,571
Appendix B: Sensitivity analyses
Table B-1: Treat estimates at months 23, 35, and 47, by birth cohort (full sample and subsamples)
1993 1994 1995 1996
Full sample b b b b
23 months 0.009 + –0.018 ** –0.014 ** –0.015 ** (0.005) (0.006) (0.005) (0.005) 35 months –0.014 * –0.030 ** –0.019 **
(0.007) (0.007) (0.006) 47 months –0.028 ** –0.037 **
(0.006) (0.007)
By educational level
Without upper secondary 23 months 0.015 0.034* 0.007 0.009 education (0.017) (0.017) (0.016) (0.016)
35 months 0.012 0.011 0.013 (0.019) (0.020) (0.019) 47 months –0.003 –0.002
(0.019) (0.020)
With upper secondary education 23 months –0.008 –0.020 ** –0.015 * –0.015 * (0.007) (0.007) (0.007) (0.007) 35 months –0.027 ** –0.043 ** –0.027 **
(0.009) (0.009) (0.009) 47 months –0.048 ** –0.058 **
(0.009) (0.009)
With higher education 23 months –0.021 * –0.035 ** –0.019 * –0.025 ** (0.010) (0.010) (0.009) (0.008) 35 months –0.006 –0.026 ** –0.019 +
(0.012) (0.012) (0.011) 47 months –0.007 –0.020 +
(0.011) (0.011)
By labour market attachment
No work 23 months –0.003 0.004 –0.015 0.006 (0.014) (0.015) (0.014) (0.013) 35 months 0.005 –0.006 0.009
(0.017) (0.018) (0.016) 47 months 0.000 –0.018
(0.017) (0.017)
Part-time 23 months –0.003 –0.017 + –0.003 –0.011 (0.008) (0.009) (0.008) (0.008) 35 months –0.014 –0.033 ** –0.005
(0.011) (0.011) (0.011) 47 months –0.043 ** –0.043 **
(0.010) (0.011)
Full-time 23 months –0.020 * –0.028 ** –0.024 ** –0.026 ** (0.008) (0.008) (0.007) (0.007) 35 months –0.029 ** –0.039 ** –0.045 **
(0.010) (0.010) (0.010) 47 months –0.034 ** –0.044 **
(0.010) (0.010)
Table B-2: Treat estimates at month 47. Main model (a), main model with control for kindergarten coverage (b), and average marginal effects (AME) from logit specification of main model (c). Full sample and subsamples
(a)
Main model (OLS)
(b)
Main model (OLS) with control for kindergarten
(c) Main model (AME from Logit)
Full sample –0.037 ** –0.035 ** –0.037 **
(0.007) (0.007) (0.007)
By educational level
Without upper secondary –0.002 0.004 –0.002 education (0.020) (0.120) (0.020) With upper secondary education –0.058 ** –0.055 ** –0.058 **
(0.009) (0.009) (0.009) With higher education –0.020 + –0.021 + –0.020 +
(0.011) (0.011) (0.011)
By labour market attachment
No work –0.018 –0.016 –0.019 (0.017) (0.017) (0.017) Part-time –0.039 ** –0.042 ** –0.043 **
(0.010) (0.011) (0.011) Full-time –0.044 ** –0.042 ** –0.044 **
(0.010) (0.010) (0.010)