Telephone: +44 (0)1582 763133 Web: http://www.rothamsted.ac.uk/
Rothamsted Research is a Company Limited by Guarantee Registered Office: as above. Registered in England No. 2393175.
Rothamsted Repository Download
A - Papers appearing in refereed journals
Jenkinson, D. S., Poulton, P. R. and Bryant, C. 2008. The turnover of
organic carbon in subsoils. Part 1. Natural and bomb radiocarbon in soil
profiles from the Rothamsted long-term field experiments. European
Journal of Soil Science. 59 (2), pp. 391-399.
The publisher's version can be accessed at:
•
https://dx.doi.org/10.1111/j.1365-2389.2008.01025.x
The output can be accessed at:
https://repository.rothamsted.ac.uk/item/89y7q/the-
turnover-of-organic-carbon-in-subsoils-part-1-natural-and-bomb-radiocarbon-in-soil-profiles-from-the-rothamsted-long-term-field-experiments
.
© Please contact library@rothamsted.ac.uk for copyright queries.
The turnover of organic carbon in subsoils.
Part 1. Natural and bomb radiocarbon in
soil profiles from the Rothamsted long-term
field experiments
D. S. JENKINSONa, P. R. POULTONa & C. BRYANTb a
Department of Soil Science, Rothamsted Research, Harpenden AL5 2JQ, andbNatural Environment Research Council Radiocarbon Laboratory, East Kilbride, Glasgow G75 0QF, UK
Summary
The Rothamsted long-term field experiments, started more than 150 years ago, provide unique material for the study of carbon turnover in subsoils. Total organic C,14C and13C were measured on soil profiles taken from these experiments, before and after the thermonuclear bomb tests of the mid-20th century. Four contrasting systems of land management were sampled: land cultivated every year for winter wheat; regenerating woodland on acid soil; regenerating woodland on calcareous soil; and old grass-land. The mean radiocarbon ages of all the pre-bomb samples from cultivated land were 1210 years (0– 23 cm), 2040 years (23–46 cm), 3610 years (46–69 cm) and 5520 years (69–92 cm). Bomb radiocarbon derived from thermonuclear tests was present throughout the profile in all the post-bomb samples, although below 23 cm the amounts were small and the pre- and post-bomb radiocarbon measurements were often not significantly different. Values of d13C increased down the profile, from26.3& (0–23 cm layer, mean of all measurements) to25.2&for the 69–92 cm layer. The C/N ratios decreased with depth in virtually all of the profiles sampled. Excluding the surface (0–23 cm) soils from the old grass-land, the hyperbolam¼ 152.12341/(1þ 0.264n) gave a close fit to the radiocarbon data from all depths, all sampling times and all sites, wherenis the organic C content of the soil, in t ha1, andmis the radiocarbon content of the soil, inD14C units, corrected for expansion or contraction of soil layers with time. The aberrant grassland soils almost certainly contained coal: one of them was shown by13 C-NMR to contain 0.82% coal C. In Part 2 (this issue) of this pair of papers, these radiocarbon and total C measurements are used to develop and test a new model for the turnover of organic C in subsoils.
Introduction
This paper presents radiocarbon and associated measurements made on soils taken before and after the thermonuclear bomb tests of the mid-20th century, tests which briefly doubled the radiocarbon content of the atmosphere. The soils came from plots on the Rothamsted long-term field experiments that have been under substantially the same management since the mid-19th century or from nearby areas of cultivated land that had been abandoned in the 1880s and have since reverted to wood-land. Radiocarbon measurements in samples taken from the same place before and after the thermonuclear bomb tests pro-vide a stringent test of any model for the turnover of organic carbon (C) in soil.
Apart from its intrinsic interest as a relatively unexplored part of soil science, subsoil C turnover is relevant to an important environmental issue: the effects of global warming on the stock of organic C held in soil. Of the 1600 Gt of organic C held in the top metre of the world’s soils (Prentice, 2001), about half is in the 25–100 cm layer (Jobba´gy & Jackson, 2000; Lal & Kimble, 2000). Radiocarbon measurements indicate that there is a sharp increase in age down the profile (see for example, Scharpenseel & Becker-Heidmann, 1989; Pessenda et al., 1996; Trumbore, 2000; Torn et al., 2002). Furthermore, the proportion of soil organic C that is held as microbial biomass decreases with depth (Dictoret al., 1998; Fiereret al., 2003; Castellazziet al., 2004).
Global warming brought about by greenhouse gases will result in more rapid decomposition of soil organic matter, thus releasing more CO2to the atmosphere. This positive
feed-back will add to the warming processes, to an extent that is
under active debate (Jenkinsonet al., 1991; Kirschbaum, 2000; Friedlingstein et al., 2001; Jones et al., 2005; Knorr et al., 2005). A realistic sub-model for the turnover of organic C in soil is an essential component of any fully-coupled model of the whole global carbon cycle. As a first step, it may be suffi-cient to treat the top metre of soil as a homogeneous unit when modelling the turnover of soil C on a global basis, as was done, for example, by Jenkinsonet al.(1991). However, a more realistic sub-model, in which C turnover is not assumed to be the same down the profile, may well prove more useful to the global carbon cycle modellers.
For this work, four contrasting systems of land management were selected from the Rothamsted long-term experiments: land cultivated every year for winter wheat; regenerating woodland on acid soil; regenerating woodland on calcareous soil; and old grassland. Some of the soil samples described in this paper were also used by Poultonet al.(2003) in an earlier paper on the accumulation of C and N in land reverting to woodland.
The aim of this paper is straightforward: to present and dis-cuss measurements of organic C and radiocarbon, made on soils sampled down the profile on selected plots from the Rothamsted long-term experiments, before and after thermonuclear testing. In Part 2 (this issue) we use these measurements and others taken from the literature to develop and test a dynamic model for the turnover of organic carbon in subsoils.
Materials and methods
Experimental sites
All of the sites were on Rothamsted Experimental Farm (51°49¢N, 0°21¢W). The old cultivated site (termed ‘Broadbalk Arable’ throughout this and the succeeding paper) was plot 08 on the Broadbalk Winter Wheat experiment, started in 1843, on land that was marked as under cultivation on a map of 1623. This plot receives N (144 kg N ha1), P, K and Mg annually and is limed as needed to prevent acidification: for details of treat-ments and yields see Poulton (2006).
The two areas of regenerating woodland (subsequently termed ‘Broadbalk Wilderness’ and ‘Geescroft Wilderness’) have developed on two old cultivated areas that were fenced off and allowed to revert to woodland in the 1880s; for site maps and a detailed history see Poulton et al. (2003). Broadbalk Wilderness was and is calcareous; Geescroft Wilderness, although neutral when fenced off, is now strongly acid.
Broadbalk Wilderness is located at the top end of the field carrying the Broadbalk Winter Wheat experiment and was once part of this field. The starting Broadbalk samples were not taken from the actual site of the future Wilderness, but in 1881 from the unfertilized plot (3) on the Broadbalk Winter Wheat Experi-ment, which runs up to the edge of the Wilderness. However, historic measurements across the plots of the Broadbalk Winter Wheat Experiment (see the map in Poultonet al., 2003) indicate that there is little variability in subsoil C across the plots of the
Broadbalk Experiment: the mean organic C content of the 23–46 cm layer for the 1881 sampling of plots 3, 5, 8, 10, 14 and 16 was 0.57 0.011%; the corresponding figure for the 46–69 cm layer was 0.450.003%.
The present Geescroft Wilderness was part of an experimental field growing field beans between 1847 and 1878; the area that is now Geescroft Wilderness was marked as cultivated land on the 1623 map. Some of our Geescroft samples came from areas that had received P between 1847 and 1878, some from areas that had not. The starting Geescroft samples were taken in 1883 from two plots (3 and 4) of the beans experiment that had never received P. The old grassland samples came from four subplots on the Park Grass Continuous Hay Experiment; they are referred to in this paper as from ‘Park Grass’. Sir John Lawes stated that the field known as Park Grass had been under pasture for at least 150 years before he and Sir Henry Gilbert started the Continuous Hay Experiment in 1856. However, the field was once under the plough; the characteristic ridge-and-furrow marks of medieval ploughing are still faintly visible. The herbage on the Park Grass Experiment is cut and removed twice a year (see Poulton, 2006). The four subplots we used were: unfertilized unlimed (subplot 3d); unfertilized limed (subplot 3b); fertilized unlimed (14/2d) and fertilized limed (14/2c). The fertilized areas receive N (96 kg N ha1as NaNO3), P, K and Mg annually. Lime is added
at intervals to subplot 3b to maintain topsoil pH at about 6 (Johnston, 1972). However, because no lime has yet been added to subplot 14/2c, it and 14/2d can be regarded as replicates.
Soils
The soil on the old cultivated site and on both of the sites that have been allowed to revert to woodland is mapped as Batcombe Series. That part of the old grassland site from which our sam-ples came is mapped as Hook Series, which differs from Bat-combe only in that the depth to clay-with-flints is greater than 80 cm. The Batcombe Series soil is a moderately well-drained silty clay loam overlying clay-with-flints, which in turn overlies chalk at a depth of several metres (Avery & Catt, 1995). It is classified as a Stagnogleyic Paleo-Argillic Brown Earth by the Soil Survey of England and Wales; the USDA classification is an Aquic Paleudalf. Particle-size analysis shows that clay increases with depth in the Batcombe Series. The 0–23 cm layer of Geescroft Wilderness contained 21% clay, the 23–46 cm layer 43%, the 46– 69 cm layer 55% and the 69–92 cm layer 63%; the correspond-ing figures for Broadbalk Wilderness are 23, 30, 50 and 49% (Jenkinson, 1971, a reference that gives the compete particle-size analysis for soil profiles from each Wilderness). In Part 2 (this issue) of this pair of papers, the Broadbalk Arable profile and the Park Grass profile are taken to have the same clay contents as Broadbalk Wilderness.
Soil sampling
et al., 2003), using a 34-cm diameter drill for the 0–23 cm layer and a 1cm drill for the 23–46 and 46–69 cm layers. A 2.5-cm diameter semi-cylindrical auger was used for the 69–92 2.5-cm layer. The soil was sieved and air-dried, to give the mass of ‘fine soil’ (i.e. dry soil passing a 0.635 cm sieve) and of dry stones that did not pass the 0.635 cm sieve. The mass of ‘fine soil’ per sampling layer, rather than bulk density, which was unduly influenced by the occasional large flint, was used to convert analytical measurements on a % dry soil basis to a per hectare basis. Living plants and roots remaining on the sieve were excluded, but dried and weighed. This living plant mate-rial was excluded from the all the measurements presented in the present paper. The Park Grass soils were treated differ-ently, because of their dense root mat: the surface 5 cm, with its mass of roots, was separated from the remainder of the 0–23 cm layer. After removal of the roots and stones, the ‘fine soil’ from the 0–5 cm layer was combined with the ‘fine soil’ from the 5–23 cm layer for analysis.
The pre-bomb samples had been taken by the traditional Rothamsted procedure, using an open ended steel box 15
15 cm by 23 cm in depth (i.e. 669 inches), driven down-wards into the soil, layer by layer (Dyer, 1902; Jenkinson, 1971). The soil was dried at 40°C, sieved (0.635 cm) to remove stones and the ‘fine soil’ then stored at room temperature for up to 130 years in sealed bottles. The mass of ‘fine soil’ in each of the sampling layers was obtained from the Rothamsted archives. Blakeet al.(2000) were unable to detect any change in the C or N contents of soils from Park Grass that had been kept air-dry in bottles for 32 years, making it likely that changes in the total C and N contents of our stored samples were also negligible. All ‘fine soil’ samples, pre- and post-bomb, were ground for 3 minutes in a disc mill (Tema Model T100, Tema Machinery Ltd., Woodford Halse, Northants, UK) before analysis.
Geescroft was the only site with appreciable litter cover in 1999; this was collected, sieved (<0.635 cm) and weighed from 0.66 m2areas at each sampling position, before sampling the mineral soil. Prior to analysis (including radiocarbon dating), a quantity of the Tema-milled litter was returned to the 0–23 cm soil sample, in proportion to the area sampled.
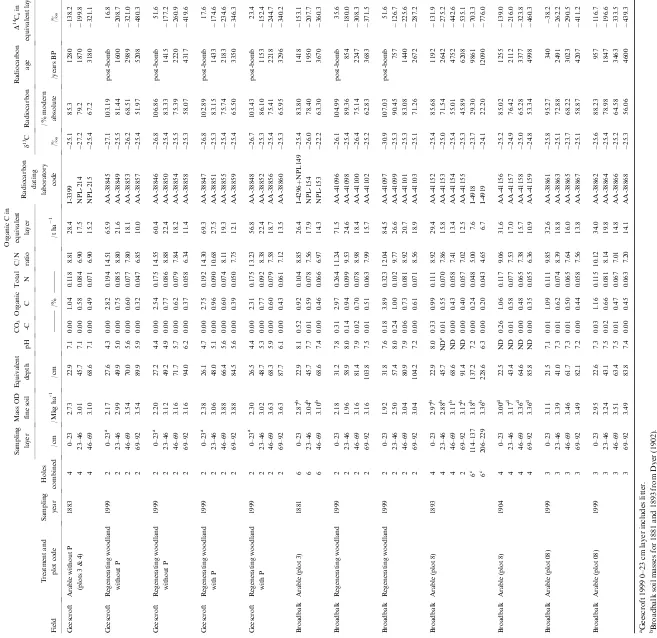
The number of holes sampled at each site is given in Tables 1 and 2.
Analytical methods
Total C and N were determined by combustion using a LECO CNS Analyser (LECO Corp., St. Joseph, MI, USA). Carbonate C was determined by manometry and organic C taken as the difference between total C and carbonate C. Soil pH was mea-sured in water, using a ratio of 10 g soil to 25 ml water. All measurements (except radiocarbon andd13C, see below) were made individually on samples from each layer of each sam-pling hole. Measurements are expressed on an oven-dry basis (24 hours at 105°C). If a row in Table 1 or 2 contains the
pre-fixes I- or NPL-, the analytical methods to obtain the data in that row are as described by Jenkinsonet al.(1992).
Radiocarbon and13C measurements
For reasons of economy, radiocarbon measurements were car-ried out on combined samples, containing equal masses of the contributing soils. Soils from the sampling holes across a site were allocated alternately to an ‘odd’ or ‘even’ sample, which were then analysed separately for radiocarbon. The soils for radiocarbon dating were pre-treated with acid to remove bonate; for consistency this was done to all soils, whether car-bonate was present or not. The soil samples were soaked in 0.1
M HCl for 10 hours, stirred occasionally and the pH mea-sured to ensure that it remained<3. They were then washed free of mineral acid with distilled water, dried and homoge-nized. About 3% of the organic C originally present in the soil is lost during decalcification (Jenkinsonet al.1992); the radiocarbon content of the C thus lost was not measured. The total C in a known weight of decalcified soil was recov-ered as CO2 by heating with CuO in a sealed quartz tube
(Bouttonet al., 1983) and the CO2then converted to graphite
by Fe/Zn reduction (Slotaet al., 1987). The graphite samples were analysed for radiocarbon at the University of Arizona NSF-AMS facility (Donahue, 1995); these samples (Tables 1 and 2) are indicated by the prefix AA-. Tables 1 and 2 also contain a few earlier measurements by other radiocarbon dating laboratories, indicated by the appropriate laboratory prefix; some of these have been published before (Jenkinson & Rayner, 1977; Jenkinson et al., 1992). The 13C isotope ratios were measured on a sub-sample of CO2, using a dual
inlet mass spectrometer with a multiple ion beam collection facility (VG OPTIMA; Fisons Instruments, Middlewich, UK). The mass spectrometer was calibrated with interna-tional reference materials to a precision of0.1&. Thed13C measurements are ultimately related to the PDB belemnite standard and the radiocarbon data to 0.95 of the14C activity of the NBS standard oxalic acid.
ln(% modern/100), using the conventional Libby half-life of 5568 years. To allow for isotopic fractionation, all14C meas-urements are corrected (Stuiver & Polach, 1977) to
d13CPDB& ¼ 25, using the appropriate 13C values in
Tables 1 and 2.
Calculation of equivalent depths
The mass of ‘fine soil’ in the 0–23 cm layer of both Geescroft and Broadbalk Wildernesses was markedly less in the 1999 sam-plings than in the corresponding layers of soil taken before rever-sion to woodland commenced (Table 1). We therefore calculated ‘equivalent depths’, in order to allow for changes with time in bulk density, organic matter content, etc. (Dyer, 1902; Jenkinson, 1971; Gifford & Roderick, 2003). For the top layer, equivalent depth is here defined as ‘the depth to which the top layer should have been sampled at timet, so that it contained the same mass of organic-matter-free and calcium-carbonate-free ‘fine soil’ as at t0, when the first sample was taken to a depth of 23 cm’. Similar definitions hold for deeper layers. Equivalent depths and mass of organic C in equivalent layers were calculated as in Poultonet al.(2003). In essence, equiva-lent depth corrections were made by adding or taking away a slice of material with the composition of the layer below, assuming that transitions between layers were continuous and smooth. In making these corrections, we also assume that sur-face erosion was negligible over the sampling period in all of our (near-level) sites.
The % radiocarbon absolute (r²) in a specified equivalent layer (for example, the 23–46 cm layer) at timetwas calculated from the expression
r²¼ ½f²x²þf²¢x²¢ðH²D²Þ=Lf²x²ðH¢D¢Þ=L=ðc²Þ;
ð1Þ
where primes indicate layer; for example, x² is the measured
mass of organic C (in t ha1) in the 23–46 cm layer at timet,x¢
the corresponding quantity in the 0–23 cm layer andx¢¢¢that in the 46–69 cm layer.D²(in cm) is the measured depth to the bottom of the specified layer (i.e. 46 cm in this case), each layer being of thicknessLcm;H²(also in cm) is the equivalent depth at timet;c²is the calculated mass of organic C in the 23–46 cm equivalent layer at time tandf² is % modern absolute, but adjusted to the value it would have been had the soil been ana-lysed immediately after sampling. This correction (calculated using the true radiocarbon half-life of 5730 years, correspond-ing to a decay constant of 0.0001210 years1) was necessary because some of the radiocarbon measurements were made more than a century after sampling. To make the correction, the values of % modern absolute, as given in Tables 1 and 2, were divided by exp(0.000121w), wherew is the period, in years, between sampling and analysis. Finally, the values of
D14Cein Tables 1 and 2 are given by (10r²1000), whereD14Ce
isD14C corrected to equivalent depth.
NMR spectroscopy
Two 0–23 cm soils from Park Grass were analysed for coal by solid-state13C NMR, one of which we thought (from
radio-carbon measurements; see Results and Discussion section) contained coal as contaminant and the other not. The 13C cross-polarization magic-angle spinning (CPMAS) NMR spectra were measured on a Bruker MSL 300 spectrometer (Bruker Analytik GmbH, Rheinstetten, Germany). The NMR measurements were done by N. Mahieu and E. W.Randall (private communication, 2003).
The following experimental parameters were used: spectrom-eter frequency 75.5 MHz, contact time 1 ms, relaxation time 1 s, and spinning speed around 4.8 kHz, elimination of spinning side-bands using the TOSS (total suppression of sidebands) sequence (Dixon, 1982) and line broadening 50 Hz.
Three runs were done on the putative coal-free sample; by itself, with 1% of coal picked from the Park Grass site and with 2% coal. A fourth run was done on the coal alone. A fifth run was done on the contaminated sample. Before analysis, the soils had been ground for 3 minutes in a Tema disc mill, with added coal where appropriate. The coal sample was ground likewise. The ground samples were packed into cylindrical zirconia rotors (5.617.0 mm internal dimensions) sealed with Kel-F caps (3M Company, Minneapolis, MN, USA). We accumulated 601 433 scans (7 days) for the putative coal-free sample alone, 479 148 (5.5 days) for it ground with 1% coal, 346 936 (4 days) for it with 2% coal, 226 591 (2.6 days) for the contaminated sample and 56 998 (0.7 days) for coal by itself.
Results and discussion
Non-isotopic soil measurements
Organic C and total N decreased down the profile, in all except one instance (the 69–92 cm layer sampled from plot 3d on Park Grass in 1999; Table 2). Taking all the data in Tables 1 and 2 together, there was a close (R2 ¼ 0.98) linear relationship between percentage N and C in the soils, given by the equation:
C¼13:0N0:324: ð2Þ
Except for two measurements in the 69–92 cm layer, C/N ratios decreased with depth in all of the profiles sampled. This decrease is caused, at least in part, by the increasing proportion of the soil N held as fixed ammonium with depth. Bremner (1959), working with soils from plot 07 on Broadbalk, a plot next to that used in the present paper (08), showed that the 0–23 cm layer contained 5.6% of its N as fixed NH4, rising to 18.4% in the 46–69 cm
layer and 22.6% in the 114–137 cm layer. This fixed ammo-nium was held on clay, not on organic matter.
There was little change in pH over the last century in the Broadbalk soils, nearly all being in the 7–8 range, as would be expected for soils containing free CaCO3 throughout the
decrease with time, as generally observed in the Rothamsted field experiments (Bolton, 1977). Soil pH fell slightly with time in the unlimed Park Grass unfertilized soils and rose by about a unit in the limed unfertilized soils; it stayed just under 6 in the fertilized unlimed treatments. In contrast, pH fell sharply in Geescroft Wilderness, from 7.1 in 1883 to a mean of 4.4 in 1999 (see Poultonet al., 2003).
Radiocarbon measurements
Apart from some surface soils from Park Grass, which will be considered later, radiocarbon age increased down the soil profile (Tables 1 and 2). For soil taken in 1893 from the Broadbalk Winter Wheat Experiment, the radiocarbon age increased from 1192 years in the 0–23 cm layer to 12 090 years in the 206–229 cm layer. Taking all the pre-bomb cultivated soil samples together (i.e. all the samples listed in Table 1, except those collected in 1999), there was a linear relationship (R2¼0.94) between the radiocarbon age (x-axis) and negative depth to the middle of each sampling layer (y-axis), given by:
y¼ 0:0162xþ5:28: ð3Þ
Radiocarbon ‘ages’, as given in Tables 1 and 2, must not be taken at their face values, as representing the depositional age of the organic matter in a particular layer of a particular profile. The age of a particular sample is really the age of a homogeneous sample that has the same14C/12C ratio as that of the
heteroge-neous soil sample analysed. Unacceptable errors will be intro-duced if the ages in Tables 1 or 2 are taken as those of a homogeneous pool of C. This can be seen by considering the 1893 sample of the 0–23 cm layer from Broadbalk Arable, which contained 29.4 t organic C ha1, with a radiocarbon age of 1192 years. To a close approximation, this site is under steady state conditions, with the annual input of organic C equal to the annual output. If we treat the organic C in this soil as a homogeneous pool, of average age 1192 years, then the annual steady-state input of organic C is given by 29.4/1192, or 25 kg C ha1year1. This is a ludicrously small value. The aver-age annual offtake of C in grain and straw from this plot over the period 1990–2005 was 3500 kg C ha1. The return of C in stubble to the soil was about 200 kg C ha1year1, and this
fig-ure does not include C returned in roots and chaff. In reality this calculation is misleading because soil organic C contains fractions of vastly different stabilities (see Part 2, this issue).
Taking the radiocarbon data from all the depths and all the sites together, but excluding the Park Grass 0–23 cm soils, there was a hyperbolic relationship (Figure 1) between the radiocar-bon content of a soil (m, expressed asD14Ce) and its organic C
content (n, in t ha1) given by
m¼152:12341=ð1þ0:264nÞ: ð4Þ
Paulet al.(2001) fitted a polynomial to similar data for soils from the US Midwest; their polynomial and our hyperbola
give broadly similar radiocarbon predictions for soil C con-tents of between 10 and 80 t C ha1.
It is worth pointing out that the points on the lower left of Figure 1 are from the deepest subsoils, which contain the least C, although this C is of great age. Those at the top right are from surface soils with much C, although this C is relatively young, again except for the Park Grass surface soils. The principal value of an empirical relationship like Equation (4) is that it immediately draws attention to aberrant data like the Park Grass surface soils.
Measurements ofd13C
Values of d13C increased down the profile, from 26.3&
0.14 (SE) in the 0–23 cm layer (mean of all measurements, excluding one outlier) to 25.8& 0.17 for the 23–46 cm layer, 25.5& 0.11 for the 46–69 cm layer (excluding another outlier) and25.2& 0.09 for the 69–92 cm layer. Such increases with depth are common (Boutton, 1996; Torn
et al., 2002) but not universal (Krull & Skjemstad, 2003). There was a decrease in d13C as organic matter accumulated in the 0–23 cm layer of the Wildernesses, from a starting value in the 1880s of25.3&0.08, decreasing to26.7&0.16 in 1999 (means for both Wildernesses, again omitting one out-lier). Excluding the samed13C outliers, there was a weak rela-tionship (R2¼0.46) betweend13C andD14Ce, given by:
d13C¼ 0:00303 D14Ce
26:43: ð5Þ
Figure 1 Plot of the amount of organic C in a soil layer, against
D14C
efor the same layer, for all the layers and all the sites listed in
Tables 1 and 2. The line shows the hyperbolam¼152.12341/(1þ
0.264n) fitted (R2
¼0.88) to all the data except the Park Grass 0–23 cm soils, wheremis the radiocarbon content of the soil, expressed as
D14Ce, andnits organic C content, in t ha 1
Thus soil organic C gets older with depth and the discrimination against13C becomes less. Presumably the influence of recently-added plant debris (with strongly negative d13C values) becomes increasingly diluted by older soil organic matter (with less negatived13C values) down the profile.
Carbonized material in the soils
Soils often contain carbonized material such as charcoal, coal or lignite (Krull & Skjemstad, 2003; Rumpelet al., 2003). Carbon-ized C had earlier (Jenkinson et al., 1992) been measured in some of the soils listed in Tables 1 and 2. The 0–23 cm layers of the samples taken from Broadbalk in 1881 and from Geescroft in 1883 each contained 0.4 t ha1of carbonized C, roughly 1% of the total soil organic C. There was no detectable carbonized C in the corresponding 23–46 and 46–69 cm layers from either site (detection limit; 0.1 t ha1carbonized C).
Some of our Park Grass surface soils contain much more carbonized C than the corresponding layers on Geescroft or Broadbalk. Earlier work (Jenkinsonet al., 1992) showed that samples of 0–23 cm soil from plot 3 on Park Grass (samples taken at various times, none corresponding to any of the sam-ples in Table 2) contained 4.5–6.0 t ha1 carbonized C, accounting for some 5% of the total soil organic C. Stones larger than 0.635 cm in diameter were excluded when pre-paring our samples for analysis and several of the Park Grass plots sampled in 1999 contained discrete fragments of bitumi-nous coal in the larger than 0.635 cm stone fraction. The coal-contaminated plots are on the end of the experiment closest to Rothamsted Manor and it is possible the coal was present in ash from domestic fires, probably spread during the late 18th or early 19th centuries. Several of the Park Grass surface soils deviated considerably from Equation (4). We decided to use
13
C-NMR to see if these deviations were caused by coal con-tamination, using two Park Grass surface soils. Data from the first (taken in 1999 from the limed section of the unfertilized treatment, containing 3.54% C; see Table 2) fell close to the line on Figure 1, suggesting it contained little if any coal, whereas the other (taken in 1906 from the fertilized unlimed treatment, containing 3.25% C) fell far below this line, sug-gesting that it contained a considerable amount of coal. From the height of the aromatic band at ca. 127 p.p.m. (after nor-malising all the runs to give the same ratio (height of carbonyl band atc. 173 p.p.m.)/(% soil organic C)) we calculated that the contaminated sample contained 0.82% coal C. The arrow on Figure 1 shows the data for the putative contaminated soil before and after deducting coal C. This observation, that deducting coal C in this way returned the sample point to just below the line on Figure 1, confirms our view that coal is the reason why some of the Park Grass 0–23 cm samples fell markedly below this line.
A rough estimate of the amount of coal-free organic carbon in the 0–23 cm layer of the Park Grass samples was made as fol-lows. The difference between the value ofD14C as measured for
each individual sample and as given by Equation (4) was cal-culated. The concentration of coal was calculated for each sample of topsoil by relating this difference to that in the con-taminated sample containing 0.82% coal. The 0–23 cm layer of all the pre-bomb Park Grass samples contained 69.0 t coal-free organic C ha1: the corresponding mean for all of the 1999 samples was 75.2 t ha1(Table 3: in square brackets).
Data aggregation
Table 3 presents a summary of pre- and post-bomb organic C and radiocarbon for these Rothamsted Long-Term Experi-ments, calculated from the mass of data in Tables 1 and 2. Data from the part of Geescroft Wilderness that once received P have been meaned with the corresponding data from the part that never received P; no differences have yet been observed between the two parts (Jenkinson, 1971; Poultonet al., 2003).
The ‘pre-bomb’ data in Table 3 are means of measurements on samples taken between 1881 and 1906. This was done to obtain some measure of sampling variation, assuming that all belonged to a single population. The individual measurements in Table 1 suggest that this is not an unreasonable assumption, bearing in mind the paucity of data. However, it should be noted that many of the standard errors forD14Cein Table 3 are based
on only two replicates and are therefore themselves subject to large error.
The samples taken in 1999 from Geescroft Wilderness, Broad-balk Wilderness and BroadBroad-balk Arable contained more organic C than the corresponding pre- bomb sampling, all the way down the profile (Table 3). However,ttests comparing the C content of each layer sampled in 1999 with the C content of the corre-sponding pre-bomb layer showed that these differences were seldom significant (P < 0.05, here and subsequently), apart from the surface layers. Carbon gains in the woodland sites are discussed in detail by Poultonet al.(2003). The 1999 sam-ples from Geescroft Wilderness, Broadbalk Wilderness and Broadbalk Arable all contained more radiocarbon than the corresponding pre-bomb sample (with one exception, the 23– 46 cm layer from Broadbalk Arable), although, apart from the surface layer, none of the differences reached significance (Table 3). One of the two 0–23 cm samples taken in 1999 from Broadbalk Arable was much older than the other (D14C
e 116.7&, compared with38.2&; Table 1), making the cor-responding standard errors in Table 3 very large. The great age of this sample (957 years) is out of line with the 1977 sam-pling of the same plot (Jenkinson et al., 1992). We have no explanation for this discrepancy.
so years in Park Grass. However, if changes in coal content are factored in, there was a small C gain in the 0–23 cm layer over the experimental period. Each of the lower layers contained a little more organic C when sampled in 1999 (Table 3) than in the corresponding layer of the pre-bomb profile, although only a few of the gains in the deeper layers reached significance (P<0.05). It is possible that soil organic C on Park Grass had not yet reached equilibrium by the end of the 19th century – the site had once been cultivated and was not under continu-ous grass until 1700 – or earlier. The aggregated 1999 samples from Park Grass contained significantly more radiocarbon than the corresponding pre-bomb samples, all the way down the profile (Table 3).
Acknowledgements
We thank N. Mahieu and E. W. Randall for the 13C-NMR measurements, D. D Harkness for help and advice on the radiocarbon measurements and A. Todd for statistical advice. M. V. Hewitt, G. Denton and S. Francis helped with sampling and analysis. Rothamsted Research receives grant-aided sup-port from the UK Biotechnology and Biological Sciences Research Council; the Lawes Agricultural Trust also provided support. The Radiocarbon Laboratory at East Kilbride is sup-ported by the Natural Environment Research Council.
References
Avery, B.W. & Catt, J.A. 1995.The Soil at Rothamsted. Lawes Agri-cultural Trust, Harpenden, UK.
Blake, L., Goulding, K.W.T., Mott, C.J.B. & Poulton, P.R. 2000. Temporal changes in chemical properties of air-dried stored soils and their interpretation for long-term experiments.European Jour-nal of Soil Science,51,345–353.
Bolton, J. 1977. Changes in magnesium and calcium in soils of the Broadbalk Wheat Experiment at Rothamsted from 1856 to 1966. Journal of Agricultural Science (Cambridge),79,217–223.
Boutton, T.W. 1996. Stable carbon ratios of soil organic matter and their use as indicators of vegetation and climate. In: Mass Spec-trometry of Soils(eds T.W. Boutton & S.I. Yamasaki), pp. 47–81, Marcel Dekker, New York.
Boutton, T.W., Wong, W.W., Hachey, D.L., Lee, L.S., Cabrera, M.P. & Klein, P.D. 1983. Comparison of quartz and pyrex tubes for combustion of organic samples for stable carbon isotope analy-sis.Analytical Chemistry,55,1832–1833.
Bremner, J.M. 1959. Determination of fixed ammonium in soil. Jour-nal of Agricultural Science,52,147–160.
Castellazzi, M.C., Brookes, P.C. & Jenkinson, D.S. 2004. Distribu-tion of microbial biomass down soil profiles under regenerating woodland.Soil Biology and Biochemistry,36,1485–1489.
Dictor, M.-C., Tessier, L. & Soulas, G. 1998. Reassessement of the KECcoefficient of the fumigation-extraction method in a soil
pro-file.Soil Biology and Biochemistry,30,119–127.
Dixon, W.T. 1982. Spinning-sideband-free and spinning-sideband-only NMR spectra in spinning samples.Journal of Chemical Phys-ics,77,1800–1809.
Donahue, D.J. 1995. Radiocarbon analysis by accelerator mass spec-trometry. International Journal of Mass Spectrometry and Ion Pro-cesses,143,235–245.
Dyer, B. 1902. Results of investigations on the Rothamsted soils. U.S.D.A. Office Experiment Station Bulletin,106,1–190.
Fierer, N., Schimel, J.P. & Holden, P.A., 2003. Variations in micro-bial community composition through two soil depth profiles.Soil Biology and Biochemistry,35,167–176.
Friedlingstein, P., Bopp, L., Ciais, P., Dufresne, J., Fairhead, L., LeTreut, H. et al. 2001. Positive feedback between future climate change and the carbon cycle.Geophysical Research Letters,28,1543–1546. Gifford, R.M. & Roderick, M.L. 2003. Soil carbon stocks and bulk
density: spatial or cumulative mass coordinates as a basis of expression?Global Change Biology,9,1507–1514.
Jenkinson, D.S. 1971.The Accumulation of Organic Matter in Soil Left Uncultivated. Rothamsted Experimental Station Report for 1970, Part 2. pp. 113–137. Lawes Agricultural Trust, Harpenden, UK. Jenkinson, D.S. & Rayner, J.H. 1977. The turnover of organic matter
in some of the Rothamsted Classical Experiments. Soil Science,
123,298–305.
Jenkinson, D.S., Adams, D.E. & Wild, A. 1991. Model estimates of CO2 emissions from soil in response to global warming. Nature, 351,304–306.
Jenkinson, D.S., Harkness, D.D., Vance, E.D., Adams, D.E. & Harri-son, A.F. 1992 Calculating net primary production and annual input of organic matter to soil from the amount and radiocarbon content of soil organic matter.Soil Biology and Biochemistry,24,295–308. Jobba´gy, E.G. & Jackson, R.B. 2000. The vertical distribution of soil
organic carbon and its relation to climate and vegetation. Ecologi-cal Applications,10,423–436.
Johnston, A.E. 1972.Changes in Soil Properties Caused by the New Liming Scheme on Park Grass. Rothamsted Experimental Station Report for 1971, Part 2. pp. 177–180. Lawes Agricultural Trust, Harpenden, UK.
Jones, C., McConnell, C., Coleman, K., Cox, P., Falloon, P., Jenkin-son, D.et al. 2005. Global climate change and soil carbon stocks; predictions from two contrasting models for the turnover of organic carbon in soil.Global Change Biology,11,154–166. Kirschbaum, M.U.F. 2000. Will changes in soil organic carbon act as
a positive or negative feedback on global warming? Bio-geochemistry,48,21–51.
Knorr, W., Prentice, I.C., House, J.I. & Holland, E.A. 2005. Long-term sensitivity of soil carbon turnover to warming.Nature,433,298–301. Krull, E.S. & Skjemstad, J.O. 2003.d13C andd15N profiles in14
C-dated Oxisol and Vertisols as a function of soil chemistry and min-eralogy.Geoderma,112,1–29.
Lal, R. & Kimble, J.M. 2000. Tropical ecosystems and the global C cycle. In: Global Climate Change and Tropical Ecosystems(eds R. Lal, J.M. Kimble & B.A. Stewart), pp. 3–32. CRC Press, Boca Raton, FL, USA.
Paul, E.A., Collins, H.P. & Leavitt, S.W. 2001. Dynamics of resistant soil carbon of Midwestern agricultural soils measured by naturally occurring14C abundance.
Geoderma,104,239–256.
measurements in Brazilian soils developed on basic rocks. Radio-carbon,38,203–208.
Poulton, P.R. 2006. Guide to the Classical and Other Long-Term Experiments, Data Sets and Sample Archive. Lawes Agricultural Trust Co. Ltd, Harpenden, UK.
Poulton, P.R., Pye, E., Hargreaves, P.R. & Jenkinson, D.S. 2003. Accumulation of carbon and nitrogen by old arable land reverting to woodland.Global Change Biology,9,942–955.
Prentice, I.C. 2001. The carbon cycle and atmospheric carbon dioxide. In:Climate Change 2001:The Scientific Basis, (ed. J.T. Houghton) pp. 183–237. Intergovernmental Panel on Climate Change. Cambridge University Press, Cambridge.
Rumpel, C., Balesdent, J., Grootes, P., Weber, E. & Ko¨gel-Knabner, I. 2003. Quantification of lignite- and vegetation-derived soil car-bon using14C activity measurements in a forested chronosequence.
Geoderma,112,155–166.
Scharpenseel, H.W. & Becker-Heidmann, P. 1989. Shifts in 14C
patterns of soil profiles due to bomb carbon, including effects of morphogenetic and turbation processes.Radiocarbon, 31,627– 636.
Slota, P.J., Jull, A.J.T., Linick, T.W. & Toolin, L.J. 1987. Prepara-tion of small samples for14C accelerator targets by catalytic
reduc-tion of CO2.Radiocarbon,29,303–306.
Stuiver, M. & Polach, H. 1977. Discussion: reporting of 14C data.
Radiocarbon,19,355–363.
Torn, M.S., Lapenis, A.G., Timofeev, A., Fischer, M.L., Babikov, B.V. & Harden, J.W. 2002. Organic carbon and carbon isotopes in modern and 100-year-old-soil archives of the Russian steppe. Global Change Biology,8,941–953.