www.ijper.org
Development and Evaluation of Internal and External
Predictability of Metoclopramide Hydrochloride
Modified Release Formulations: An Establishment of
Level A
In vitro
and
In vivo
Correlation
Ramesh Narayanasamy1*, Ramakrishna Shabaraya1
1Department of Pharmaceutics, Srinivas College of Pharmacy, Farengipete Post, Mangalore- 574143, Karnataka, INDIA.
ABSTRACT
The objective of this study was to develop an in vitro–in vivo correlation (IVIVC) model for hydrophilic matrix sustained-release (SR) Metoclopramide formulations. The in vitro release characteristics of the drug were determined using USP apparatus II at 50 rpm, pH 6.8. In vivo plasma concentrations and pharmacokinetic parameters in healthy human subjects were obtained after administering oral dose, developed SR formulations and marketed immediate-release (IR) products. The similarity factor f2 was used to compare the dissolution data. The IVIVC model was developed using pooled fraction dissolved and fraction absorbed of developed SR formulations i.e. fast, medium and slow release and marketed immediate-release (IR) products. An in vitro-in vivo correlation (IVIVC) was established for sustained release tablet by deconvolution using data from an immediate-release treatment as the characteristic response. To assess the correlation between in vitro dissolution uniqueness and in vivo absorption performance of Metoclopramide sustained release (SR) and immediate release (IR) tablet in human subjects. The established IVIVC was evaluated internally by predicting data used to develop and externally by predicting data not originally included in developing the IVIVC model. The observed low prediction errors for Cmax and AUC demonstrated that the Metoclopramide IVIVC model was valid.
Keywords: Metoclopramide Hydrochloride, Modified Release, Level A Correlation, Internal
And External Prediction Errors.
DOI: 10.5530/ijper.51.2s.45
Correspondence:
Ramesh N, Department of Pharmaceutics Srinivas College of Pharmacy, Faren-gipete Post, Mangalore, Karnataka - 574143, INDIA Ph: + 91 824 2232700 Fax: + 91 824 2274725 E mail: ramesh7779@gmail. com
INTRODUCTION
In vitro in vivo correlation is a predictive
mathematical model describing the relation-ship between the in vitro property of dosage form and in vivo response. In vitro property is a rate of drug release and in vivo response is the amount of drug absorbed. In vitroin vivo
correlation plays a vital role in the early stage of product development, substitute for in vivo bioavailability and to support biowaivers, to facilitate scale-up and post approval
changes, and to set significant dissolution specifications. In vitro in vivo correlation is established to facilitate dissolution test to be used as surrogacy for bio study and it
benefit the pharmaceutical manufacturer in
Submission Date: 01-02-2017;
Revision Date: 03-03-2017;
Accepted Date: 18-03-2017
terms of time and cost on bioequivalence study.7-10
In vitroin vivo correlation models will be useful for optimizing the SR (sustained release) dosage forms, otherwise predict in vivo performance of the SR dosage forms based on in vitro dissolution data. The FDA
guidance has identified three In vitroin vivo correlation models: namely, level A, B, and C models.6 Numerous investigations have
been undertaken to develop In vitro in vivo
correlation models, a level A correlation utilize the complete time course of in vitro
setting of dissolution specifications.7-16 However, level
B and C models may be used in the initial stages of formulation development to inspect level A In vitro
in vivo correlation models shall be used.6
The present work aim was to develop and establish the internal and external predictability of level A In vitroin vivo correlation models for the three Metoclopramide sustained release and one immediate release formu-lation were evaluated. The rationale behind the study was develop Metoclopramide In vitro in vivo correlation models, so that it can serve as a surrogate for in vivo bioavailability and to support biowaivers and which in turn reduce the cost of the optimization process.
MATERIALS AND METHODS Chemicals and Reagents
Metoclopramide Hydrochloride & Cisapride were supplied by Adcock Ingram Healthcare Pvt. Ltd. (Bangalore, India). The HPMCK100M supplied by Colorcon Asia Pvt Ltd. (Goa, India). Avicel, Magnesium stearate and talc were procured from local supplier.
Formulation of Tablets
Sustained release formulations, each tablet containing 10 mg of Metoclopramide hydrochloride, prepared by weighing the amount of active ingredients, polymers (HPMC), avicel magnesium stearate and talc in different ratio and blended to get homogeneous mixture. Tablets were prepared by direct compression on a single punch
machine (10 mm bi-flat round shaped punches). The
Metoclopramide hydrochloride formulations were prepared at three different release rates i.e. fast, medium and slow sustained release tablets.1-3
In vitro release studies
The dissolution performance of Metoclopramide hydrochloride determined by using a USP dissolution apparatus 2 (paddle method). The release studies were performed in pH 1.2, 4.5, 5.5, 6.8, 7.4 (900 ml) at 37.0 ± 0.5 °C and a rotation speed of paddle was 50 & 75 rpm. Samples (5 ml) were collected at 0.0, 0.5, 1.0, 1.5, 2.0, 3.0, 4.0, 6.0, 8.0, 12.0, 18.0 and 24.0 hours. and replaced with fresh medium at various interval times. The amount of released Metoclopramide hydrochloride was analyzed by using UV-Visible spectrophotometric at a wavelength of 309 nm.
Clinical pharmacokinetic study
This was an open-label, single dose, four-treatment crossover study by using six healthy volunteers under fasting condition. Subjects were given informed consent prior to participation and study was approved by the
ethics committee. Subjects randomly allocated treatment as per the randomization schedule, such a way all subjects would receive four formulations upon completion of the study. Blood samples were collected at predeter-mined time 0.0, 0.33, 0.67, 1.0, 1.33, 1.67, 2.0, 3.0, 4.0, 6.0, 8.0, 10.0, 12.0, 16.0, 18.0 and 24.00 hours post-dose. Washout period of at least 07 days between dosage.4
Plasma samples were stored in an upright position below -20°C till completion of analysis. Plasma samples were estimated for Metoclopramide by using a validated LCMS/MS with liquid liquid extraction method. Chro-matographic separation achieved on a Eclipse XDB C18 (100 mm x 4.6 mm, 3.5 µm) column using a mobile phase consisting of methanol and ammonium acetate buffer 5 mM (50:50 v/v). The RT of Metoclopramide hydrochloride and internal standard was 1.1 and 2.1 minutes. The method was validated over a concentration range of 0.532 ng/mL to 201.005 ng/mL for Meto-clopramide. The lower limit of quantization (LLLQ) was established at 0.532 ng/mL for Metoclopramide. Plasma sample analysis were performed by using a vali-dated high performance liquid chromatography mass spectrometric method.5
Dissolution data analysis
The in vitro drug release was calculated by using similarity factor (f2) and dissolution profile of all formulations
were determined by scheming the cumulative percent of Metoclopramide hydrochloride versus time. The in-vitro
drug release profile of the three SR formulations were
compared using the similarity factor (f2) as mentioned in the following equation:
− = + ∑ − × = 0.5 2 t n
f 2 50log 1 1/ n (Rt T ) 100 t 1
(Equation 1)
where Rt and Tt are the percent dissolved at each time point for the reference and test product respectively. The f2 equation is a logarithmic transformation of the sum of squares of the difference between test and reference formulation. The f2 average difference between 0 and 100. If the value of f2 is less than 50 dissolution profiles
wee considered dissimilar. If f2 value 50 suggests that the reference and test product release curves differ by at least 10% and f2 values greater than 50 (between 50 and 100) make sure similarity or uniformity between two
dissolution profiles. The percent drug dissolved versus
time calculated by using weibull method.
Clinical pharmacokinetic data analysis
concentration observed for the subject was Cmax and time to take place was Tmax. Area under the plasma
concentration-time profile estimated by the trapezoidal
method. The rate constant (K) describing the terminal
slope of mean plasma concentration- time profile was determined by linear least squares fitting of the natural
logarithm (Ln) transformed terminal plasma concen-trations vs. time to the equation for a straight line. The elimination rate constant was estimated by linear regression of linear portion of logarithm of the concen-trations versus time. The percent of drug absorbed versus time estimated by using deconvolution technique.
In vitro In vivo Correlation
Level A correlation was developed as mentioned in the FDA and USP guidelines by using the data obtained in
the in vivo study. The percent of drug dissolved was
estimated by plotting time points against the drug release
profile and the fraction of drug absorbed was derived by
using Wagner–Nelson method. Linear regression analysis was used to inspect the relationship between percent of drug dissolved and percent of drug absorbed. The correlation developed by using in vitro and in vivo data.
IVIVC Model validation
The objective is to validate the prediction of in vivo performance from in vitro data. The validation explain how well the developed IVIVC model predicts the
in vivo data when in vitro data applied. The percentage
prediction error of Cmax and AUC estimated by using equation mentioned below:
−
= ×
C max
observed predicted
% PE 100
observed
Internal validation includes the cross validation of one formulation with other three formulation used for IVIVC model development. Internal validation is optional for IVIVC analysis and provides base for the suitability of the model. and external validation is based on how good IVIVC predicts the additional set of data. As described on FDA guidance IVIVC model is valid when the internal predictability (absolute PE) of Cmax and AUC for each formulation should not exceed 15% and with the average should not exceed 10% (percent-age), and for external validation the prediction errors of Cmax and AUC should not exceed 10% and values between 10% to 20% and more than20% is not acceptable.
RESULTS In vitro studies
The in vitro drug release studies were conducted at different pH conditions (namely pH 1.2, 4.5, 5.5, 6.8, 7.4) to
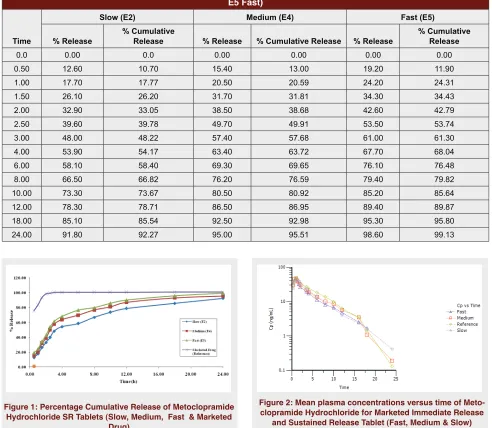
check the release and to select the optimum pH condi-tion for the drug. The percentage fraccondi-tion dissolved for Metoclopramide hydrochloride of marketed immediate release, fast, medium and slow sustained release tablets and percentage drug release at different time points are presented in Table 1 &Figure 1.
DISCUSSION
In vitro and in vivo studies were performed for the devel-oped sustained release formulation i.e. fast, medium and slow sustained release tablets. Dissolution studies were performed at pH 1.2 for 50 rpm, the release of the drug
was unfinished and showed maximum up to 31.98%,
pH 4.5 at 50 rpm, the drug release was slow over the last time point and maximum release up to 85.64% pH 5.5 at 50 rpm drug release was homogeneous and observed 94.50-99.23% over 24 hours, pH 6.8 and pH 7.4 at 50 rpm, drug released up to 91.08-95.21% and 89.57-90.47%. To check rpm effect dissolution tests performed at pH 1.2 , pH 4.5, pH 5.5, pH 6.8 and pH 7.4 at 75 rpm not much variations observed. Therefore for pH 5.5 at 50 rpm formulation optimized as slow, medium and fast release. The in vitro release character-istics Metoclopramide hydrochloride Sustained Release formulations were determined and the percentage drug release at various time intervals. The optimized formu-lation at pH 5.5 were reformulated i.e. Metoclopramide hydrochloride SR Tablets (Slow, Medium & Fast) and dissolution test performed for test and reference formu-lation at pH 6.8 as per the USP method. The percentage fraction dissolved for Metoclopramide hydrochloride are in the rank order of marketed immediate release, fast, medium and slow sustained release tablets and percentage drug release at different time points are presented in Table 1 & Figure 1. The f2 values are calculated for fast versus slow f2 value is 47.12 at the borderline, fast versus medium and medium versus slow
formulation observed higher than 50 confirms and for
formulation that these dissolution mediums are indistin-guishable and ensures sameness or equivalence between
the two dissolution profiles.
The mean Metoclopramide pharmacokinetic parameters AUClast and AUCINF_obs were reasonably higher for marketed release tablet compare to the test formulation. Followed by lower elimination rate and higher half life for fast and medium release observed compare to slow release and marketed tablet. The mean pharmacokinetic results are presented in Figure 2 and Table 2.
A Level A correlation was developed by building IVIVC plot using percent dissolved versus percent absorbed for
Table 2: Mean Pharmacokinetic Parameter of Metoclopramide Hydrochloride for Marketed Immediate Release and Sustained Release Tablet (Fast, Medium & Slow)
Formulation Kel (1/hr) Half life (hr) Tmax (hr) (ug/mL)Cmax (hr*ug/mL)AUClast AUCINF_obs (hr*ug/mL)
Immediate Release Tablet 0.195 3.587 1.11 49.06 267.393 273.694
Fast Sustained Release Tablet 0.186 3.749 0.89 48.433 205.467 214.506
Medium Sustained Release Tablet 0.199 3.729 0.89 48.004 230.418 238.671
Slow Sustained Release Tablet 0.221 3.564 1.00 48.366 222.996 230.834
Table 1: Percentage Cumulative Release of Metoclopramide Hydrochloride SR Tablets (E2 Slow, E4 Medium & E5 Fast)
Time
Slow (E2) Medium (E4) Fast (E5)
% Release % Cumulative Release % Release % Cumulative Release % Release % Cumulative Release
0.0 0.00 0.0 0.00 0.00 0.00 0.00
0.50 12.60 10.70 15.40 13.00 19.20 11.90
1.00 17.70 17.77 20.50 20.59 24.20 24.31
1.50 26.10 26.20 31.70 31.81 34.30 34.43
2.00 32.90 33.05 38.50 38.68 42.60 42.79
2.50 39.60 39.78 49.70 49.91 53.50 53.74
3.00 48.00 48.22 57.40 57.68 61.00 61.30
4.00 53.90 54.17 63.40 63.72 67.70 68.04
6.00 58.10 58.40 69.30 69.65 76.10 76.48
8.00 66.50 66.82 76.20 76.59 79.40 79.82
10.00 73.30 73.67 80.50 80.92 85.20 85.64
12.00 78.30 78.71 86.50 86.95 89.40 89.87
18.00 85.10 85.54 92.50 92.98 95.30 95.80
24.00 91.80 92.27 95.00 95.51 98.60 99.13
observed for percentage of drug dissolved and the
per-centage of drug absorbed. The correlation coefficient
(r2) for was 0.9025, 0.8905 and 0.8685 are presented in
Figure 3, 4 and 5 respectively. A good linear regression relationship was observed.
IVIVC Validation
The percentage prediction errors for Cmax and AUC were calculated by using marketed Metoclopramide hydro-chloride immediate release tablets as a target formulation. The Cmax prediction errors for the fast, medium and slow
Figure 1: Percentage Cumulative Release of Metoclopramide Hydrochloride SR Tablets (Slow, Medium, Fast & Marketed
Drug)
Figure 2: Mean plasma concentrations versus time of Meto-clopramide Hydrochloride for Marketed Immediate Release
formulations were found to be -12.356%, -16.049% and -24.612% respectively and AUC values were -22.484%, 7.461% and 7.349% for respectively refer Table 3. The Cmax prediction errors prediction errors for Meto-clopramide hydrochloride SR tablets i.e. fast, medium, slow and marketed immediate release formulations were estimated and results are observed -56.178, -58.401, -62.407 and 3.349, respectively and for AUC values are -38.758, -40.158, -41.836 and -27.405 respectively. The
study was conducted to examine, Level A IVIVC relating the complete time-course of plasma concentrations was developed and validated internally and externally for Metoclopramide hydrochloride formulation i.e. fast, medium and slow SR tablets and marketed immediate release tablet. The validation of internal and external predictability was successfully accomplished. The predic-tion error for Cmax and AUC was within the specified
limit as per the FDA guidance hence, the IVIVC is well thought-out as validated both in terms of internal and external validation. Thus, this IVIVC model may be used during process change, site change, to reduce the number of human studies during the formulation development and serve as a surrogate for in vivo bioavailability, to support biowaivers, to support
dis-solution methods and specification settings. It can also
assist in quality control for during the scale-up and post-approval changes (SUPAC).
CONCLUSION
The developed in vitro methods can act as a surrogate for
in vivo bioavailability study and support biowaivers, assist in quality control during scale-up and post-approval changes. It may be useful in predicting the variation in site change, process changes and to predict the absorp-tion performance of Metoclopramide Hydrochloride products with different release rates.
ACKNOWLEDGEMENT
The authors would like to thank Srinivas College of Pharmacy, Sequent Research Limited & Adcock Ingram Healthcare Pvt. Ltd. (Bangalore, India), Colorcon Asia Pvt Limited, India and Phoenix Winnonlin Certara software Hyderabad, India for granting support to carry out the work for providing required facilities to carry out this research work.
Table 3: Prediction errors (%) associated with Cmax and AUC for Metoclopramide Hydrochloride Fast,
Medium and Slow SR Tablets
Formulation Parameter %PE
Fast Internal AUClast -22.484
Fast Internal Cmax -12.356
Medium Internal AUClast 7.461
Medium Internal Cmax -16.049
Slow Internal AUClast 7.349
Slow Internal Cmax -24.612
Figure 3: IVIVC Model Linear Regression Percentage Dissolved and Percentage Absorbed for Metoclopramide
Hydrochloride and Slow SR Tablet
Figure 4: IVIVC Model Linear Regression Percentage Dissolved and Percentage Absorbed for Metoclopramide
Hydrochloride Fast and Medium SR Tablet
Figure 5: IVIVC Model Linear Regression Percentage Dissolved and Percentage Absorbed for Metoclopramide
CONFLICT OF INTEREST
The authors confirm that this article content has no conflict of interest.
ABBREVIATION USED
nm: Nanometer, Liquid chromatography with tan-dem mass spectrometry (LC-MS-MS); °C: Degree Celsius; ml: Milliliter; ng/mL: Nanogram/milliliter; HPMC: Hydroxypropyl methylcellulose; mm: Millime-ter; USP: United State of Pharmacopeia: FDA: Food and Drug Administration; Cmax: Maximum plasma concentration; Tmax: Time of the maximum plasma concentration; AUClast: Area under the plasma con-centration-time curve from time zero to the time of the
last quantifiable concentration; AUC INF_obs: Area under the plasma concentration-time curve from time
zero extrapolated to the infinite time; Kel: Elimination rate constant; %: Percentage.
REFERENCES
1. Hamed E, Sakr A. Application of multiple response optimization technique to extended release formulations design. J. Control Release. 2001;73(2):329-38. https://doi.org/10.1016/S0168-3659(01)00356-X.
2. Sayed IAR, Gamal MM, Mahmoud BE. Preparation and comparative evaluation of sustained release Metoclopramide hydrochloride matrix tablets. Saudi Pharmaceutical Journal. 2009;S17(4):283-8.
3. Hasan EI, Amro BI, Arafat T, Badwan AA. Assessment of controlled release of hydrophilic matrix formulation for Metoclopramide Hydrochloric acid. Eur. J. Pharm. Biopharm. 2003;S55(3):339–44. https://doi.org/10.1016/S0939-6411(03)00022-5.
4. Yan M, Li HD, Chen BM, Liu XL, Zhu YG. Determination of metoclopramide in human plasma by LC-ESI-MS and its application to bioequivalance studies. J Chromatogr B AnalytTechnol Biomed Life Sci. 2010;878(11-12):883-7. https://doi.org/10.1016/j.jchromb.2010.02.006; PMid:20189472.
5. Jaswanth KI, Rajasekhar D, Ramesh M, Venkateswarlu P. Sensitive and selective liquid chromatography–tandem mass spectrometry method for
the determination of Metoclopramide in human plasma: application to a bioequivalence study. Biomed. Chromatogr. 2010;24:1006–14.
6. Food and Drug Administration. 1997. Guidance for industry, extended release oral dosage forms: Development, evaluation, and application of in vitro/ in vivo correlations.
7. Takka S, Sakr A, Goldberg A. Development and Validation of an In vitro– In vivo Correlation for Buspirone Hydrochloride Extended Release Tablets. Journal of Controlled Release.2003;88(1):147–57. https://doi.org/10.1016/ S0168-3659(02)00490-X.
8. Eddington ND, Ashraf M, Augsburger LL. Identification of formulation and manufacturing variables that influence in vitro dissolution and in vivo bioavailability of propranolol hydrochloride tablets. Pharm Dev Technol 1998;3(4):535-47. https://doi.org/10.3109/10837459809028636; PMid:9834957
9. Hayes S, Dunne A, Smart T. Interpretation and optimization of the dissolution specifications for a modified release product with an in vivo-in vitro correlation (IVIVC). J Pharm Sci 2004;93(3):571-81. https://doi.org/10.1002/jps.10552; PMid:14762896
10. Emami J. In vitro-in vivo correlation: from theory to applications. J Pharm Pharm Sci 2006;9(2):169-89. PMid:16959187.
11. Mahayni H, Rekhi GS, Uppoor RS. Evaluation of “external” predictability of an in vitro-in vivo correlation for an extended-release formulation containing metoprolol tartrate. J Pharm Sci 2000;89(10):1354-61. https://doi. org/10.1002/1520-6017(200010)89:10<1354::AID-JPS13>3.0.CO;2-P. 12. Mandal U, Ray KK, Gowda V. In-vitro and in-vivo correlation for two gliclazide
extended-release tablets. J Pharm Pharmacol 2007;59(7):971-6. https://doi. org/10.1211/jpp.59.7.0009; PMid:17637192.
13. Sirisuth N, Eddington ND. The influence of first pass metabolism on the development and validation of an IVIVC for metoprolol extended release tablets. Eur J Pharm Biopharm 2002;53(3):301-9. https://doi.org/10.1016/ S0939-6411(01)00248-X.
14. Huang YB, Tsai YH, Yang WC, et al. Once-daily propranolol extended-release tablet dosage form: formulation design and in vitro/in vivo investigation. Eur J Pharm Biopharm. 2004;58(3):607-14. https://doi.org/10.1016/j. ejpb.2004.03.037; PMid:15451535.
15. Dutta S, Qiu Y, Samara E, et al. Once-a-day extended-release dosage form of divalproex sodium III: development and validation of a Level A in vitro-in vivo correlation (IVIVC). J Pharm Sci 2005;94(9):1949-56. https://doi. org/10.1002/jps.20387; PMid:16052544.
16. 16. Jolly MS, Mayur GS, Rajashree CM. Drug release and swelling kinetics of directly compressed glipizide sustained-release matrices: Establishment of level A IVIVC. Journal of Controlled Release. 2008;129(1):49-58. https:// doi.org/10.1016/j.jconrel.2008.03.016; PMid:18456362
• Level A in vitro and in vivo correlation was developed by comparing percent dissolved versus the percent absorbed of Metoclopramide Hydrochloride fast, medium and slow sustained release and marketed immediate release tablets.
• In vitro and in vivo correlation can be used in the development of new drug to decrease the number of human studies during the formulation development and optimization.
Ramesh. N: Research Scholar in Department of Pharmaceutics, Srinivas College of Pharmacy, Mangalore, India.
Dr. A. R. Shabaraya: Principal and Director, Srinivas College of Pharmacy, Mangalore, India. About Authors
Cite this article: Ramesh N, Shabaraya R. Development and Evaluation of Internal and External Predictability of
Metoclopramide Hydrochloride Modified Release Formulations: An Establishment of Level A In vitro and In vivo