R E S E A R C H
Open Access
An Assessment of Fixed and Native
Chromatin Preparation Methods to Study
Histone Post-Translational Modifications at
a Whole Genome Scale in Skeletal Muscle
Tissue
Sarah-Anne David
1, Benoît Piégu
2, Christelle Hennequet-Antier
1, Maëlle Pannetier
3, Tiphaine Aguirre-Lavin
3,
Sabine Crochet
1, Thierry Bordeau
1, Nathalie Couroussé
1, Aurélien Brionne
1, Yves Bigot
2, Anne Collin
1and Vincent Coustham
1*Abstract
Background:Genomic loci associated with histone marks are typically analyzed by immunoprecipitation of the chromatin followed by quantitative-PCR (ChIP-qPCR) or high throughput sequencing (ChIP-seq). Chromatin can be either cross-linked (X-ChIP) or used in the native state (N-ChIP). Cross-linking of DNA and proteins helps stabilizing their interactions before analysis. Despite X-ChIP is the most commonly used method, muscle tissue fixation is known to be relatively inefficient. Moreover, no protocol described a simple and reliable preparation of skeletal muscle chromatin of sufficient quality for subsequent high-throughput sequencing. Here we aimed to set-up and compare both chromatin preparation methods for a genome-wide analysis of H3K27me3, a broad-peak histone mark, using chickenP. majormuscle tissue.
Results:Fixed and unfixed chromatin were prepared from chicken muscle tissues (Pectoralis major). Chromatin fixation, shearing by sonication or digestion and immunoprecipitation performed equivalently. High-quality Illumina reads were obtained (q30 > 93%). The bioinformatic analysis of the data was performed using epic, a tool based on SICER, and MACS2. Forty millions of reads were analyzed for both X-ChIP-seq and N-ChIP-seq experiments.
Surprisingly, H3K27me3 X-ChIP-seq analysis led to the identification of only 2000 enriched regions compared to about 15,000 regions identified in the case of N-ChIP-seq. N-ChIP-seq peaks were more consistent between replicates compared to X-ChIP-seq. Higher N-ChIP-seq enrichments were confirmed by ChIP-qPCR at thePAX5and SOX2loci known to be enriched for H3K27me3 in myotubes and at the loci of common regions of enrichment identified in this study.
Conclusions:Our findings suggest that the preparation of muscle chromatin for ChIP-seq in cross-linked conditions can compromise the systematic analysis of broad histone marks. Therefore, native chromatin preparation should be preferred to cross-linking when a ChIP experiment has to be performed on skeletal muscle tissue, particularly when a broad source signal is considered.
Keywords:Epigenetics, Histone post-translational modifications, Chromatin immunoprecipitation, Cross-linking, Native, Skeletal muscle
* Correspondence:vincent.coustham@inra.fr 1URA, INRA, 37380 Nouzilly, France
Full list of author information is available at the end of the article
Background
Histone post-translational modifications (HPTM) such as methylation and acetylation of lysine residues are widely studied epigenetic marks. The genomic distribu-tion of histone marks is commonly analyzed by immu-noprecipitation (IP) of the chromatin using HPTM-specific antibodies, followed by quantitative PCR (ChIP-qPCR) or high throughput sequencing (ChIP-seq). Two main methods exist to perform IP either based on cross-linking (X-ChIP) or native (N-ChIP) chromatin prepar-ation. X-ChIP is the most common technique and con-sists in a covalent fixation of the interactions between proteins and DNA using cross-linking reagents such as formaldehyde. N-ChIP is based on unfixed chromatin and therefore requires stable interactions between DNA and proteins such as histones [1].
HPTM were shown to affect gene expression by alter-ing the chromatin accessibility to the transcriptional
ma-chinery [2]. Recent advances in genome-wide
sequencing technologies enabled systematic mapping of histone marks in a large range of tissues leading to an improved understanding of the interplay between his-tone marks and their functions [3]. However, whole gen-ome analysis of epigenetic modifications can still be challenging due to their various distribution on the gen-ome. HPTM signals are mostly categorized to either nar-row peaks (highly localized signals, such as H3K4me3) or broad peaks (spanning large genomic domains, such as H3K27me3 or H3K36me3) [4, 5]. Broad peak marks such as the trimethylation of the lysine 27 on the histone H3 (H3K27me3) tend to display flatter cross-correlation profiles than narrow peaks that complicates their ana-lysis [6]. Therefore, it was recommended to maximize site discovery by optimizing IP and sequencing deeply, within reasonable expense constraint [6].
Skeletal muscles are complex heterogeneous tissues formed by the association of several types of fibers and to a lesser extent of undifferentiated satellite cells. Muscle fibers are poly-nucleated cells and their nuclei are embedded in actin/myosin filaments that ensure the contractility of this organ for voluntary movement and skeleton support [7]. Due to its nature, cross-linking of skeletal muscle tissue was reported to be relatively ineffi-cient compared to most other tissues [8]. It was sug-gested that the myofiber structure may act as a physical barrier that limits the access of the cross-linking reagent to the nuclei. A muscle relaxation treatment right after sampling was recently proposed to improve nuclei acces-sibility to the fixation reagent [9, 10]. Another study re-ported an enzymatic digestion method to separate mature myofibers from satellite cells allowing simultan-eous preparation of chromatin of nuclei from both cell types [8]. However, this labor-intensive protocol required several steps before fixation including the digestion and
separation of the cells that may ultimately alter chroma-tin integrity. N-ChIP on the contrary could overcome the issue of crosslinking incompatibilities of the muscle tissue as it is based on native, unfixed, chromatin. How-ever N-ChIP is not suitable to study proteins that are not stably bound to the DNA such as transcriptional fac-tors, and is therefore less preferred in integrative studies [11–13]. Nonetheless, a few studies have successfully re-ported ChIP-seq profiles of HPTM from muscle tissues. X-ChIP-seq was performed on muscles to study the nar-row peaks marks H3K4me3 and H3ac in rats [14] and H3K27ac in mice [15]. N-ChIP-seq was used rather than X-ChIP-seq to study the broad source mark H3K27me3 on bovine muscle [16].
Given the absence of a standardized ChIP-seq protocol for skeletal muscle tissue to study histone marks, we sought to compare two chromatin preparation strategies based either on cross-linked or native chromatin prepar-ation. In agreement with previous studies and ENCODE recommendations we used relaxation buffer for X-ChIP to improve chromatin fixation and performed several optimization steps throughout the protocols [6, 9, 10]. We explored the impact of both chromatin preparations on the genome-wide distribution of H3K27me3 through Illumina sequencing. Our analysis suggested that N-ChIP-seq is more efficient to discover H3K27me3 re-gions of enrichment than X-ChIP-seq for a given num-ber of reads when performed on chicken skeletal muscle.
Methods
Animals
Cobb 500 male chickens were raised in the INRA UE1295 PEAT experimental facilities (Pôle d’ Expérimen-tation Animale de Tours, Agreement N° C37–175-1). Experiments were performed in accordance with the le-gislation governing the ethical treatment of birds and were approved by the French Ministry of Higher Educa-tion and the Val-de-Loire Animal Ethics Committee (Authorization N° APAFIS#4608–201603211212171 v2).
Pectoralis Majormuscles were sampled at 35 days of age after slaughter from male chickens for ChIP-seq experi-ments. Two animals were used for muscle X-ChIP-seq and two for muscle N-ChIP-seq. For ChIP-qPCR experi-ments, Pectoralis Major muscles of three male animals of the same age were sampled: one half of each sample was fixed for X-ChIP-qPCR and the other half was left untreated for N-ChIP-qPCR.
Cross-Linking Chromatin Immunoprecipitation
Chromatin Preparation
Muscles were chopped in 250 mg pieces at sampling and were subsequently incubated in RBI buffer (10 mM KCl, 5 mM MgCl2, 5 mM EGTA pH 8, 5 mM Na
inhibitors from Roche Diagnostics, Basel, Switzerland; [9]) for 30 min on ice. The preparation of chromatin was adapted from Coustham et al. [17]. Samples were centrifuged 5 min at 3000 g and pellets were resus-pended in ice-cold Phosphate Buffered Saline (PBS, Sigma-Aldrich, Saint-Louis, USA) with 1 X Complete™ protease inhibitors (PBS-C) containing 1 or 2% formal-dehyde (FA, Sigma-Aldrich, Saint-Louis, USA) for 5, 15 or 30 min at room temperature under agitation. Reac-tions were stopped by adding glycine to a final concen-tration of 125 mM for 5 min at room temperature under agitation. Tubes were centrifuged 5 min at 3000 g and the pellet was washed 3 times in ice-cold PBS-C. At this step samples can be stored in PBS-C 30% glycerol and washed in cold PBS-C after thawing. Samples were ground using an ice-cold mortar and pestle until prepa-rations became homogeneous and incubated 10 min on ice with 1 mL of ice-cold Lysis Buffer (10 mM Tris-HCl pH 8, 5 mM EDTA pH 8, 85 mM KCl, 0.5% NP-40, 1 mM PMSF, 1 X Complete™ protease inhibitors).
Tis-sues were further homogenized using a dounce
homogenizer 20 times and divided into four 250μL frac-tions in 1.5 mL TPX tubes (Diagenode, Denville, USA). Cells were centrifuged 5 min at 5000 gand cellular
pel-lets were resuspended in 300 μL sodium Dodecyl
Sulphate (SDS) Lysis Buffer (50 mM Tris-HCl pH 8, 10 mM EDTA pH 8, 1% SDS, 10% glycerol, 1 X complete™ protease inhibitors). Tubes were vortexed 20 s, incubated 10 min on ice and vortexed 20 s again. Lysed nuclei were sonicated using a Bioruptor (Diage-node, Denville, USA) set to high setting (30 s ON, 30 s OFF; 2 × 5 min to 6 × 5 min). Samples were then centri-fuged 5 min at 10600gand stored at−80 °C. Optimiza-tions of fixation and sonication parameters are shown in Additional file 1: Fig. S1a.
Chromatin Quantification, Reverse Cross-Linking and Qual-ity Assessment
Muscle chromatin concentrations were estimated both by Qubit Fluorometric Quantitation (Qubit dsDNA Assay Kit, Thermo Scientific, Waltham, USA) and by spectrophotometry using a NanoDrop ND-1000 Spec-trophotometer (Thermo Scientific, Waltham, USA). Cross-linking was reversed before gel migration of the chromatin. To that end 10μL of supernatant was diluted 4 times in UltraPure water and NaCl was added to the final concentration of 200 mM. Samples were incubated overnight in a Thermomixer comfort (Eppendorf, Ham-burg, Germany; 65 °C, 1400 rpm) then incubated with RNase A (Thermo Scientific, Waltham, USA) 10 min at 45 °C under agitation (1400 rpm) followed by a protein-ase K incubation (Qiagen, Hilden, Germany; 1 h at 45 ° C, 1400 rpm). DNA purification was performed using a Macherey Nagel NucleoSpin® Gel and PCR Clean-up kit
(Macherey Nagel, Duren, Germany) following supplier’s protocol. DNA smears were visualised by migration on a 1% agarose gel electrophoresis stained with Gel Red (Biotium, Fremont, USA).
Immunoprecipitation
Immunoprecipitation protocol was adapted from Cous-tham et al. [17]. LoBind tubes (Eppendorf, Hamburg, Germany) were used throughout the IP. For each sam-ple, 10μL of dynabeads-protein A (Invitrogen, Carlsbad, USA) were washed twice on a magnetic stand (Invitro-gen, Carlsbad, USA) with 1 mL of ChIP dilution buffer (CDB; 1.1% Triton X-100, 1.2 mM EDTA pH 8, 16.7 mM Tris-HCl pH 8, 167 mM NaCl, 1 X Complete™ protease inhibitors). Five microliters of anti-H3K27me3 antibody (07–449, lot #2506493 Merck-Millipore, Biller-ica, USA) or 5 μL of CDB (no-antibody control) were added to 45μL of CDB and were incubated for 2 h on a rotating wheel at 4 °C. The beads were quickly spun using a table-top centrifuge (6 K), placed on a magnetic stand and the supernatant was discarded. The beads were washed 3 times with 1 mL of CDB and incubated 5 min on a rotating wheel at 4 °C between each wash. The beads were resuspended in 50μL of CDB. For each IP, 100 μL of chromatin was added to 850 μL of CDB and 50 μL of mix CDB plus beads. 30 μL of chromatin was stored at −80 °C for the input fraction. Samples were homogenized and incubated overnight on a rotat-ing wheel at 4 °C. Samples were washed twice usrotat-ing 1 mL of ice-cold Low Salt Wash Buffer (150 mM NaCl, 0.1% SDS, 1% Triton X-100, 2 mM EDTA pH 8, 20 mM Tris-HCl pH 8), once using 1 mL of ice-cold High Salt Wash Buffer (500 mM NaCl, 0.1% SDS, 1% Triton X-100, 2 mM EDTA pH 8, 20 mM Tris-HCl pH 8), once using 1 mL of ice-cold Lithium Chloride Wash Buffer (250 mM LiCl, 1% NP-40, 1% sodium deoxycholate, 1 mM EDTA pH 8, 10 mM Tris-HCl pH 8) and finally once using 1 mL of ice-cold TE Buffer (10 mM Tris-HCl pH 8, 1 mM EDTA pH 8). Beads were transferred into a new tube to reduce background noise and washed once in 1 mL of ice-cold TE Buffer for 5 min on a rotating wheel at 4 °C. Reverse cross-linking of samples were rea-lised as described above in a final volume of 240 μL. DNA purification was performed using a Macherey Nagel NucleoSpin® Gel and PCR Clean-up kit (Macherey Nagel, Duren, Germany) following supplier’s protocol (two successive elution of 20 μL each were realised in NE buffer and pooled).
Native Chromatin Immunoprecipitation
Chromatin Preparation
Approximately 800 mg of Pectoralis Majormuscle sam-ples were ground in liquid nitrogen using an A11 basic grinder (IKA, Staufen im Breisgau, Germany). Tissues were further homogenized using a dounce homogenizer in 7 mL of nuclei preparation buffer 1 (60 mM KCl, 15 mM NaCl, 5 mM MgCl2, 0.1 mM EGTA, 15 mM Tris-HCl pH 7.5, 0.3 M sucrose, 0.5 mM DTT, 0.1 mM PMSF, 3.6 ng/mL aprotinin, 5 mM sodium-butyrate). Samples were then filtered through two layers of sterile muslin cheese cloth, moistened beforehand with buffer 1, in 15 mL tubes (Corning, USA) and centrifuged 10 min at 5432gat 4 °C. The pellet was resuspended in 3 mL of ice-cold nuclei preparation buffer 1. One mL of ice-cold nuclei preparation buffer 2 (buffer 1, 0.8% NP-40) was added. Two equal mixes of 2 mL were gently transferred into two tubes of 13 mL Cultubes (Simport, Beloeil, Canada) containing 8 mL of ice-cold nuclei preparation buffer 3 (60 mM KCl, 15 mM NaCl, 5 mM MgCl2, 0.1 mM EGTA, 15 mM Tris-HCl pH 7.5, 1.2 M sucrose, 0.5 mM DTT, 0.1 mM PMSF, 3.6 ng/mL aproti-nin, 5 mM sodium-butyrate), incubated 6 min on ice and centrifuged 20 min at 9289 g at 4 °C. The super-natant was carefully removed and the pellet was resus-pended in ice-cold MNase digestion buffer (0.32 M sucrose, 50 mM Tris-HCl pH 7.5, 4 mM MgCl2, 1 mM CaCl2, 0.1 mM PMSF, 5 mM sodium-butyrate) to a final volume of 1 mL. The chromatin concentration was esti-mated using a NanoDrop ND-1000 in 0.1% SDS. Sam-ples were split in fractions containing 100 μg of chromatin in 500μL of MNase digestion buffer (at this step samples can be stored at−80 °C). The Nuclease S7 Micrococcal nuclease (MNase, Roche Diagnostics, Basel, Switzerland) was added to each sample and incubated at 37 °C (10 U - 7 min or 10 U - 10 min or 20 U - 10 min or 10 U - 15 min or 20 U - 15 min, Additional file 1: Fig. S1b). EDTA (18 mM final) was added to stop the re-action. Samples were centrifuged 10 min at 18516 g at 4 °C and the supernatant containing soluble chromatin fragments was retrieved. Chromatin concentration was estimated using a NanoDrop ND-1000. MNase digestion efficiency was verified by migration of 10 μL of super-natant on a 1% agarose gel electrophoresis in 1X DNA Gel Loading Dye supplemented with 6% SDS.
Chromatin Immunoprecipitation
IPs were performed on 5μg of chromatin in 1 mL of ChIP buffer (20 mM Tris-HCl pH 7.5, 20 mM sodium-butyrate, 5 mM EDTA, 0.1 mM PMSF, 50 mM NaCl). LoBind tubes were used throughout the IP. A total of 15μg of fragmen-ted chromatin was dilufragmen-ted in 3 mL of ChIP buffer and split in 3 equal fractions corresponding to no antibody, H3K27me3 and input fractions. The input fraction was stored at 4 °C until DNA purification. Five μL of
anti-H3K27me3 antibody were added to the anti-H3K27me3 frac-tion (07–449, lot #2506493, Merck-Millipore, Billerica, USA). The H3K27me3 and the no-antibody control frac-tions were both incubated overnight on a rotating wheel (4 °C). After adding 50 μL of dynabeads-protein A (Invi-trogen, Carlsbad, USA), the samples were incubated 4 h on a rotating wheel at 4 °C and then washed with buffers containing increasing concentration of NaCl. Five consec-utives washes of 1 mL using washing buffer A (50 mM Tris-HCl pH 7.5, 10 mM EDTA, 5 mM sodium-butyrate, 75 mM NaCl), buffer B (50 mM Tris-HCl pH 7.5, 10 mM EDTA, 5 mM sodium-butyrate, 125 mM NaCl) and buffer C (50 mM Tris-HCl pH 7.5, 10 mM EDTA, 5 mM sodium-butyrate, 175 mM NaCl) were performed using a magnetic stand. Elution was done in 500 μL of elution buffer (50 mM NaCl, 20 mM Tris-HCl pH 7.5, 20 mM sodium-butyrate, 5 mM EDTA, 0.1 mM PMSF, 1% SDS). Half of the input fraction (500μL corresponding to 2.5μg of chromatin) was supplemented with SDS to 1% final concentration (v/v). All the fractions were then incubated 30 min at room temperature on a rotating wheel. LoBind tubes were then centrifuged 3 min at 1122 g and the supernatant containing the DNA was retrieved into a Phase Lock Gel (5 PRIME, Hamburg, Germany) tube. DNA was purified by adding 1 volume of phenol:chloro-form:isoamyl alcohol (25:24:1, v:v:v, Sigma-Aldrich, Saint-Louis, USA). Tubes were centrifuged 15 min at 18516 g. DNA was precipitated by adding 25 μL of NaCl 5 M, 1 volume of isopropylic alcohol (Sigma-Aldrich, Saint-Louis, USA) and 1μL of 20 mg/mL glycogen (Invitrogen, Carls-bad, USA) overnight at −20 °C. Tubes were centrifuged 25 min at 18516 g at 4 °C and washed once in ice cold ethanol 70%. The pellet was air dried and eluted using 60μL of UltraPure water and stored at−80 °C until fur-ther use.
Library Preparation and High-Throughput Illumina Sequencing
Sequencing libraries were prepared using the NEB Next Ultra II DNA Library Prep kit for Illumina (New Eng-land Biolabs, Ipswich, USA). Ten ng of IP DNA and 100 ng of input DNA were used (7 and 4 cycles of amp-lification by PCR were performed, respectively). Agen-court AMPure XP beads (Beckman Coulter, Brea, USA) were used for the 200 bp size selection of DNA frag-ments. Libraries concentrations were measured by Qubit and stored at −80 °C until sequencing. Single-end 50 bases sequencing was realized using an Illumina 4000 apparatus by the IGBMC GenomEast Platform (Illkirch, France).
Bioinformatics Analysis
using SAMtools v1.0.1. Reads were aligned on the chicken genome Galgal5 [19] using Bowtie2 v2.2.6.2 (de-fault options). Peak detection was realized using epic (version 0.1.23) [20], a re-implementation of SICER [21] (options: –fragment-size 50 –gaps-allowed 2 – false-dis-covery-rate-cutoff 0.05) on the chicken chromosomes of Galgal5 (scaffolds were excluded). H3K27me3 enrich-ment regions were determined for each sample individu-ally. To assess the bias that may be linked to the heterogeneous number of unique reads between IP and input, we performed a random selection of 40 million of unique reads using a Perl script. Peak detection on this subset was realized using epic [20, 21], as described above. We determined the number of common peak using intersectBed (BEDTools v.2.25.0 [22]). Peaks were visualized with Integrative Genomics Viewer (Broad In-stitute) [23]. To produce the normalized BigWig files, a flagstat analysis (SAMtools) was first performed on the 40 million unique reads bam files to determine the num-ber of mapped reads. The input data was then scaled to the corresponding H3K27me3 data using genomeCover-ageBed (BEDTools; the scaling factor was determined by the ratio of the number of H3K27me3 mapped reads compared to the number of input mapped reads) and converted to bedGraph files. H3K27me3 bam files were also converted to bedGraph files using the same tool with no scaling factor. BigWig files were created using the bedGraphToBigWig tool and the normalized files [log2(H3K27me3/input)] were obtained using the big-wigCompare tool (default settings except for – pseudo-count 0.1 and–bs 1).
ChIP-qPCR
ChIP-qPCR primer sequences were designed using Pri-mer3plus (Additional file 1: Table S1). Two microliters of ChIP DNA or 0.2 μL of input DNA were used with
5 μM of each primer and Takyon No ROX SYBR 2X
MasterMix blue dTTP (Eurogentec, Liege, Belgium) fol-lowing manufacturer’s instructions. Reactions were per-formed on a LightCycler® 480 Instrument (Roche Diagnostics, Basel, Switzerland) with the following pro-gram: denaturation 5 min at 95 °C, 50 amplification cy-cles (10 s at 95 °C, 15 s at 60 °C, 15 s at 72 °C), melting curve (5 s at 95 °C, 1 min at 65 °C, continuous at 95 °C) and cooling. Enrichments were determined with percent input method [100*2^ (adjusted input - Ct (IP)].
Results
Chromatin Preparation and Immunoprecipitation Performed Equivalently between X-ChIP and N-ChIP
In order to compare both fixed and native methods for preparing chromatin for ChIP-seq, we sampled in paral-lel 5 weeks-old male chicken muscle tissues (Pectoralis
major) that were either cross-linked or snap frozen
(unfixed). For cross-linked samples, we found that incu-bating muscle in the RBI relaxation buffer before fix-ation did improve tissue grinding by requiring less strength to grind despite this had no visible impact on chromatin shearing ([9] and data not shown). We deter-mined the optimal cross-linking conditions by testing the following parameters: formaldehyde (FA) concentra-tions (1 and 2%), cross-linking duration (5 to 30 min) and sonication parameters (10 to 30 min with cycles 30 s ON / 30 s OFF) (Additional file 1: Fig. S1a). The condition that produced consistent shearing of DNA with an adequate fragment size of 200–600 bp was cross-linking with 1% FA for 5 min at room temperature followed by 15 min of sonication (Additional file 1: Fig. S1a lane 3). Similarly, we defined the Nuclease S7 Micrococcal nuclease (MNase) digestion conditions by adapting the duration of the enzyme incubation and its concentration (Additional file 1: Fig. S1b). Optimal mono-nucleosome digestion was achieved using 20 U of MNase incubated 15 min at 37 °C (Additional file 1: Fig. S1b lane 6). After chromatin preparation (Additional file 1: Fig. S1c-d), about twice more DNA was obtained for both X-ChIP input and IP fractions but the same amount of DNA was used to perform the library prepar-ation (Additional file 1: Table S2).
Fewer Regions of H3K27me3 Enrichment Were Identified by X-ChIP-Seq Compared to N-ChIP-Seq
Two biological replicates per ChIP method were se-quenced using Illumina HiSeq technology (Table 1). The
sequencing produced high-quality reads for both
respectively (Table 1). The median peak length was glo-bally higher for N-ChIP-seq compared to X-ChIP-seq (Additional file 1: Fig. S3). We analyzed the distribution of the peaks and found that half of them shared at least one base in common between both X-ChIP-seq repli-cates whereas 92.3% of the N-ChIP-seq peaks were com-mon between replicates (Fig. 1a-b, Additional file 1: Fig. S4a-b). Peaks were preferentially located in regions around the TSS of genes as it was previously reported with a better defined signal around the TSS for N-ChIP-seq (Additional file 1: Fig. S4d) [16, 25]. Based on a pre-vious transcriptome analysis using the same experimen-tal design, we found that genes containing a peak displayed generally a low level of expression for both methods, in agreement with the repressive function of this mark (Additional file 1: Fig. S4d) [25]. We further compared the distribution of the 651 common X-ChIP-seq peaks and the 11,048 common N-ChIP-X-ChIP-seq peaks and found that only 40 peaks intersected, which is less than 1% of the total number of identified peaks (Fig. 1c). This surprising finding is consistent with the peak distri-bution that appeared different between both methods (Additional file 1: Fig. S4c). Genomic regions of enrich-ment in H3K27me3 were visualized using IGV [23]. While N-ChIP-seq H3K27me3 broad peak signal could be clearly identified, X-ChIP-seq signal appeared more discreetly at common peak positions (Fig. 1d-g and Fig. 2c). These results were confirmed using another peak caller (MACS2 [26]): only 38 and 32 non-overlapping re-gions of enrichment were identified for both X-ChIP-seq replicates compared to 17,113 and 17,591 for N-ChIP-seq replicates with 65% of overlap (Additional file 1: Table S3 and Fig. S5).
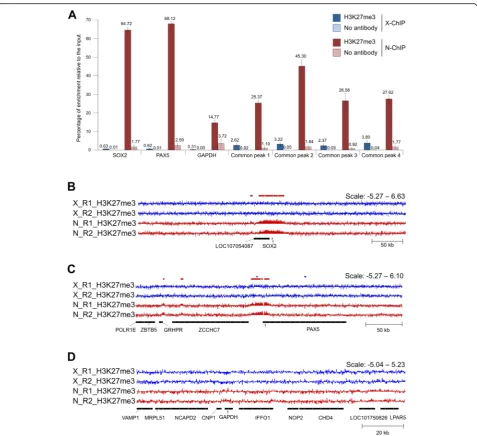
The Lower X-ChIP-Seq Enrichment was Confirmed by ChIP-qPCR
H3K27me3 enrichment was verified by ChIP-qPCR on three biological replicates for which chromatin was
prepared both in native and under cross-linked condi-tions. We investigated seven regions of interest. Three regions were selected based on the literature, two of them known to be enriched for the H3K27me3 mark in myotubes and myoblasts (SOX2andPAX5[25]) and one known to display low levels of enrichment (GAPDH [27]). Four other regions were selected as common re-gions of enrichment identified in the present ChIP-seq experiment (Fig. 2). The epic analysis was able to detect enrichments at both SOX2 and PAX5 loci for N-ChIP-seq but failed to detect a peak at SOX2 locus for X-ChIP-seq (as shown by red and blue bars in Fig. 2b-c). As expected, the H3K27me3 enrichment relative to the input was observed at all loci tested with lower levels at the GAPDH locus (Fig. 2a). In addition, the percentage of H3K27me3 enrichment relative to the input was sig-nificantly lower for X-ChIP-seq than for N-ChIP-seq at the different loci tested, notably at theSOX2(0.62% and 64.72% in average respectively) and PAX5 loci (0.62% and 68.95% in average respectively; Fig. 2b-c).
H3K27me3 X-ChIP-Seq was Suitable to Detect Broad Peaks in Chicken Hypothalamus
Despite chromatin preparation seemed to perform normally for cross-linked muscle samples (Additional file 1: Fig. S1c), we tested our fixed chromatin prepar-ation protocol on another tissue that was not previ-ously reported to be problematic for X-ChIP-seq. To that end we performed fixation and chromatin prep-aration on two hypothalamus samples from 5 weeks-old male chickens (Additional file 1: Supplemental methods). The chromatin was fragmented similarly to the muscle chromatin (Additional file 1: Fig. S6a) and Illumina sequencing was performed in the same con-ditions except for a larger number of amplification cycles used during the library creation process (10 in-stead of 7) due to the lower amount of chromatin ex-tracted from the 30 mg samples. About 13,000 broad
Table 1Sequencing results of cross-linked and native ChIP-seq on muscle samples. Two biological replicates were sequenced for each chromatin immunoprecipitation method (X-ChIP and N-ChIP). Reads were mapped against the chicken genome Galgal5, and peaks were detected using epic. When indicated (40 M), analyses were performed on 40 million of unique reads per sample that were randomly selected for both H3K27me3 and input fractions. Genome coverage is expressed in Megabases
Method X-ChIP N-ChIP
Sample X_R1 X_R2 N_R1 N_R2
Fraction Input H3K27me3 Input H3K27me3 Input H3K27me3 Input H3K27me3
Total number of reads (millions) 57.37 119.58 60.29 123.37 57.98 92.93 58.94 128.56
Total number of uniquely mapped reads (millions) 51.16 106.36 52.55 104.29 45.17 69.58 46.51 92
Total peak number 2127 2519 16,446 13,949
Total genome coverage (Mb) 7.87 9.75 73.52 71.14
40 M peak number 1264 1484 14,128 11,900
peaks were identified using epic, representing about 59% of the genome covered in H3K27me3 (Additional file 1: Table S4). In addition, H3K27me3 enrichment levels could be clearly visualized at the SOX2 and
PAX5 control loci (Additional file 1: Fig. S6b-d), simi-larly to what was observed for the N-ChIP-seq muscle signals. Altogether, this suggests that our X-ChIP-seq protocol performed adequately and that the issues
reported above may be specifically related to the muscle tissue used.
Discussion
Chromatin fixation and fragmentation by sonication or MNase digestion are key steps for a successful ChIP experi-ment. In this study, we sought to compare both chromatin preparation strategies to perform ChIP-seq from chicken
skeletal muscle tissue. We determined first the optimal conditions for chromatin fixation and shearing (X-ChIP) or enzymatic digestion (N-ChIP). For X-ChIP, we found that muscle chromatin shearing was optimal when the tissue was fixed for 5 min in 1% FA and chromatin was sonicated for 15 min, resulting in DNA fragments ranging from 100 to 600 bp as described previously [6, 28]. Therefore, despite reports suggesting that cross-linking reagents may not be efficient to properly fix the chromatin in muscle tissue [8], we were able to produce chromatin from skeletal muscle
that was appropriately sheared [6, 28]. For N-ChIP prepar-ation, 15 min of MNase digestion at a concentration of 20 U produced mono-nucleosomes as recommended [29]. We used comparable amount of chromatin for the IP, about 6μg for X-ChIP and 5μg for N-ChIP, and the same batch of anti-H3K27me3 antibody was used [6]. X-ChIP immu-noprecipitation yielded about twice as much chromatin as N-ChIP but the same observation was made for input DNA recovery, suggesting that this difference may be due to the purification method that differed between both
approaches (as X-ChIP included a cross-linking reversal step) [17, 18]. Therefore, until this point, both ChIP methods seemed to perform adequately and in a relatively similar manner.
The same amount of chromatin was used for the library preparation and sequencing. Four libraries (two per method) were sequenced for at least 40 million unique reads following ENCODE ChIP-seq guidelines for broad source signals [5, 6]. As the histone mark H3K27me3 is known to be distributed in peaks spanning across broad re-gions, we analyzed the data using epic, a ChIP-seq caller based on the SICER algorithm [20, 21]. Our analysis showed that H3K27me3 genome coverage was 10-fold higher for N-ChIP-seq compared to X-ChIP-seq (Table 1). Less than 1% of the genome was covered in peaks for X-ChIP-seq. To make sure that this result was not due to the different number of reads between all input and IP samples, we performed the analysis on 40 million of unique reads for each input and IP sample, following ENCODE recom-mendations [5]. However, this had no major impact on the number of peaks identified (Table 1). Strikingly, N-ChIP-seq peak regions were highly consistent between replicates (> 90% of peaks were common for R2 compared to N-R1) while only about half of the peaks detected in X-ChIP-seq data were common to both replicates (Fig. 1a-b). While we cannot exclude that this may be due to a difference in the biological replicates used in this study (despite same genotype and rearing condition were used), we would ra-ther speculate that this is likely due to the fact that peaks are better defined in the N-ChIP-seq analysis, as seen on the IGV genome browser for common peaks regions (Fig. 1 d-g). These results would therefore suggest that the peak detection is more robust for N-ChIP-seq data. Differences were even more dramatic when analyzed with the peak caller MACS2 as only about 30 peaks were identified for X-ChIP-seq compared to about 17,000 peaks identified for N-ChIP-seq. It is worth noting that epic performed better in terms of peak discovery compared to MACS2 for X-ChIP-seq, which is in agreement with the fact that epic may be better suited to identify broad source signals such as H3K27me3 than the most-widely used MACS2 tool.
Despite ENCODE ChIP-seq guidelines recommended at least two biological replicates [6], we acknowledge that only two replicates is not optimal for performing a proper, unbiased detection of peaks. However, this study showed that epic led to a remarkably reproducible identifica-tion of peaks between replicates for N-ChIP-seq. In addition, we verified H3K27me3 enrichments for 3 biological replicates by ChIP-qPCR at control loci (PAX5 and SOX2) and peaks from the ChIP-seq ana-lysis (Fig. 2a). ChIP-qPCR results were in agreement with the lower peak signal observed for the X-ChIP-seq compared to the N-ChIP-X-ChIP-seq, supporting the fact that native preparation of chromatin led to a stronger
H3K27me3 enrichment signal at loci of interest after immunoprecipitation.
Surprisingly, we found that less than only 1% of the X-ChIP-seq peaks intersected with those from the N-ChIP-seq (Fig. 1c). This difference is in agreement with the non-overlapping peak distribution reported by the ChIP-seeker analysis, in particular at the Z chromosome (Add-itional file 1: Fig. S4c). These observations suggest that the majority of the peaks identified by both methods were distinct. It was reported previously that MNase di-gestion may lead to a selective didi-gestion of particular chromatin domains during preparation, and that the fix-ation may also induce signal artifacts caused by the crosslinking with other genomic regions [1, 29]. How-ever, none of the studies reported such a discrepancy in the peak distribution. This suggests that one or several factors in the P. major cellular environment may affect the chromatin conformation, accessibility and/or shear-ing in a significant manner. Nonetheless, in addition to a much larger number of peaks identified, N-ChIP-seq sig-nal was consistent with the H3K27me3 sigsig-nal previously reported for other tissues and species, as illustrated by the SOX2 and PAX5 control regions profiles of enrich-ment. Therefore, while some peaks may be missed by N-ChIP-seq in chicken breast muscle for unknown reasons that would require further studies, the native preparation of chromatin appeared to be the most suitable to detect a majority of the expected peaks.
Given that X-ChIP-seq protocol seemed to be less effi-cient than N-ChIP-seq protocol on P. major tissue, we verified that the X-ChIP-seq protocol functioned prop-erly on tissues for which nuclei were easily accessible. To that end we used chicken brain tissue (hypothal-amus). Cross-linking and chromatin fragmentation of hypothalamus gave similar results in terms of chromatin shearing. The H3K27me3 X-ChIP-seq signal from hypo-thalamus was clearly distinct from the input fraction sig-nal at PAX5 and SOX2 control loci contrary to the muscle X-ChIP-seq signal (Additional File 1: Fig. S6). The epic analysis produced a number of peaks similar to the one observed for N-ChIP-seq from muscle. More-over, the number of enriched regions in hypothalamus X-ChIP-seq and muscle N-ChIP-seq were comparable to what Luo and co-workers have reported in chicken spleen by N-ChIP-seq for this mark [30]. These results suggest that our method succeeded in identifying regions of enrichment using cross-linked chromatin from brain, despite much less starting material was used.
studying these marks [5, 6, 24]. Altogether, these results sup-port the hypothesis that the relatively low performance of X-ChIP-seq from chicken P. major muscle is likely to be due to the poor compatibility of the chromatin preparation method with this particular tissue.
Conclusions
We performed in parallel two ChIP-seq analyses of the H3K27me3 mark from native and fixed chromatin ex-tracted from chicken skeletal muscle tissue (P. major). Our analysis showed that in skeletal muscle X-ChIP-seq was much less efficient as 10-times less regions of enrichment (peaks) were detected compared to N-ChIP-seq on the same tissues. We therefore recommend performing N-ChIP-seq to characterize HPTM at a whole genome scale in chicken skeletal tissue samples, possibly extending to other species including mammals.
Additional file
Additional file 1: Fig. S1.Setup of chromatin preparation conditions. Table S1.ChIP-qPCR primers.Table S2.Quantity of chromatin and DNA used throughout the protocol.Fig. S2.Quality assessment of the sequencing reads. Fig. S3.Boxplot representing the distribution of the 40 M peaks lengths. Fig. S4.X-ChIP-seq and N-ChIP-seq peaks analysis.Table S3.Broad peak detection analysis by MACS2 for both H3K27me3 X-ChIP-seq and N-ChIP-seq experiments.Fig. S5.Comparison of H3K27me3-enriched peak regions detected by MACS2 and between MACS2 and epic. Supplemental methods X-ChIP-seq protocol for hypothalamus tissue samples.Table S4.Sequencing results of hypothalamus X-ChIP-seq analyzed using epic.Fig. S6.
Fragmentation assessment of chromatin before immunoprecipitation for hypothalamus samples and X-ChIP results at three control loci. (PDF 1487 kb)
Abbreviations
CDB:ChIP dilution buffer; ChIP-qPCR: Chromatin immunoprecipitation followed by qPCR; ChIP-seq: Chromatin immunoprecipitation followed by high throughput sequencing; FA: Formaldehyde; H3K*me3: Tri-methylation of lysine * on the histone H3 (* can be 4, 27 or 36 in this article); HPTM: Histone post-translational modifications; IP : Immunoprecipitation; MNase: Micrococcal nuclease; N-ChIP: Chromatin immunoprecipitation on native chromatin; PBS: Phosphate buffered saline; PBS-C: phosphate buffered saline supplemented with Complete™protease inhibitors; qPCR: Quantitative polymerase chain reaction; RBI: Relaxation buffer; SDS: Sodium dodecyl sulphate; X-ChIP: Chromatin immunoprecipitation on cross-linked chromatin
Acknowledgements
The authors wish to thank A. Vitorino Carvalho, E. Godet, C. Praud, A. Jacques, Y. Wang, S. Metayer-Coustard, E. Cailleau-Audouin, P. Chartrin, E. Coudert, C. Combémorel, E. Dominguez-Romero, E. Baéza, D. Nyuiadzi (URA, INRA, 37380 Nouzilly, France) and L. Beauclair (PRC, CNRS, IFCE, INRA, Univer-sité de Tours, 37380, Nouzilly, France) for their technical support, and F. Mer-cerand, D. Gourichon, H. Rigoreau, J. Delaveau, C. Rat, P. Ganier, O. Callut (UE PEAT, INRA, 37380 Nouzilly, France) for the rearing and care of the animals. We are grateful to V. Moncollin (Université de Lyon 1 and Laboratoire de Bio-logie Moléculaire de la Cellule, ENS Lyon, Lyon, France) for methodology dis-cussions. Sequencing was performed by the IGBMC Microarray and Sequencing platform, a member of the‘France Génomique’consortium (ANR-10-INBS-0009). Studies were made possible by the financial support of INRA Department Animal Physiology and Livestock Systems (PHASE), project STRESSEPIMARK. S.-A. David Ph.D. studies were co-funded by INRA-PHASE and Region Centre-Val de Loire.
Availability of data and material
The datasets generated and analyzed during the current study have been deposited in the European Nucleotide Archive repository (ENA), http:// www.ebi.ac.uk/ena. Accession number: PRJEB21016, Unique Name: ena-STUDY-INRA-24-05-2017-10:52:26:309–490.
Funding
This work was supported by the Region Centre Val de Loire and the Department of Animal Physiology and Livestock Systems of the French National Institute of Agronomical Research (INRA).
Authors’contributions
VC, SAD and AC designed the experiments; VC, SAD, MP, TAL, TB, SC and NC performed the experiments; VC, SAD, BP, CHA and AB analyzed the results; VC, SAD, BP, CHA, YB and AC wrote the manuscript; All authors read and approved the final manuscript.
Ethics approval and consent to participate
Experiments were performed in accordance with the legislation governing the ethical treatment of birds and were approved by the French Ministry of Higher Education and the Val-de-Loire Animal Ethics Committee
(Authorization N° APAFIS#4608–201,603,211,212,171 v2).
Consent for publication Not applicable.
Competing interests
The authors declare that they have no competing interests.
Publisher’s Note
Springer Nature remains neutral with regard to jurisdictional claims in published maps and institutional affiliations.
Author details
1URA, INRA, 37380 Nouzilly, France.2UMR PRC, CNRS, IFCE, INRA, Université de Tours, 37380 Nouzilly, France.3UMR BDR, INRA, ENVA, Université Paris-Saclay, 78350 Jouy-en-Josas, France.
Received: 16 June 2017 Accepted: 31 July 2017
References
1. Turner B. ChIP with native chromatin: advantages and problems relative to methods using cross-linked material. In: Mapping protein/DNA interactions by cross-linking [internet]. Paris: Institut national de la santé et de la recherche médicale; 2001.
2. Bannister AJ, Kouzarides T. Regulation of chromatin by histone modifications. Cell Res. 2011;21:381–95. doi:10.1038/cr.2011.22. 3. Encode Consortium. An integrated encyclopedia of DNA elements in the
human genome. Nature. 2012;489:57–74. doi:10.1038/nature11247. 4. Furey TS. ChIP–seq and beyond: new and improved methodologies to
detect and characterize protein–DNA interactions. Nat Rev Genet. 2012;13 December:840–52. doi:10.1038/nrg3306.
5. Jung YL, Luquette LJ, Ho JWK, Ferrari F, Tolstorukov M, Minoda A, et al. Impact of sequencing depth in ChIP-seq experiments. Nucleic Acids Res. 2014;42:1–10.
6. Landt S, Marinov G. ChIP-seq guidelines and practices of the ENCODE and modENCODE consortia. Genome 2012; Park 2009:1813–31. doi:10.1101/gr. 136184.111.
7. Harridge SDR. Plasticity of human skeletal muscle: gene expression to in vivo function. Exp Physiol. 2007;92:783–97. doi:10.1113/expphysiol.2006. 036525.
8. Ohkawa Y, Mallappa C, Dacwag Vallaster CS, Lmbalzano AN. Isolation of nuclei from skeletal muscle satellite cells and Myofibers for use in chromatin lmmunoprecipitation assays. Myogenesis. 2012;798:517–30. doi:10.1007/978-1-61779-343-1.
10. Ratti F, Ramond F, Moncollin V, Simonet T, Milan G. M??Jat a, et al. Histone deacetylase 6 is a FoxO transcription factordependent effector in skeletal muscle atrophy. J Biol Chem. 2015;290:4215–24.
11. Speil J, Baumgart E, Siebrasse JP, Veith R, Vinkemeier U, Kubitscheck U. Activated STAT1 transcription factors conduct distinct saltatory movements in the cell nucleus. Biophys J. 2011;101:2592–600. doi:10. 1016/j.bpj.2011.10.006.
12. Chen J, Zhang Z, Li L, Chen BC, Revyakin A, Hajj B, et al. Single-molecule dynamics of enhanceosome assembly in embryonic stem cells. Cell. 2014; 156:1274–85.
13. Zhang Z, English BP, Grimm JB, Kazane SA, Hu W, Tsai A, et al. Rapid dynamics of general transcription factor TFIIB binding during preinitiation complex assembly revealed by single-molecule analysis. Genes Dev. 2016; 30:2106–18.
14. Kawano F, Nimura K, Ishino S, Nakai N, Nakata K, Ohira Y. Differences in histone modifications between slow- and fast-twitch muscle of adult rats and following overload, denervation or valproic acid administration. J Appl Physiol. 2015. doi:10.1152/japplphysiol.00289.2015.
15. Joshi S, Davidson G, Le Gras S, Watanabe S, Braun T, Mengus G, et al. TEAD transcription factors are required for normal primary myoblast
differentiation in vitro and muscle regeneration in vivo 2017. doi:10.1371/ journal.pgen.1006600.
16. Byrne K, McWilliam S, Vuocolo T, Gondro C, Cockett NE, Tellam RL. Genomic architecture of histone 3 lysine 27 trimethylation during late ovine skeletal muscle development. Anim Genet. 2014;:427–38. doi:10.1111/age.12145. 17. Coustham V, Li P, Strange A, Lister C, Song J, Dean C. Quantitative
modulation of Polycomb silencing underlies natural variation in Vernalization. Science. 2012;337:584–7. doi:10.1126/science.1221881. 18. Wagschal A, Delaval K, Pannetier M, Arnaud P, Feil R. Chromatin
Immunoprecipitation (ChIP) on unfixed chromatin from cells and tissues to analyze Histone modifications. Cold Spring Harb Protoc. 2007; doi:10.1101/ pdb.prot4767.
19. Warren WC, Hillier LW, Tomlinson C, Minx P, Kremitzki M, Graves T, et al. A New Chicken Genome Assembly Provides Insight into Avian Genome Structure. G3 (Bethesda). 2016;7 January:g3.116.035923. doi:10.1534/g3.116.035923. 20. Stovner EB, Sætrom P, Beraldi D, Dale R, Thompson RC. epic: diffuse domain
ChIP-Seq caller based on SICER from github database https://github.com/ biocore-ntnu/epic. Accessed 24 Mar 2017.
21. Zang C, Schones DE, Zeng C, Cui K, Zhao K, Peng W. A clustering approach for identification of enriched domains from histone modification ChIP-Seq data. Bioinformatics. 2009;25:1952–8.
22. Quinlan AR, Hall IM. BEDTools: a flexible suite of utilities for comparing genomic features. Bioinformatics. 2010;26:841–2.
23. Thorvaldsdóttir H, Robinson JT, Mesirov JP. Integrative genomics viewer (IGV): high-performance genomics data visualization and exploration. Brief Bioinform. 2013;14:178–92.
24. Encode Consortium. ChIP-seq Data Standards. https://www.encodeproject. org/chip-seq/histone/. Accessed 30 Mar 2017.
25. Asp P, Blum R, Vethantham V, Parisi F, Micsinai M, Cheng J, et al. Genome-wide remodeling of the epigenetic landscape during myogenic differentiation. Proc Natl Acad Sci. 2011;108:E149–58. doi:10.1073/pnas. 1102223108.
26. Zhang Y, Liu T, Meyer CA, Eeckhoute J, Johnson DS, Bernstein BE, et al. Model-based analysis of ChIP-Seq (MACS). Genome Biol. 2008;9:R137. doi:10. 1186/gb-2008-9-9-r137.
27. Bhandare R, Schug J, Lay J Le, Fox A, Smirnova O, Liu C, et al. Genome-wide analysis of histone modifications in human pancreatic islets. 2010;4:428–33. doi: 10.1101/gr.102038.109.
28. Haring M, Offermann S, Danker T, Horst I, Peterhansel C, Stam M. Chromatin immunoprecipitation: optimization, quantitative analysis and data normalization. Plant Methods. 2007;3:11. doi:10.1186/1746-4811-3-11. 29. Kidder BL, Hu G, Zhao K. ChIP-Seq: technical considerations for obtaining
high-quality data. Nat Immunol. 2011;12:918–22. doi:10.1038/ni.2117. 30. Luo J, Mitra A, Tian F, Chang S, Zhang H, Cui K, et al. Histone methylation analysis
and pathway predictions in chickens after MDV infection. PLoS One. 2012;7
• We accept pre-submission inquiries
• Our selector tool helps you to find the most relevant journal
• We provide round the clock customer support
• Convenient online submission
• Thorough peer review
• Inclusion in PubMed and all major indexing services
• Maximum visibility for your research
Submit your manuscript at www.biomedcentral.com/submit