OF OFF-ROAD CYCLING PERFORMANCE
By Joshua Adams
A thesis
submitted in partial fulfillment of the requirements for the degree of
Master of Science in Exercise and Sport Studies, Biophysical Studies Boise State University
BOISE STATE UNIVERSITY GRADUATE COLLEGE
DEFENSE COMMITTEE AND FINAL READING APPROVALS
of the thesis submitted by
Joshua M. Adams
Thesis Title: Laboratory and Field-Based Correlates of Off-Road Cycling Performance Date of Final Oral Examination: 18 June 2012
The following individuals read and discussed the thesis submitted by student Joshua M. Adams, and they evaluated his presentation and response to questions during the final oral examination. They found that the student passed the final oral examination.
Lynda Ransdell, Ph.D. Chair, Supervisory Committee Jane Shimon, Ph.D. Member, Supervisory Committee
James Moore, M.S. Member, Supervisory Committee
iv ABSTRACT
The aims of this study were to identify physiologic characteristics among trained off-road cyclists and correlate them with a field-based time trial to determine predictors of live performance. Fourteen trained male off-road cyclists were recruited for this study, and measured for maximum aerobic capacity (VO2max), peak aerobic power (Wpeak),
maximum anaerobic power (Wmax), time trial performance (sec), and climbing ability
(vertical feet per second – VFS). VO2max and Wpeak were measured during an incremental
cycling test to exhaustion, Wmax was measured during a 30-second Wingate test and time
trial, and VFS were measured during a live 1.65 mile uphill mountain bike course. Laboratory and field test variables were taken as absolute values as well as relative values when scaled to body mass and correlated to identify their relationship. Significant
correlations (p = 0.01) were seen between relative peak power (W·kg-1) and time trial
performance (r = -0.803), absolute VFS (r = 0.828), and relative VFS (r = 0.843). Relative maximum aerobic capacity (ml·kg·-1min-1) was also highly and significantly correlated (p = 0.01) with time trial performance (r = -0.773), absolute VFS (r = 0.790), and relative VFS (r = 0.775). Moderate correlations (p = 0.05) were demonstrated between absolute peak power and time trial (r = -0.595) and absolute VFS (r = 0.603). The present results suggest that relative peak power (W·kg-1) and relative maximum
oxygen consumption (ml·kg·-1min-1) are highly predictive of uphill climbing time trial efforts.
v
TABLE OF CONTENTS
ABSTRACT ... iv
LIST OF TABLES ... viii
LIST OF FIGURES ... ix
CHAPTER 1: INTRODUCTION ... 1
Hypotheses ... 6
Delimitations ... 7
Limitations ... 7
Definitions... 8
Lactate Threshold... 8
Maximum Aerobic Capacity ... 8
Maximal Anaerobic Power ... 8
Onset of Blood Lactate Accumulation ... 8
Peak Aerobic Power ... 8
Vertical Feet per Second ... 8
CHAPTER 2: LITERATURE REVIEW ... 9
Race Categories ... 9
Road Racing ... 9
Mountain Bike Racing ... 10
vi
Physiological Profiles of Off-Road Cyclists ... 11
Maximal Aerobic Capacity ... 11
Incremental Cycling Tests (Peak Power Output) ... 12
Wingate Test (Average & Maximal Power Output) ... 14
Energy System Considerations ... 15
Exercise Intensity during Off-Road Cycling. ... 16
Positive Correlates (Predictors) of Performance... 17
CHAPTER 3: METHODS ... 22
Subjects ... 22
Experimental Design ... 22
Procedures ... 23
Day 1 - Anthropometric and Training Information ... 23
Day 2 - Maximum Aerobic Capacity ... 24
Day 3 - Maximum Anaerobic Power ... 26
Day 4 - Vertical Feet per Second (VFS) ... 27
Statistical Analysis ... 29
CHAPTER 4: RESULTS ... 30
Subjects ... 30
Laboratory Tests ... 32
Maximum Aerobic Capacity ... 32
Peak Aerobic Power ... 33
Maximum Anaerobic Power ... 34
vii
Time Trial ... 35
Correlations ... 36
CHAPTER 5: DISCUSSION ... 38
Conclusions ... 43
viii
LIST OF TABLES
Table 1 Summary of Incremental Test Results for Male Off-Road Cyclists ... 14
Table 2 Race Category and Training Habits ... 31
Table 3 Descriptive Characteristics of the Sample ... 32
Table 4 VO2max Results for the Sample ... 33
Table 5 Aerobic Power Results for the Sample ... 34
Table 6 Maximum Power Results for the Sample ... 35
Table 7 Time Trial Results for the Sample ... 36
ix
LIST OF FIGURES
Figure 1 Time trial profile (* Device: Garmin Forerunner 405Hr.
CHAPTER 1: INTRODUCTION
Mountain biking, also known as off-road cycling, is any cycling event that takes place off-road on trails, gravel or dirt roads, or in open fields. The sport consists of several events including cross-country, short track, and downhill races, each with their own set of unique characteristics and demands. Over the past two and a half decades, mountain biking has seen large increases in the number of participants starting from 112 registered members in 1983 and growing to over 11,900registered members in 2007 (USA Cycling, Retrieved April 30th, 2009, from
http://www.usacycling.org/news/user/story.php?id=938). Despite the increasing number of competitions and competitors nationally as well as internationally, relatively few studies have investigated predictors of success in off-road cycling performance, especially when compared to traditional road cycling. Part of the challenge posed to researchers attempting to identify various parameters of off-road cycling is that
replication in a laboratory setting is nearly impossible. Many factors that make mountain biking unique, also make it difficult to study (i.e., highly variable mountainous terrain, crowded trails and wide variations in exercise intensity). All of the aforementioned factors differ greatly from course to course and from event to event.
ascending and descending vertical distances ranging anywhere from 1000 to 2000 feet over the course of a race (Impellizzeri & Marcora, 2007). Contrary to road cycling, the terrain of these courses is typically highly technical and includes large rocks, roots, or logs that must be avoided or negotiated, testing not only physical ability but a rider’s bike- handling skills as well (Lee, Martin, Anson, Grundy, & Hahn, 2002). From beginning to end, competitive cross-country races are completed in 2-3 hours and are won by riders posting times of roughly 120-135 minutes (men) and 105-120 minutes (women) over courses ranging from 25-40 kilometers (Gregory, Johns, & Walls, 2007; Impellizzeri & Marcora, 2007; Wilber, Zawadzki, Kearney, Shannon, & Disalvo, 1997). Racing format varies from co-ed to men’s and women’s races only with men generally covering more distance if separated, explaining the differences in duration.
Downhill courses are an exclusive “gravity race” requiring a single rider to navigate the course as quickly as possible from top to bottom (USA Cycling, Retrieved May 1st, 2009,
from http://www.usacycling.org/news/user/story.php?id=946). As a timed event, downhill competitors are often staged and riders generally do not have to worry about encountering any other riders during competition. The duration of a typical downhill race varies from 4-8 minutes and the course includes portions of rapid descents and highly technical obstacles (USA Cycling, Retrieved May 1st, 2009, from
http://www.usacycling.org/news/user/ story.php?id=946).
Previous studies have examined factors related to performance in mountain biking. Success during any cycling event is highly dependent on the athlete’s ability to meet the demands unique to each competition (Anton et al., 2007). Mass starts, steep climbs, and finishing sprints are present in nearly every cycling event and must be considered when evaluating cycling ability. Several studies have examined correlates of success in road events; however, research into the unique demands of off-road cycling is relatively sparse.
Of the research that does exist, scholars believe that in order to compete at an elite level, mountain bike athletes must display higher than average values for maximum heart rate (HRmax), maximum aerobic capacity (VO2max), and aerobic power measured in watts
(W). Additionally, off-road cyclists often compete at or above their lactate threshold (LT) and at intensities beyond the point of the onset of blood lactate accumulation (OBLA). Lactate threshold is defined as the point at which exercise induces a 1 mmol·L
-1 increase in blood lactate above baseline and OBLA is defined as an exercise intensity
Orbananos, & Angulo, 2000). Exercise intensity can also be described in terms of where an individual’s LT and OBLA are reached as a percentage of their maximum power output. In other words, how close to maximum effort can an individual work until he or she reaches these metabolic thresholds?
Maximum heart rate, VO2max, and aerobic power (W) are measureable in either a
laboratory or field-test setting and include the use of metabolic carts to measure gas exchange (VO2max), portable lactate analyzers (LT and OBLA), reliable heart rate
monitors (average or peak HR), and either a manually braked cycle ergometer or an on-bike cyclometer with a rear hub powermeter (average or peak power). The advantage to using a “real time” powermeter when assessing an athlete’s power output is that it is possible to get second by second power readings, which can then be used to determine an athlete’s mean power output (Wmean), maximum power output (Wmax), and average heart
rate (HRmean) during peak power and at points during an event when power demands are
highest. This type of equipment makes data collection during competition possible and data collected using mobile ergometers may more effectively demonstrate field
conditions, more closely approximating competitive performance (Faria, Parker, & Faria, 2005; Paton & Hopkins, 2001).
mountain biker (Baron, 2001; Gregory et al., 2007; Impellizzeri, Sassi,
Rodriguez-Alonso, Mognoni, & Marcora, 2002; Impellizzeri et al., 2005a; Impellizzeri et al., 2005b; Lee et al., 2002; Prins, Terblanche, & Myburgh, 2007; Wilber et al., 1997).
Given that minimal data on these parameters exist among off-road cyclists, more information is needed. Specifically, of the studies conducted, focus has primarily been on nationally and internationally competitive MTB riders and not on locally or regionally competitive riders. This narrow scope only describes the characteristics of an extremely small sample of off-road cyclists and ignores the much larger population of competitors at lower competition levels.
Specific attention has recently been paid to the use of absolute vs. relative measures that are scaled to body mass (Gregory et al., 2007; Impellizzeri et al., 2002; Impellizzeri & Marcora, 2007; Impellizzeri et al., 2005a; Impellizzeri et al., 2005b; Lee et al., 2002; Prins et al., 2007; Wilber et al., 1997). From their findings, researchers have subsequently suggested that relative measures of aerobic capacity and power, and
anaerobic power may correlate more closely with success in off-road cycling.
Interestingly, these measures have exclusively been scaled to overall body mass and not to fat free mass (FFM), even though body composition among mountain bikers has been reported in the literature (Lee et al., 2002; Wilber et al., 1997). Since laboratory
measures are often the most convenient and controllable methods of assessment, identifying the most accurate measures is of utmost importance to sports scientists, coaches, and athletes.
bikers, the purposes of this study are to (a) describe peak aerobic power output,
maximum aerobic capacity, maximum anaerobic power, and off-road cycling climbing ability (vertical feet per second) in absolute terms as well as relative to body mass (BM) and (b) to examine the correlation between these variables and race performance time in regionally competitive mountain bike racers. By scaling relative performance measures to body mass, this study aims to add evidence to the sparse data that exist on this growing population.
To achieve the purposes of this study, laboratory and field-based measures are used to describe physiological characteristics of off-road cyclists. Body composition (including body mass, percent body fat, and fat free mass) of each athlete is also determined and used to establish relative values for tests obtained in the lab or in the field. Finally, all measures, relative and absolute, are correlated with field measures obtained through completion of a closed time trial and presented in the results.
Research Questions
The first research question is: What are the sport physiological and
anthropometric characteristics of non-elite male mountain bike racers? Secondly, are laboratory-based methods of assessment highly correlated with field-based methods of assessment (r>0.70)? Thirdly, are relative measures of fitness better predictors of off-road cycling performance versus absolute measures?
Hypotheses
1. Compared to other cyclists, regionally competitive mountain bike riders will possess elevated levels of both aerobic and anaerobic fitness as evidenced by their performance in an incremental cycling test to exhaustion, and an anaerobic power test (Wingate test).
2. Climbing ability, determined by a field-based time trial, will significantly and positively correlate with laboratory-based physiological parameters (r > 0.70). 3. Relative values for all measures (field and laboratory-based) will correlate more
highly with overall race performance time than will absolute values.
Delimitations
It is assumed that all participants are in good physical condition and have spent the necessary time training for such cycling-specific tests. Subjects are also assumed to have completed the questionnaire as fully and as accurately as possible and put forth maximal effort during all tests and events. A total of fourteen regionally competitive mountain bike riders with a minimum of 12 months off-road cycling experience were recruited for this study.
Limitations
Definitions
Lactate Threshold
The exercise intensity that elicits an increase in blood lactate concentration of 1 mmol·L-1 above baseline (LT).
Maximum Aerobic Capacity
The point at which an individual can no longer increase the amount of oxygen consumption (VO2max).
Maximal Anaerobic Power
The highest observed power output (in watts) produced during a Wingate test (Wmax).
Onset of Blood Lactate Accumulation
The exercise intensity that elicits a blood lactate concentration of 4 mmol·L-1 or greater (OBLA).
Peak Aerobic Power
The highest calculated power (in watts) determined by an incremental cycling test to exhaustion (Wpeak).
Vertical Feet per Second
CHAPTER 2: LITERATURE REVIEW
The purpose of this literature review was to examine the research related to the study of cross-country mountain biking. Sections of this literature review include: (a) a description of the levels of competition in off-road cycling (i.e., categories), (b)
anthropometric profiles of off-road cyclists, (c) physiological profiles of off-road cyclists and (d) positive correlates (predictors) of off-road cycling performance. Special attention was paid to the methodology, results, and implications of prior works, along with a small amount of information gathered from similar studies with road cyclists. This information not only serves as the basis of investigation but also as comparative information to the current study.
Race Categories
Road Racing
In order to assure races with riders of similar ability, road cyclists are grouped by category depending on experience and prior performance. Typically, beginning racers are placed in the Category 5 group until they have accumulated ten races considered mass start (NOTE: This excludes time trials, triathlons, etc.). In order to move up to a
Mountain Bike Racing
Unlike road racing, riders entering off-road cycling competitions generally have the ability to choose in which discipline they race. Additionally, there are usually only three levels of MTB racing (beginner, sport, and expert), with varying distances for each group. It is thus up to the competitor to self select their race category based either on desired length of race or competition level.
Anthropometric Profiles of Off-Road Cyclists
Compared to traditional road bikers, male off-road cyclists are significantly
lighter, in terms of mass (kg), and leaner in terms of body composition (percent body fat). Lee et al. (2002) found that the average body mass of elite mountain bike competitors was 65.3 kg ± 6.5kg, compared to 74.7 ± 3.8kg among professional road cyclists. In addition, mountain bikers were leaner with an average skin fold sum of 33.9 ± 5.7mm compared to 44.5 ± 10.8mm in road cyclists (Lee et al., 2002). These skin fold values yielded mean body fat estimates of 6.1 ± 1.0% and 7.9 ± 1.8% for mountain and road cyclists, respectively. All three of these anthropometric measurements (e.g., body mass, sum of skin folds, and body fat) were significantly different between road and off-road cycling groups with reported absolute percent differences of 14%, 31%, and 29%, respectively.
When examining lean body mass (LBM), NORBA men and women had 67.3 ± 7.0kg and 49.9 ± 3.8kg of LBM, respectively, compared to 68.4 ± 7.2kg and 53.2 ± 3.0kg for USCF men and women, respectively. Differences in body mass and LBM, however, were statistically non-significant, suggesting that the anthropometric measures between elite road and off-road cyclists are less relevant; even though they may be practically important.
Physiological Profiles of Off-Road Cyclists
Maximal Aerobic Capacity
Previous cycling research is dominated by studies focusing on the attributes, characteristics, and physiological profiles of road cyclists (Glaister, Stone, Stewart, Hughes, & Moir, 2006; Lucia, Joyos, & Chicarro, 2000; Mujika & Padilla, 2001). Research examining these same parameters among off-road cyclists suggests that there are significant and important differences between mountain bikers and other athletes as well as other cyclists. In a study comparing National and World Cup competition level male off-road cyclists to a control group of male sports students, Baron (2001)
demonstrated that when compared to non-cycling athletes, mountain bikers had
significantly higher values for both aerobic and anaerobic measures. Maximum aerobic capacity (VO2max) for male off-road cyclists was 68.4 ± 3.8 ml·kg-1·min-1, whereas values
maximum power (IsoWpeak) obtained anaerobically through repeated bouts of isokinetic
cycling and multiplying the result by 100 (Baron, 2001). Mean anaerobic power output during the same isokinetic cycling test was significantly higher in mountain bikers for all cadences (e.g., 50-140 revolutions per minute) compared to the control group (Baron, 2001).
Higher and lower values for aerobic capacity have been reported in other studies examining physiological profiles of off-road cyclists. Impellizzeri et al. (2005a) reported a mean VO2max of 76.9 ±5.3 ml·kg-1·min-1 in internationally competitive male mountain
bikers, whereas Gregory et al. (2007) demonstrated a maximum aerobic capacity of 64.8 ± 8.2 ml·kg-1·min-1 for trained but non-elite male mountain bikers. This VO2max range is
common throughout the literature and is useful when identifying the performance level of subjects due to the historical acceptance of aerobic capacity as a positive determinant for success in endurance events.
Incremental Cycling Tests (Peak Power Output)
As previously mentioned, peak power output (W) is a second measurement that is often considered when testing cycling ability. One method of obtaining peak power is through an incremental cycling test on an ergometer, in which the individual is required to maintain a particular cadence (pedal revolutions per minute) while power requirements are increased by predetermined increments, often ranging from 1 W·kg-1 every 3 minutes
to 30 W·min-1 (Anton et al., 2007; Bentley, McNaughton, Thompson, Vleck, &
only slightly depending on the specific protocol. Incremental cycling tests are typically highly reliable among participants unfamiliar with a protocol when given two
familiarization sessions (Glaister, Stone, Stewart, Hughes, & Moir, 2003)
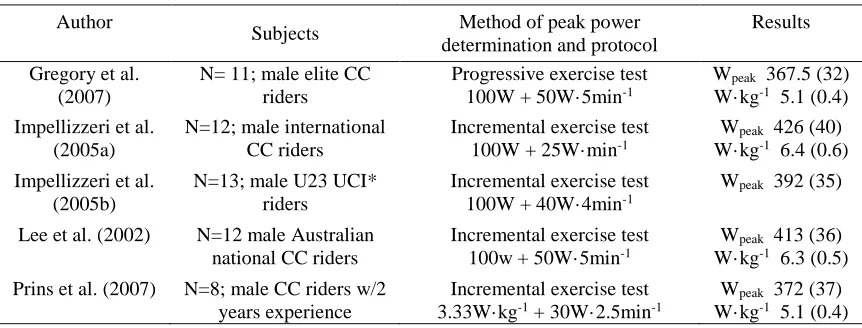
Table 1 presents peak power data among male off-road cyclists obtained through incremental cycling tests. Gregory et al. (2007) and Impellizzeri et al. (2005a) reported peak aerobic power among highly trained male riders ranging from 367 to 426 watts. Similar results were reported by Impellizzeri et al. (2005b), Lee et al. (2002), and Prins et al. (2007) who demonstrated a range of peak power among male cross-country MTB riders of 372 to 413 watts. When scaling these measures relative to body mass, power output varies even less among the same subjects with reported figures ranging from 5.1 to 6.6 W·kg-1 (Gregory et al., 2007; Impellizzeri et al., 2005a). This level of relative power places these subjects in a performance category ranging from high or elite, to national or international caliber cyclists.
higher relative aerobic power among mountain bikers than road cyclists (Lee et al., 2002). These data also suggests that in mountain biking, relative measures may be more indicative of off-road cycling ability. It appears as if high power-to-weight ratios are critical for cross-country racing success (Lee et al., 2002).
Table 1 Summary of Incremental Test Results for Male Off-Road Cyclists
Author
Subjects Method of peak power
determination and protocol
Results
Gregory et al. (2007)
N= 11; male elite CC riders
Progressive exercise test
100W + 50W·5min-1
Wpeak 367.5 (32)
W·kg-1 5.1 (0.4)
Impellizzeri et al. (2005a)
N=12; male international CC riders
Incremental exercise test
100W + 25W·min-1
Wpeak 426 (40)
W·kg-1 6.4 (0.6)
Impellizzeri et al. (2005b)
N=13; male U23 UCI* riders
Incremental exercise test
100W + 40W·4min-1
Wpeak 392 (35)
Lee et al. (2002) N=12 male Australian
national CC riders
Incremental exercise test
100w + 50W·5min-1
Wpeak 413 (36)
W·kg-1 6.3 (0.5)
Prins et al. (2007) N=8; male CC riders w/2 years experience
Incremental exercise test 3.33W·kg-1 + 30W·2.5min-1
Wpeak 372 (37)
W·kg-1 5.1 (0.4)
*Union Cycliste International
Wingate Test (Average and Maximal Power Output)
The Wingate test is performed using a mechanically braked cycle ergometer on which the individual performs an all-out-effort for 30 seconds; a modified test of 15 seconds is also used (Del Coso & Mora-Rodriguez, 2006). Typically, researchers are able to quantify maximal power, average power, and a fatigue index using the Wingate protocol. Tanaka, Basset, Swensen, & Sampedro (1993) found variations in maximal power based on racing category. For example, male category 2 racers averaged 994.07 Wmax while category 3 and 4 racers averaged 985.17 and 923.41 Wmax, respectively
(Tanaka et al., 1993). Relative measures of maximal power (Wmax·kg-1) also increased
with an increase in competition level (e.g., 13.86, 13.55, and 12.80 W·kg-1 for categories
although consistent among subjects, was not statistically significant. When examining relative average power (Wmean) over the duration of the test, significant differences were
seen between category 2 and category 4 cyclists with groups averaging 11.22 and 10.4 W·kg-1, respectively (Tanaka et al., 1993). Lastly, fatigue index, described as the amount that power decreased during the trial, was similar between all categories with average percent fatigue values of 34.25, 33.46, and 36.65% for categories 2 through 4,
respectively (Tanaka et al., 1993).
Typical maximal power in highly trained athletes from other sports ranges from 10.0 W·kg-1 in middle-distance runners to 13.5 W·kg-1 in volleyball players
(MacDougall, Menger, & Green, 1991). Above average values for anaerobic power in cyclists may be due to one of two conditions: (1) The Wingate test is a highly sport-specific performance test, and (2) certain cycling training protocols, such as high intensity interval training, have been shown to improve all-out sprint performance (Tanaka et al., 1993). Also, the Wingate test is suggested as an acceptable and “important tool for assessing the relative potential of sub-elite competitive cyclists” (Tanaka et al., 1993).
Energy System Considerations
As an activity that extends beyond two hours from start to finish, mountain biking heavily utilizes the aerobic energy system for the production of energy. It is also
off-road cyclists. Baron (2001) tested 25 elite mountain bikers and 60 control non-cyclist sport students for maximal anaerobic power during several 10-second all-out isokinetic cycling tests at different cadences; a maximal aerobic (incremental) power test was also conducted. Using the power index, calculated by dividing the average maximum aerobic power (Wmax) by the average maximum anaerobic power (IsoWpeak) and multiplying the
result by 100, Baron (2001) found that this aerobic contribution ranged from 55-60% in the trained group. The power index, which may be a better predictor of aerobic and anaerobic contributions rather than physical fitness levels, considers both aerobic and anaerobic abilities of an individual and presents the data as a ratio. This value helps to identify which energy system an athlete needs to train more, depending on their specific event or sport (Baron, 2001). It was suggested that for optimal performance in off-road cycling events, riders should have a power index of 40-45% (Baron, 2001). In other words, an off-road cyclist should be able to produce 40-45% of their maximum anaerobic power, through aerobic pathways or during aerobic tests (Barron, 2001). Ratios outside of that range require improvements in either maximal power output, or in sustainable aerobic work loads.
Exercise Intensity during Off-Road Cycling
Despite the reported significant aerobic contributions required for successful mountain biking, as well as the extended duration of an event, off-road cyclists typically compete at high percentages of their maximum heart rate (HRmax) and aerobic capacity
(VO2max). As previously mentioned, this is a testament to the high level of aerobic power
demonstrated an average working percentage of 90% of HRmax over the course of four
races ranging from 133-148 minutes in length. Also, the percentage of time spent in the “moderate” or “hard” zone, defined as intensities between the lactate threshold (LT) and the onset of blood lactate accumulation (OBLA), and above OBLA respectively, ranged from 74-88% of the total race time (Impellizzeri et al., 2002). In terms of percentage of VO2max, the same five cyclists recorded an average %VO2max over the course of four races
of 84 ± 3% (Impellizzeri et al., 2002). Such high work rates suggest that elite mountain bikers are exceptionally well trained, both aerobically and anaerobically, and that they are able to sustain near maximum efforts for over two hours.
Wirnitzer and Kornexl (2008) found similar results when examining exercise intensities among seven amateur off-road cyclists during an 8-day marathon
cross-country race. Prior to competition, incremental cycling tests were used to determine peak power, VO2max, and heart rates associated with four fixed intensities. Exercise intensities
were defined as low, moderate, high, and very high based on blood lactate thresholds of 2, 4, 6, and greater than 6 mmol·L-1, respectively (Wirnitzer and Kornexl, 2008). Results from competition illustrated that subjects spent 27-36% of the race at an exercise
intensity defined as high and very high as evidenced by heart rates maintained at 79% of laboratory maximum, and 85% of maximum HR during competition (Wirnitzer and Kornexl, 2008). Such evidence suggests that regardless of competition level, work loads specifically in terms of a percentage of maximum are comparable among mountain bikers, and indicative of the significant metabolic demands of cross-country cycling.
With the ultimate goal of exercise scientists and coaches being the assessment of an athlete’s current condition and prediction of his or her future performance, many authors have correlated physiological attributes to competition results. Gregory et al. (2007) tested eleven elite male off-road cyclists using a progressive exercise laboratory test and a field-based 15-km time trial. With an average peak aerobic power output of 367.5 ± 32.0 (W) obtained in the lab and an average time trial completion time of 61:33 ± 6:12 (min:sec), variables were correlated to identify their relationship. Absolute
measures of power output (W) correlated positively with time trial performance time (r=0.64). When scaled to body mass, however, a much higher correlation was found between relative peak power (W·kg-1) and overall time to complete the time trial (r=0.93) (Gregory et al., 2007). Additionally, relative VO2max (ml·kg-1·min-1) was more highly
correlated with TT performance (r=0.80) than was absolute VO2max (L·min-1) (r=0.66)
(Gregory et al., 2007). The authors therefore suggested that a rider’s ability to produce elevated work loads relative to his or her mass may better predict performance compared to absolute measures.
Similar studies have also shown a relationship between lab measures and field-based tests. Impellizzeri et al. (2005b) demonstrated significant relationships between cross-country competition performance (time) and relative physiological variables, including relative peak oxygen uptake (ml·kg-1·min-1) (r=0.62), overall peak power (W) (r=0.76), power at OBLA (WOBLA)(r=0.89), and power at LT (WLT) (r=0.86). These
performance time when scaled to body mass raised to a factor of 0.79, which takes into account weight differences among individuals. Accounting for this difference in body mass, correlations between competition time and peak oxygen uptake (ml·kg-1·min-1), overall peak power (W), power at OBLA, and power at LT (WLT) increased to r= 0.68,
r=0.87, r=0.94 and r= 0.90, explaining 80% of the variance in time trial performance (Impellizzeri et al., 2005b). Scaling to a body mass raised to a factor of 0.79 is thought to enhance relationships based on allometric scaling of energy requirements during uphill cycling (as cited in Impellizzeri et al., 2005a).
In highly elite MTB riders, correlations between physiological measures and performance are not always as clear. Impellizzeri et al. (2005a) demonstrated only moderately significant correlations between laboratory variables and cross-country performance when examining fifteen internationally competitive male mountain bikers. Most notably, relative power output (W·kg-1) and oxygen consumption (ml·kg-1·min-1) at the respiratory compensation point (RCT) showed correlations of r = -0.63 and r = -0.66, respectively (Impellizzeri et al., 2005a). The respiratory compensation point was defined as “an increase in Ve/Vo2 and Ve/Vco2, the second sustained rise in excess CO2, and the
second increase in the slope of the Vco2 v Vo2 plot” and was included in data collection
In order to more accurately predict performance, the development of sport-specific tests is essential. Early studies have attempted to develop cycling tests that would more accurately predict mountain bike performance. Unlike road cycling, cross-country mountain biking contains a much higher level of variability in both terrain and intensity. Prins et al. (2007), in an effort to develop such a test, compared both field and laboratory tests to competition performance in eight competitive male MTB riders. Subjects competed in an outdoor competition, and performed an incremental cycling test, a 1-kilometer time trial, and two variable fixed intensity conditions. Variable fixed-intensity trials were designed using each subject’s maximum heart rate and peak power output obtained via the incremental cycling test. Subsequently, a simulated course was designed and implemented using relative percentages of each participant’s HR and peak power. The course was also designed to include “rest periods” (portions of lower intensity), which are expected features during a mountain bike competition (Prins et al., 2007). Finally, the simulation was modeled after the average time for participants to complete one lap of the original competition course (26 minutes). The first condition required a single simulated lap, while the second condition required two laps (52 total minutes).
(outdoor tests). These findings suggest that when assessing MTB ability, it may be more important to consider measures of peak aerobic power output during an incremental cycling test than values of maximum oxygen consumption. Therefore, maximum oxygen consumption, though important, may contribute less to performance prediction in outdoor tests than the peak aerobic power output during the same test, despite the documented high aerobic demands of cross-country cycling.
Although there are several studies that assess relative physiological variables scaled to overall body mass in off-road cyclists, there are no studies to date that scale measures to fat free mass (FFM) or lean body mass (LBM). Since body composition among mountain bikers has been reported in the literature, along with the belief that body weight affects a cyclists climbing ability, it stands to reason that relative measures scaled to LBM may also demonstrate significant relationships with other variables.
Climbing ability itself is another variable that has received virtually no attention among mountain biking research. As previously discussed, a vast majority of time spent competing in a typical cross-country mountain bike race is ascending great vertical distances, yet to the best of our knowledge, no studies have assessed this ability directly among the MTB population. Tests that provide information on a cyclist’s ability to ascend a vertical distance at a given rate may prove useful in mountain bike research and athlete assessments. From the previous literature review, no such tests were found. Due to this oversight in the existing literature, a “vertical feet per second” (VFS) assessment is included in the current study in an attempt to describe climbing ability within our
CHAPTER 3: METHODS
Subjects
Subjects participating in the Coyote Classic mountain bike race in Boise, Idaho were recruited to participate in this study via emails and a list-serve notification of this project. Male off-road cyclists (N=14) ranging in age from 20-55 years with a minimum of 12 months of training experience were selected for this study. Each participant was part of a local club or team and regionally competitive, participating in a minimum of two events during the previous cycling season and finishing within the top 30% of their respective class in at least one race. Also, average weekly training volume was considered (minimum of 5 hrs per week) when selecting subjects, and all testing was done within the competitive season. All participants were fully informed of the aims of the study, laboratory and field-testing procedures, and the potential risks and benefits incurred through testing. This project was approved by the Institutional Review Board of Boise State University, and informed consent was obtained from each subject.
Experimental Design
testing at any point and for any reason. All anthropometric testing was performed on the Boise State University campus (Boise, ID) in the Human Performance Laboratory. Incremental cycling tests as well as Wingate Tests were conducted at the Idaho Sports Medicine Institute (Boise, ID). The field-based time trial was completed in the Boise City foothill trail system on a section of the Homestead trail (#12).
Procedures
Day 1 - Anthropometric and Training Information
On day one, subjects reported to the Boise State University campus Human Performance Laboratory for anthropometric measurements, including height (cm), weight (kg), and body composition (% body fat). Both height and weight of each subject were measured using a standing physician scale and stadiometer (Healthometer, Healthometer Inc, Bridgeview, Illinois, USA). All participants were measured without shoes and in minimal clothing.
Body composition was determined using under water weighing techniques described by Hoeger & Hoeger (2008). Subjects were instructed to wear bathing suits or compression shorts that were form-fitting and limited the trapping of air within the suit. After entering the under-water weighing device (EXERTECH Body Density
trials being used for body composition determination. Percent body fat (%BF) was then calculated using the Siri equation (Hoeger & Hoeger, 2008):
%BF = [495-BD] – 450
where BD (body density) was determined by the formula:
BD = __________BW___________ BW-UW - RV - .1
WD
where BW is body weight in kilograms, UW is the calculated average underwater weight in kilograms, WD is water density calculated from its temperature during testing, and RV is estimated residual lung volume (Hoeger & Hoeger, 2008). All calculations were performed using attached software (EXERTECH Weighing and Densitometry Program. Version 2), which displayed both underwater weight for each trial and %BF based on the calculated average of the 3 heaviest trials.
After all anthropometric measurements were recorded, each subject was asked to complete a questionnaire detailing their training habits. This survey provided
information concerning the frequency, duration, intensity, and mode of training. Data collected here were used to more accurately describe the current subject sample and their training habits.
Day 2 - Maximum Aerobic Capacity
Pettersson, & Schagatay, 2007). To determine VO2max, an incremental cycling test was
conducted on a mechanically braked cycle ergometer (Lode, Excalibur Sport,
Netherlands) at the Idaho Sports Medicine Institute (Boise, Idaho). Proper adjustments were made to the set up of the bike in order to match each rider’s normal riding position. Subjects began by warming up for a period of ten minutes at a self-selected pace. Initial load was set to 100 W and increased by 50 W every two minutes until volitional
exhaustion or the subject was unable to maintain their cadence. Cadence, load starting point, and increase requirement selection was based on previous studies by Impellizzeri et al. (2005b) and Wilber et al. (1997) who suggested that mountain bikers prefer, and often utilize, higher pedaling rates because they cause less neuromuscular fatigue.
Failure to maintain a selected cadence during the test resulted in termination of the test. Direct gas analysis was performed using a ParvoMedics Truemax 2400 Metabolic Measurement System (ParvoMedics, Sandy, UT), which continuously measured
inspiration of oxygen (VO2) and the expiration of carbon dioxide (VCO2). Calibration of
the metabolic cart was conducted prior to each trial using standard gas, and the
pneumotach flowmeter was calibrated with a 3-liter calibrating syringe. Subjects were required to wear a mask and nose clips to ensure that all expired air was collected. Heart rate was monitored using a wireless wrist unit with chest belt (Polar, USA), and heart rates were recorded during the last 10 seconds of each stage.
exchange ratio (RER) greater than 1.1 (indicating anaerobic metabolism), and (c) an oxygen consumption plateau, defined as “<150 ml·min-1 difference in oxygen
consumption, for the final two stages” (Prins et al., 2007). When an individual was unable to complete a stage during the incremental test, peak power was calculated using the following equation:
Wpeak = Wf + (t/120 · 50)
where Wf is the last completed stage in watts, and t is the time (sec.) spent in the final
stage (adapted from Impellizzeri et al., 2005b).
Day 3 - Maximum Anaerobic Power
Maximum power output is produced through stored ATP, phosphorcreatine (PCr) utilization, and glycogenolysis resulting in the production of lactate (Faria et al., 2005). The Wingate test, one of the mostly widely accepted and used determinants of anaerobic power, was used to obtain values for maximum power (Wmax), average power (Wmean),
and fatigue rate (expressed as a percentage of power lost from peak power over the duration of the protocol) (Del Coso & Mora-Rodriguez, 2006). Validity and reliability of the Wingate Test, a well-accepted measure of anaerobic power, have been described by Minahan, Chia, & Inbar (2007).
fitted with clipless pedals of each athlete’s preference, competition handle bars, and a racing saddle to closely resemble most participants’ own equipment.
Testing procedures followed the protocol described by Del Coso and Mora-Rodriguez (2006) in which each subject began by warming up at a resistance of 0.5kg for five minutes. After the warm-up period, a load equal to 0.075kg per kg of body mass was rapidly added. As the load was added, each participant produced an all-out-effort for a period of thirty seconds. Verbal encouragement was provided to aid in a maximum effort of each subject. During the trial, power outputs were recorded every five seconds and used to determine maximum anaerobic power, average power, and fatigue rate (described as the decrease in watts per second for the duration of the test).
Day 4 - Vertical Feet per Second (VFS)
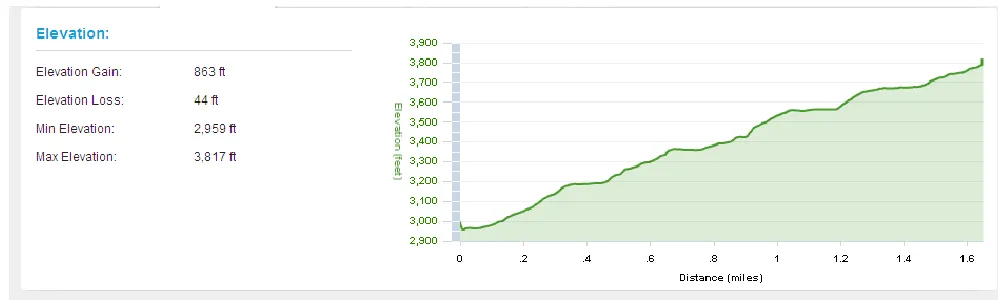
On day 4, each subject completed a 2.72-kilometer (1.65 mile) time trial on their own selected mountain bike. A detailed profile of the course, including distance and change in elevation, is presented in Figure 1. Development of the course was conducted through the use of three mock trials using a Garmin Forerunner 405HR GPS unit. Careful consideration was given to technical aspects of the course to eliminate the
Figure 1 Time trial profile (* Device: Garmin Forerunner 405Hr. Version 2.15)
On the fourth day of testing, all subjects arrived at the TT site and were briefed on the testing protocol. Each rider was allowed to select his own bicycle and to make all adjustments (tire pressure, suspension changes, etc.) that he felt necessary with the assumption that each rider would post his best finishing time possible based on his own preferences. The warm up routines were also unique to each cyclist. To limit the possibility of any rider blocking another on a narrow section of single-track, riders were staged 2 minutes apart. Overall completion time was recorded in seconds.
Each subjects’ absolute vertical feet per second variable was determined by the rate at which they climbed the total elevation by the equation:
VFS = X·t-1
where X is the total vertical feet ascended, and t is the time in seconds to complete the ascent. Relative measures of VFS were calculated using the equation:
where X is the total vertical feet ascended, t is the time in seconds to complete the ascent, and kgis the subject’s body mass in kilograms.
Statistical Analysis
All anthropometric, physiological, and competition variables were entered into the Statistical Package for the Social Sciences (SPSS for Windows version 19.0, SPSS Inc.). To answer research question one, descriptive statistics and variance were
CHAPTER 4: RESULTS
Subjects
A total of 14 subjects were recruited to participate in laboratory and field-based cycling tests. Self assessment of these athletes was gathered through a pre-study
questionnaire detailing cycling ability (determined by race category), as well as training habits (determined by hours trained per week), including cycling-specific training, cross training, etc., over the course of the previous year. Cycling experience was then
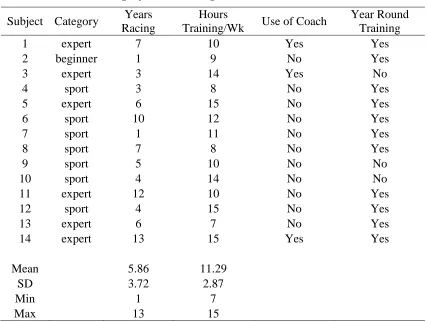
determined based on years spent competing and by races completed per year (see Table 2).
Results of the questionnaire showed that sixcyclists were designated as
Table 2 Race Category and Training Habits
Subject Category Years Racing
Hours
Training/Wk Use of Coach
Year Round Training
1 expert 7 10 Yes Yes
2 beginner 1 9 No Yes
3 expert 3 14 Yes No
4 sport 3 8 No Yes
5 expert 6 15 No Yes
6 sport 10 12 No Yes
7 sport 1 11 No Yes
8 sport 7 8 No Yes
9 sport 5 10 No No
10 sport 4 14 No No
11 expert 12 10 No Yes
12 sport 4 15 No Yes
13 expert 6 7 No Yes
14 expert 13 15 Yes Yes
Mean 5.86 11.29
SD 3.72 2.87
Min 1 7
Max 13 15
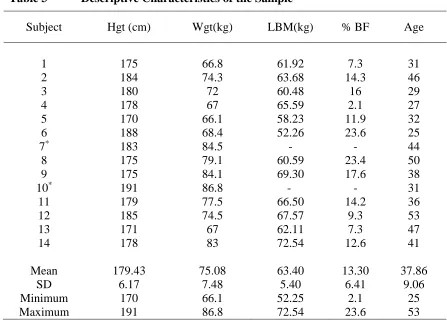
Table 3 Descriptive Characteristics of the Sample
Subject Hgt (cm) Wgt(kg) LBM(kg) % BF Age
1 175 66.8 61.92 7.3 31
2 184 74.3 63.68 14.3 46
3 180 72 60.48 16 29
4 178 67 65.59 2.1 27
5 170 66.1 58.23 11.9 32
6 188 68.4 52.26 23.6 25
7* 183 84.5 - - 44
8 175 79.1 60.59 23.4 50
9 175 84.1 69.30 17.6 38
10* 191 86.8 - - 31
11 179 77.5 66.50 14.2 36
12 185 74.5 67.57 9.3 53
13 171 67 62.11 7.3 47
14 178 83 72.54 12.6 41
Mean 179.43 75.08 63.40 13.30 37.86
SD 6.17 7.48 5.40 6.41 9.06
Minimum 170 66.1 52.25 2.1 25
Maximum 191 86.8 72.54 23.6 53
* Subjects not completing body composition analysis
Laboratory Tests
Maximum Aerobic Capacity
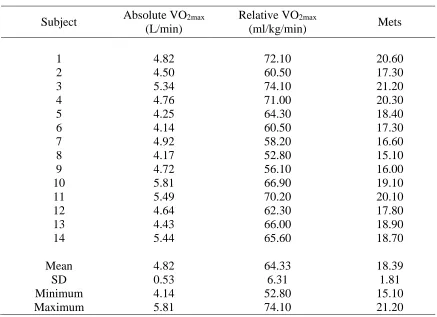
Full incremental cycling test results for VO2max are presented in Table 4. The
average absolute maximum aerobic capacity (L·min-1) was 4.82 + 0.53 (range = 4.14 to
5.81). When scaled to body mass, participant average relative aerobic capacity was 64.33 mL·kg-1·min-1 + 6.31 (range = 52.8 to 74.10). The average maximum metabolic
equivalent (MET) obtained during VO2max testing was 18.39 + 1.81 (range = 15.10 to
Table 4 VO2max Results for the Sample
Subject Absolute VO2max (L/min)
Relative VO2max
(ml/kg/min) Mets
1 4.82 72.10 20.60
2 4.50 60.50 17.30
3 5.34 74.10 21.20
4 4.76 71.00 20.30
5 4.25 64.30 18.40
6 4.14 60.50 17.30
7 4.92 58.20 16.60
8 4.17 52.80 15.10
9 4.72 56.10 16.00
10 5.81 66.90 19.10
11 5.49 70.20 20.10
12 4.64 62.30 17.80
13 4.43 66.00 18.90
14 5.44 65.60 18.70
Mean 4.82 64.33 18.39
SD 0.53 6.31 1.81
Minimum 4.14 52.80 15.10
Maximum 5.81 74.10 21.20
Peak Aerobic Power
Table 5 Aerobic Power Results for the Sample
Subject Absolute Peak Aerobic Power (W) Relative Peak Aerobic Power (W/kg)
1 415 6.21
2 356 4.79
3 430 5.97
4 362 5.4
5 363 5.49
6 350 5.12
7 395 4.67
8 333 4.21
9 385 4.58
10 481 5.54
11 442 5.65
12 387 5.19
13 350 5.22
14 420 5.06
Mean 390.64 5.22
SD 42.32 0.55
Minimum 333 4.21
Maximum 481 6.21
Maximum Anaerobic Power
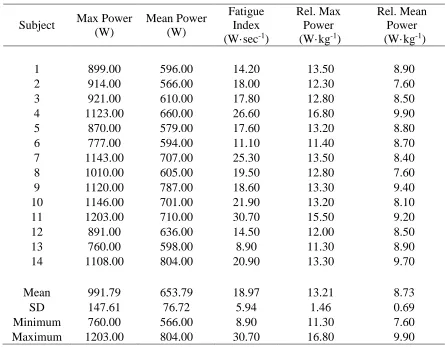
Table 6 Maximum Power Results for the Sample
Subject Max Power (W)
Mean Power (W)
Fatigue Index (W·sec-1)
Rel. Max Power (W·kg-1)
Rel. Mean Power (W·kg-1)
1 899.00 596.00 14.20 13.50 8.90
2 914.00 566.00 18.00 12.30 7.60
3 921.00 610.00 17.80 12.80 8.50
4 1123.00 660.00 26.60 16.80 9.90
5 870.00 579.00 17.60 13.20 8.80
6 777.00 594.00 11.10 11.40 8.70
7 1143.00 707.00 25.30 13.50 8.40
8 1010.00 605.00 19.50 12.80 7.60
9 1120.00 787.00 18.60 13.30 9.40
10 1146.00 701.00 21.90 13.20 8.10
11 1203.00 710.00 30.70 15.50 9.20
12 891.00 636.00 14.50 12.00 8.50
13 760.00 598.00 8.90 11.30 8.90
14 1108.00 804.00 20.90 13.30 9.70
Mean 991.79 653.79 18.97 13.21 8.73
SD 147.61 76.72 5.94 1.46 0.69
Minimum 760.00 566.00 8.90 11.30 7.60
Maximum 1203.00 804.00 30.70 16.80 9.90
Notes:
Rel. Max Power – Relative maximum power when scaled to body mass Rel. Mean Power – Relative average power when scaled to body mass
Field Test
Time Trial
Full time trial results are presented in Table 7. Average participant time to complete the time trial (seconds) was 944.17 + 126.60 (range = 746 to 1206). The average for absolute vertically ascended feet (ft·sec-1) was 0.93 + 0.12 (range = 0.72-1.16) with an average relative VFS (ft·sec-1·kg-1) of 0.0126 + 0.0022 (range = 0.0096 to 0.073).
Table 7 Time Trial Results for the Sample
Subject Time Trial (sec) Absolute VFS (ft·sec-1)
Relative VFS (ft·sec-1·kg-1)
1 746.00 1.16 0.0173
2 1206.00 0.72 0.0096
3* - - -
4 946.00 0.91 0.0136
5 927.00 0.93 0.0141
6 982.00 0.88 0.0128
7* - - -
8 1087.00 0.79 0.0100
9 1054.00 0.82 0.0097
10 886.00 0.97 0.0112
11 820.00 1.05 0.0136
12 953.00 0.91 0.0122
13 891.00 0.97 0.0145
14 832.00 1.04 0.0125
Mean 944.17 0.93 0.0126
SD 126.60 0.12 0.0022
Minimum 746.00 0.72 0.0096
Maximum 1206.00 1.16 0.0173
*Subjects not completing time trial
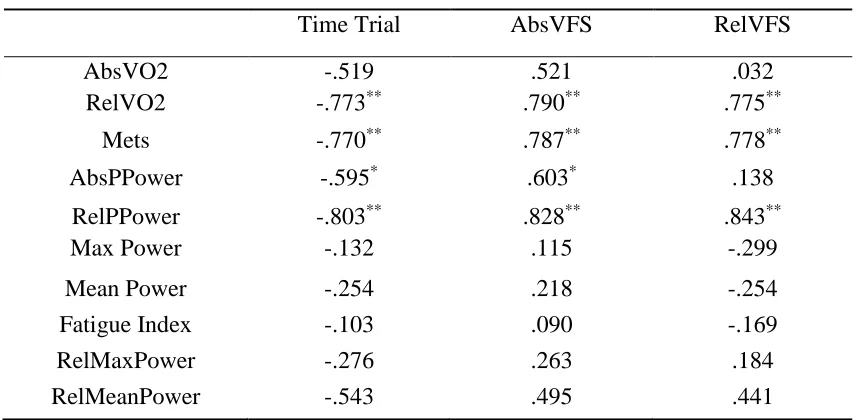
Correlations
and relative VFS, respectively. Additionally, relative maximum aerobic capacity
(VO2max) and METS were significantly correlated with Time Trial (r = -0.773 and -0.770,
respectively), absolute VFS (r = 0.790 and 0.787, respectively), and relative VFS (r = 0.775 and 0.778, respectively. Correlations between absolute VO2max and time trial,
absolute VFS, and relative VFS were lower than the aforementioned correlations for relative values. Significant correlations were also seen between absolute peak power and time trial (r=0.595) and absolute peak power and absolute VFS (r=0.603). Absolute VO2max and relative mean power during the Wingate were moderately correlated with
time to complete the time trial, though these values were statistically insignificant. Table 8 Correlations Between Laboratory and Field Tests in the Sample(r)
Time Trial AbsVFS RelVFS
AbsVO2 -.519 .521 .032
RelVO2 -.773** .790** .775**
Mets -.770** .787** .778**
AbsPPower -.595* .603* .138
RelPPower -.803** .828** .843**
Max Power -.132 .115 -.299
Mean Power -.254 .218 -.254
Fatigue Index -.103 .090 -.169
RelMaxPower -.276 .263 .184
RelMeanPower -.543 .495 .441
** Correlation is significant at the 0.01 level (2-tailed) *Correlation is significant at the 0.05 level (2-tailed) Notes:
AbsVO2 – Absolute VO2max (L·min-1)
RelVO2 – Relative VO2max (mL·kg·min-1)
Mets – Metabolic Equivalents
AbsPPower – Peak aerobic power during incremental cycling test
RelPPower – Relative peak aerobic power during incremental cycling test Max Power – Maximum power output during Wingate Test (W)
Mean Power – Average power output during Wingate Test (W)
Fatigue Index – Percent decline in power output from beginning to end of Wingate RelMaxPower – Maximum power scaled to body mass (W/kg)
CHAPTER 5: DISCUSSION
The purpose of this study was to examine the physiological and anthropometric characteristics of non-elite male mountain bike racers, compare lab-based testing methods to field-based methods, determine which measures are the best predictors of time trial success, and examine whether relative measures of fitness are better predictors of cycling performance compared to absolute measures. The most important findings of this study were that: (a) these athletes were comparable to previously studied samples and demonstrated high absolute and relative aerobic capacity and power, as well as anaerobic power, (b) time trial (seconds) was significantly correlated with relative VO2max and
METS, and both absolute and relative peak aerobic power, meaning that relative VO2max,
METS, absolute peak power, and relative peak power are effective predictors of performance on field tests that simulate racing conditions, and (c) relative VO2max and
relative peak aerobic power were better predictors of off-road cycling performance on a time trial compared to absolute VO2max and absolute peak aerobic power.
The 14 non-elite riders in this sample who had been racing an average of more than 5 years and who trained approximately 11.29 + 2.87 hours per week were similar to previous samples of non-elite riders (age = 37.86y; height = 179.43cm weight = 75.08kg; %bf = 13.3). When reviewing anthropometric data specifically, all participants
has described both physical and physiological characteristics of competitive mountain bikers. These results confirm an appropriately selected subject pool such that valid measures were taken and results can be generalized accordingly. This study also provides additional data describing the anthropometric uniqueness of off-road cyclists.
The application of laboratory tests to determine athletic ability in endurance athletes has been a mainstay of assessment for some time now. The challenge, however, has been linking lab results to competitive performance. In off-road cycling, specifically cross-country mountain biking, measures of maximum aerobic capacity, peak aerobic power output, maximum anaerobic power and the relative expression of these numbers based on rider weight have been identified as useful assessment tools (Gregory et al., 2007; Impellizzeri et al., 2002; Impellizzeri & Marcora, 2007; Impellizzeri et al., 2005a; Impellizzeri et al., 2005b; Lee et al., 2002; Prins et al., 2007; Wilber et al., 1997). The common finding of many recent studies has been that relative measures (when scaled to body mass), rather than absolute values are more valuable for determining cycling ability (Gregory et al., 2007). This is, in part, thought to be the result of improved exercise economy or efficiency in the case of higher relative lab values. Despite this evidence, it is a challenge to apply lab findings to live competition. This investigation was designed to include a field cycling test and determine its usefulness in assessing off-road cycling ability, and what its relationship was to laboratory test values.
bikers and assess a rider’s ability to descend rather than ascend. Thus, this study included an uphill time trial to provide rationale for its use.
Both mean values for absolute and relative VO2max, 4.82 L·min-1 and 64.33 ml·kg -1·min-1, respectively, are similar to prior studies that used an incremental cycling test to
exhaustion. Specifically, Baron (2001) demonstrated a mean relative VO2max of 68.4 +
3.8 ml·kg-1·min-1 among a group of National and World Cup mountain bikers, and Gregory et al. (2007) studied a sample of trained but non-elite male mountain bikers and reported their VO2max as 64.8 ml·kg-1·min-1.
Peak aerobic power obtained during the same incremental cycling test is consistent with previous research as well. From the sample, an average absolute peak power of 390.64 W was observed. This most closely mirrors Impellizerri et al. (2005b) who reported an average peak power among 13 male U23 UCI riders of 392 W.
Additionally, our sample demonstrated an average relative peak aerobic power of 5.22 W·kg-1, which is in accordance with research done by both Gregory et al. (2007) and Prins et al. (2007) who showed average relative peak power of 5.1 W·kg-1 among 11 elite cross-country riders and 8 cross-country riders with 2 years racing experience
respectively (see Table 1).
W·kg-1, compared to 13.86, 13.55, and 12.80 W·kg-1 among category 2, 3, and 4 cyclists, respectively (Tanaka et al., 1993).
The second finding of this study was that lab-based values positively correlated with field-based measures of cycling performance. More specifically, results show that relative values for maximum aerobic capacity (ml·kg-1·min-1) and peak aerobic power (W·kg-1) were more highly correlated with time trial performance measures (time in seconds, absolute VFS, and relative VFS) than was absolute VO2max (L·min-1) and
absolute peak power (W). Of these relationships, relative peak power (W·kg-1) when correlated with relative VFS (ft·sec-1·kg-1), absolute VFS (ft·sec-1), and time trial (sec) demonstrated the highest coefficients (r=0.843, r=0.828, and r=-0.803, respectively). Relative VO2max (mL·kg-1·min-1) and absolute VFS (ft·sec-1) also demonstrated a
significantly high correlation (r=0.790). Looking at relative VO2max and its relationship
to time trial (seconds) and relative VFS, correlations of -0.773 and 0.774 were observed. Absolute VO2max was moderately correlated with time trial (seconds) and absolute VFS, r
= -0.519 and 0.521 respectively, although this relationship was lower and not statistically significant. There was essentially no relationship between absolute VO2max and relative
VFS (r=-0.030).
These findings suggest two unique implications. First, improvements in relative aerobic capacity and peak power may improve cross-country race performance. Second, that assessing a rate of ascent (VFS) may effectively demonstrate a mountain bikers climbing ability. Specifically, improvements in relative aerobic values (VO2max and peak
and thus climbing ability. Therefore, the assessment and development of improved relative aerobic variables should be a priority when training or evaluating cyclists.
The use of a climbing assessment (i.e., VFS) may be an appropriate tool for researchers, coaches, and athletes. Although the concrete value of VFS may show little promise, correlational data does demonstrate a positive relationship between lab values and TT performance. Therefore, athletes and coaches may want to consider utilizing a pre-determined course of their choosing to assess improvements in fitness when laboratory measurements are unavailable. This is particularly useful for coaches and athletes who do not have access or the means to conduct laboratory testing.
An interesting and somewhat unique finding of this study was that relative mean power output (W·kg-1) as determined throughout the duration of the Wingate test was more highly correlated with all measures of time trial performance than relative
It is worth noting that absolute VFS was more highly related to relative maximum power output (r=0.263) and relative mean power output (r=0.495) than was relative VFS when scaled to body mass (r = 0.186 and 0.441, respectively). These findings do not concur with studies that have shown higher correlations when lab values are scaled to body mass, rather than taken absolutely (Impellizzeri et al., 2005b). This is also contradictory to the hypothesis of this study, which had assumed that values relative to body mass would more effectively predict field test performance. Ultimately this study shows that the fastest time trial is the fasted ascent, regardless of body mass or body composition.
This evidence then lends itself to the idea that in addition to training cyclists to their upper limit of power output (maximum power), attention should be paid to
developing their ability to maintain the highest level of power over a given time (aerobic and anaerobic power). This would make sense, due to the highly variable nature of off-road racing with courses containing several sections requiring a cyclist to utilize a large amount of power for short bursts of time (i.e., short repeated climbs).
Conclusions
In the world of coaching and training, the search for an ideal assessment of athletic ability is often sought. For most sports or competitions, however, the complexity of the event does not lend itself to a single measure of performance other than outcome (winning or losing). This is without a doubt a concept consistent within the sport of off-road cycling.
to validate and use them in conjunction with tests that have proven successful in the past. One conclusion made by this research is that no single test can absolutely define a
cyclists ability to perform in a given race or event. Rather, tests must be viewed
collectively in order to gain a more global view of an athlete’s strengths and weaknesses. With that knowledge in hand, it may be beneficial to train all aspects of cycling ability to include maximum power and the ability to maintain and repeat similar efforts.
A second conclusion that can be made from the current study is that a tool, such as a time trial (VFS), may be useful in determining in part a cyclist’s ability outside of the laboratory. Moreover, it may be more useful to determine improvements in fitness or from training when repeated and compared to previous results. For example, in addition to tracking time of VFS, it would be useful to calculate heart rate during this activity to observe changes in heart rate that might occur with consistent training. It may also be helpful to track VFS/HR average during the trial as another measure of fitness that might effectively predict field test performance of off-road cyclists. It is recommended that if a time trial (or similar protocol) is to be used in the assessment of an athlete’s ability, it must be frequently performed in order to gauge progress from his or her current training regimen.
The one exception demonstrated in this study was seen when comparing r-values of relative and absolute VFS with relative peak power. Of the two, relative VFS was more highly correlated with relative peak power than was absolute VFS (0.843 and 0.828, respectively), potentially due to the comparison of two relative measures.
One possible solution to the small expression of VFS would be to extrapolate it to a vertical distance over the period of an hour rather than by minute. By doing this, coaches and athletes may have a more practical measure of ability, while correlations should be maintained. This could also allow for a longer time trial (or test efforts), and more general application of the information gathered. Another way to apply VFS may be to use it to judge fatigue or recovery. If prior to a race an athlete has a given VFS on a particular course, and that measure is repeated, faster or slower times may indicate a increased need to recover before the competition. In other words, if before a live competition a cyclist’s VFS is decreased, that rider may benefit from a break in training to allow adequate recovery.
Future research into the world of off-road cycling performance may benefit from continued investigations into time trail efforts. If they are utilized, coaches and athletes should carefully evaluate not only the characteristics of the course, but also the
characteristics of upcoming races. If possible, it may be most advantageous to perform such tests on the race course itself so as to perfectly match “practice” with
REFERENCES
Anton, M. M., Izquierdo, M., Ibanez, J., Asiain, X., Mendiguchia, J., & Gorostiaga, E. M. (2007). Flat and uphill climb time trial performance prediction in elite amateur cyclists. International Journal of Sports Medicine, 28(4), 306-313.
Baron, R. (2001). Aerobic and anaerobic power characteristics of off-road cyclists.
Medicine and Science in Sports and Exercise, 33(8), 1387-1393.
Bentley, D. J., McNaughton, L. R., Thompson, D., Vleck, V. E., & Batterham, A. M. (2001). Peak power output, the lactate threshold, and time trial performance in cyclists. Medicine and Science in Sports and Exercise, 33(12), 2077-2081. Bentley, D. J., Wilson, G. J., Davie, A. J., & Zhou, S. (1998). Correlations between peak
power output, muscular strength and cycle time trial performance in triathletes.
Journal of Sports Medicine and Physical Fitness, 38(3), 201-207.
Bjorklund, G., Petterson, S., & Schagatay, E. (2007). Performance predicting factors in prolonged exhausting exercise of varying intensity. European Journal of Applied Physiology, 99(4), 423-429
Del Coso, J., & Mora-Rodriguez, R. (2006). Validity of cycling peak power as measured by a short-sprint test versus the Wingate anaerobic test. Applied Physiology Nutrition and Metabolism-Physiologie Appliquee Nutrition Et Metabolisme, 31(3), 186-189.
Faria, E. W., Parker, D. L., & Faria, I. E. (2005). The science of cycling - Factors affecting performance - Part 2. Sports Medicine, 35(4), 313-337.
Glaister, M., Stone, M. H., Stewart, A. M., Hughes, M., & Moir, G. L. (2003). Reliability of power output during short-duration maximal-intensity intermittent cycling.
Journal of Strength and Conditioning Research, 17(4), 781-784.
Glaister, M., Stone, M. H., Stewart, A. M., Hughes, M. G., & Moir, G. L. (2006).
Aerobic and anaerobic correlates of multiple sprint cycling performance. Journal of Strength and Conditioning Research, 20(4), 792-798.
Hoeger W.W.K., & Hoeger, S.A (2008). Principles and Labs for Fitness and Wellness.
Belmont, CA, USA: Wadsworth
Impellizzeri, F., Sassi, A., Rodriguez-Alonso, M., Mognoni, P., & Marcora, S. (2002). Exercise intensity during off-road cycling competitions. Medicine and Science in Sports and Exercise, 34(11), 1808-1813.
Impellizzeri, F. M., & Marcora, S. M. (2007). The physiology of mountain biking. Sports Medicine, 37(1), 59-71.
Impellizzeri, F. M., Marcora, S. M., Rampinini, E., Mognoni, P., & Sassi, A. (2005a). Correlations between physiological variables and performance in high level cross country off road cyclists. British Journal of Sports Medicine, 39(10), 747-751. Impellizzeri, F. M., Rampinini, E., Sassi, A., Mognoni, P., & Marcora, S. (2005b).
Physiological correlates to off-road cycling performance. Journal of Sports Sciences, 23(1), 41-47.
Lee, H., Martin, D. T., Anson, J. M., Grundy, D., & Hahn, A. G. (2002). Physiological characteristics of successful mountain bikers and professional road cyclists.
Journal of Sports Sciences, 20(12), 1001-1008.
Lucia, A., Joyos, H., & Chicarro, J. L. (2000). Physiological response to professional road cycling: Climbers vs. time trialists. International Journal of Sports Medicine, 21(7), 505-512.
MacDougall, J.D., Menger, H.A., & Green, H.J. (1991). Physiological Testing of the High-Performance Athlete. Champaign, IL, USA: Human Kinetics
Minahan, C., Chia, M., & Inbar, O. (2007). Does power indicate capacity? 30-s wingate anaerobic test vs. maximal accumulated O-2 deficit. International Journal of Sports Medicine, 28(10), 836-843.
Mujika, I., & Padilla, S. (2001). Physiological and performance characteristics of male professional road cyclists. Sports Medicine, 31(7), 479-487.
Padilla, S., Mujika, I., Orbananos, J., & Angulo, F. (2000). Exercise intensity during competition time trials in professional road cycling. Medicine and Science in Sports and Exercise, 32(4), 850-856.
Paton, C. D., & Hopkins, W. G. (2001). Tests of cycling performance. Sports Medicine, 31(7), 489-496.
Tanaka, H., Bassett, D. R., Swensen, T. C., & Sampedro, R. M. (1993). Aerobic and anaerobic power characteristics of competetive cyclists in the United-States Cycling Federation. International Journal of Sports Medicine, 14(6), 334-338. USA Cycling. http://www.usacycling.org/news/user/story.php?id=938. Retrieved online
on April 30, 2009.
USA Cycling. http://www.usacycling.org/news/user/story.php?id=946. Retrieved online on May 1, 2009.
Wilber, R. L., Zawadzki, K. M., Kearney, J. T., Shannon, M. P., & Disalvo, D. (1997). Physiological profiles of elite off-road and road cyclists. Medicine and Science in Sports and Exercise, 29(8), 1090-1094.