Patron: Her Majesty The Queen Rothamsted Research Harpenden, Herts, AL5 2JQ
Telephone: +44 (0)1582 763133 Web: http://www.rothamsted.ac.uk/
Rothamsted Research is a Company Limited by Guarantee Registered Office: as above. Registered in England No. 2393175.
Rothamsted Repository Download
A - Papers appearing in refereed journals
Eludoyin, O. M., Adelekan, I. O., Webster, R. and Eludoyin, A. O. 2014.
Air temperature, relative humidity, climate regionalization and thermal
comfort of Nigeria. International Journal of Climatology. 34 (6), pp.
2000-2018.
The publisher's version can be accessed at:
•
https://dx.doi.org/10.1002/joc.3817
The output can be accessed at:
https://repository.rothamsted.ac.uk/item/8qy6y
.
© 4 October 2013, Wiley.
Published online 4 October 2013 in Wiley Online Library (wileyonlinelibrary.com) DOI: 10.1002/joc.3817
Air temperature, relative humidity, climate regionalization
and thermal comfort of Nigeria
O. M. Eludoyin,
a* I. O. Adelekan,
bR. Webster
cand A. O. Eludoyin
d,e aDepartment of Geography and Planning Sciences, Adekunle Ajasin University, Akungba-Akoko, Ondo State, NigeriabDepartment of Geography, University of Ibadan, Ibadan, Nigeria cRothamsted Research, Harpenden, UK
dDepartment of Geography, College of Life and Environmental Sciences, University of Exeter, UK eDepartment of Geography, Obafemi Awolowo University, Ile-Ife, Nigeria
ABSTRACT:Planners and policy makers require information about the regions for which they are responsible. However, it seems that many developing countries, including Nigeria, are not adequately prepared either for their current climates or for the impact of climate change because they lack sufficient information. We have therefore examined the variations in the thermal condition in terms of the temperature, relative humidity, effective temperature (ET), temperature–humidity index (THI) and relative strain index (RSI). We studied the spatial and temporal (1951–2009, 1951–1980, 1981–2009, decadal, seasonal and monthly averages) variations in the thermal climate of Nigeria, and we divided Nigeria into thermal climate regions for effective climate change management. Mean annual minimum, mean and maximum temperatures (with their standard deviations) were 21.4 (3.5), 27.1 (2.7) and 32.8 (3.4)◦C, respectively, while the overall mean relative humidity was 62 (24.8)%. Mean ET, THI and RSI were 24.3 (0.85), 24.8 (1.83) and 0.2 (0.18)◦C, respectively. The ET, THI and RSI provided contrasting expressions of thermal comfort for Nigeria, because of its varied climate. We also found that elevation; the movement of the Inter Tropical Discontinuity and urbanization affect thermal comfort in Nigeria. We conclude that thermal stress has increased in Nigeria from 2000 at most stations, especially in the south and north-western regions, and that Nigerian thermal comfort climate is heterogeneous and requires analysis of multiple thermal indices.
KEY WORDS climate regionalization; spatial and seasonal variation; physiologic climate; thermal stress; tropical climate
Received 11 September 2012; Revised 24 July 2013; Accepted 12 August 2013
1. Introduction
The relation between man and climate is reciprocal in the sense that man responds to variation in climate by insulating buildings, heating and air-conditioning. Man’s aim is to be comfortable despite the climate, and this gives rise to the notion of thermal comfort. Thermal comfort has been studied since the start of 20th century, and improvements in building techniques, as well as dis-coveries in central heating and air conditioning systems have led to improved comfort in indoors, even in the hottest and coldest climates (Brager and de Dear, 1998). Several indices of comfort and mathematical models to predict thermal comfort and discomfort have also been developed (G´omez et al., 2004; Watkinson et al., 2004; Kianget al., 2006). For most indoor conditions, the effi-ciency of a person or group of people has been described ‘as being bound up in the climatic conditions in which they work and live’ (Hanet al., 2007). Han et al.(2007) argued that buildings are designed to suit the climate within which they are located and the functions for which
* Correspondence to: O.M. Eludoyin, Department of Geography and Planning Sciences, Adekunle Ajasin University, Akungba-Akoko, Ondo State, Nigeria. E-mail: baynick2003@yahoo.com
they are intended. This, however, is probably untrue for most developing countries, especially in areas with plan-ning problems (Adepoju, 1982; Adebayo, 1987; Jauregui, 1991).
Several investigators have also shown that variation in the heat indices, especially temperature, have sig-nificant relations with human mortality (Kalkstein and Smoyer, 1993; Alcamoet al., 2007; Linet al., 2011) and prevalence of certain diseases (Greenwood, 1999; Coˆelho
THERMAL CLIMATE AND THERMAL IN NIGERIA 2001
among others (Jauregui, 1993). Extreme climates can increase mortality (Hajatet al., 2005; Greenwood, 2006) and forced migration (Meze-Hausken, 2000). Knowledge of the thermal climate of any region is therefore vital for planning on health, urban development, tourism and migration, among other matters (De Freitas, 2003; World Health Organisation, 2011).
Despite the importance of thermal conditions both regionally and nationally, little is documented on their effect on human comfort in many developing countries, including Nigeria (Boko et al., 2007; World Health Organisation, 2011). These countries, however, comprise a significant proportion of the world’s most rapidly urbanizing regions. The United Nations (United Nations, 2008) suggested that more than 90% of future population growth will be concentrated in cities in developing countries, and a large percentage of this population will be poor. Few studies, nonetheless, have been undertaken in Nigeria, most of which have been limited to either indoor microclimate (Ajibola, 2001; Ogbonna and Harris, 2008) or urban microclimates (Olaniran, 1982; Adebayo, 1991; Akinbodeet al., 2008).
On the other hand, recent studies have shown that heat-induced mortality resulting from meningitis has increased in the north and middle belt of Nigeria (Greenwood, 1999; Mohammedet al., 2000; Greenwood, 2006). Sawa and Buhari (2011) also predicted that meningitis and measles would increase by 6 and 19 persons per thou-sand, respectively, for every 1◦C increase in temperature in their study on Zaria, in northern Nigeria. In Greece, Matzarakis (2001) suggested that temperature-related dis-eases will most likely increase as urbanization incrdis-eases, while in Califonia, USA, Ostro et al. (2011) associated temperature increases with increased mortality and hos-pital admissions and in Brazil, significant link exists between the effective temperature (ET) and hospital admissions for respiratory diseases (Coelhoet al., 2010). Although records of mortality and hospital treatments are fraught with uncertainties in many developing coun-tries (Kwastet al., 1986; Williams and Boren, 2008), we know that urbanization in Nigeria, as in most developing countries, is rapid, and the explosion of urban popula-tion has not been matched by a change in social, eco-nomic and technological development (United Nations population Fund, 2007; WHO, 2011). Public infrastruc-ture, social and health services have been neglected, and urban planning and zoning have been slow or stagnant in many cases. Consequently, there is the preponder-ance of large proportion of urban dwellers living and working under conditions that make them vulnerable to effects of climate. These are often poor people, and a sizeable proportion of the Nigerian population is in this category (Adepoju, 1982). Certain urban characteristics, including structure and geometry can affect the pattern of movement and distribution of the air and solar radiation, with important implications for thermal comfort (Jonsson, 2004; Candidoet al., 2010; Kruegeret al., 2011).
We have examined the spatial and temporal (1951–2009, 1951–1980, 1981–2009, decadal, seasonal
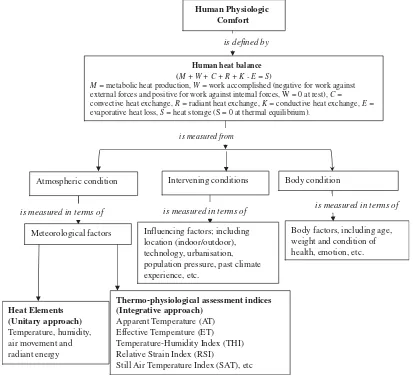
and monthly averages) variations in the thermal climate of Nigeria, in terms of temperature, relative humidity, ET, temperature-humidity (THI) and relative strain (RSI) indices. We have divided Nigeria into thermal climate regions for effective climate change management. We have adopted a conceptual framework that links thermal comfort and human heat balance with certain meteoro-logical elements, body conditions and some intervening conditions (Figure 1). Results presented here are those of the meteorological factors. The main hypotheses are that (i) thermal stress increased in Nigeria between 1951 and 2009, and that (ii) thermal comfort in Nigeria exhibits direct relationship with proximity to the influence of the moisture-laden maritime air mass from the Atlantic Ocean in the south or the dry continental air mass from the Sahara.
2. Methods
2.1. Site description
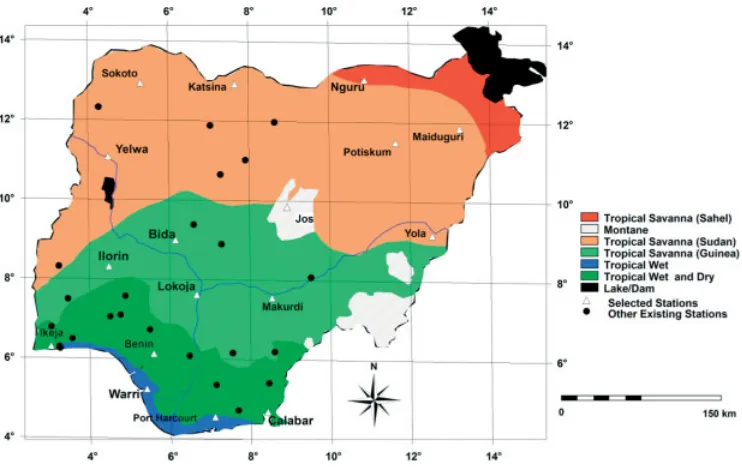
The study area, Nigeria, lies between 4–14◦N and 3–15◦E in the southeastern edge of the West African region. Nigeria’s land area is about 923 800 km2, and is about 14% of West Africa. The Atlantic Ocean, Sahara desert and Cameroon Mountains, which form the southern, northern and eastern boundaries, exert influences on the country’s climate systems (Ileoje, 2001). Nigeria is characterized by two main seasons; dry and rainy seasons. The dry season is accompanied by a dust-laden wind from the Sahara desert, known as Harmattan, which is brought by the Tropical Continental (cT) airmass, while the rainy season is heavily influenced by the Tropical Maritime (mT) from the Atlantic Ocean (Figure 2). The local climate in the north central region may also be more influenced by the high elevation in the region than the south (Figure 3).
Human Physiologic Comfort
Heat Elements (Unitary approach)
Temperature, humidity, air movement and radiant energy
Human heat balance (M + W + C + R + K - E = S)
M = metabolic heat production, W = work accomplished (negative for work against external forces and positive for work against internal forces, W = 0 at rest), C = convective heat exchange, R = radiant heat exchange, K = conductive heat exchange, E = evaporative heat loss, S = heat storage (S = 0 at thermal equilibrium).
Thermo-physiological assessment indices (Integrative approach)
Apparent Temperature (AT) Effective Temperature (ET) Temperature-Humidity Index (THI) Relative Strain Index (RSI)
Still Air Temperature Index (SAT), etc
Atmospheric condition Intervening conditions Body condition
Influencing factors; including location (indoor/outdoor), technology, urbanisation, population pressure, past climate experience, etc.
Body factors, including age, weight and condition of health, emotion, etc. Meteorological factors
is measured from
is defined by
is measured in terms of is measured in terms of is measured in terms of
Figure 1. Human biometeorological assessment of the thermal components of different climate. This study has only focused on meteorological factors.
throughout this period. ‘Highland climate’ (Ileoje, 2001) or montane climate is experienced on highlands regions in Nigeria. Highlands with montane climate in Nigeria exceed 1520 m above sea level. Because of their location in the tropics, this elevation provides the settlements on the mountains and the plateau regions standing above this height, a cool montane climate.
With a population of more than 140 million spread over an area of 923 800 square kilometres (National Popula-tion Commission, 2006), Nigeria is the most populated country and one of the largest countries in Africa. Esti-mated annual population growth is 2.5%. The urban pop-ulation as at 2010 was about 49% of the total poppop-ulation, and is projected to increase by 3.8%, annually (United Nations Statistics Division, 2013, Table 1). Table 1 also shows that deforestation and fossil fuel generation have significantly increased; forested area is only 10.8%. Almost all the 37 administrative headquarters (includ-ing the Federal Capital, Abuja) are densely populated (about 1000 people per square kilometre). Akinbodeet al.
(2008) studied a typical administrative city in Nigeria, and found that it could create a significant island of heat (0.5–2.5◦C) during the daytime. Until recently, when
some political administrators encouraged city greening programmes, involving growing plants in the hitherto entirely built up areas (Ojo and Kayode, 2006), the major systems of land use encouraged widespread removal of vegetation for urban development, a condition known to affect the local climate.
2.2. Data
THERMAL CLIMATE AND THERMAL IN NIGERIA 2003
Figure 2. Nigeria in Africa, and the seasonal direction of the air masses and the Inter Tropical Convergence Zone that determine the season in the region.
Figure 3. Basic elevation map of Nigeria.
in each grid cell as a potential representative, only meteorological stations with temperature and relative humidity data from 1951 were used. Data were, however, unavailable for most stations between 1967 and 1970, as a result of the Nigerian civil war at that time (Nafziger, 1972 for information on Nigerian civil war). Data were also examined for spurious values and evidence of non-climatic heterogeneity and instrumental errors as advised by the World Meteorological Organisation
(1989). Consequently, meteorological stations, for which data were missing for more than 5 years in a row (other than 1967–1970) and those with significant number (upward of about 10%) suspect data were removed.
Figure 4. Basic map of Nigerian climates.
Table 1. Some parameters of urban and population growth in Nigeria.
Variables Specifics Rate
Landuse Deforestation 4000 km2/year
Reforestation 10 km2/year Forested area (2008) 10.8%
Urban Population Annual growth 3.8%
Urban Population in 2004, 2010
45%, 48.9%
Rural Population Annual growth 1.8%
Total population Population density in 2004, 2009
137.6, 167.5 persons/km2
Annual growth 2.5%
Total fossil fuels emission
1951 460 000 tonne
1980 18 586 000 tonne
2008 26 113 000 tonne
United Nations Statistics Division (2013), Carbon Dioxide Information Analysis Centre (2012).
consisting of the tropical wet (represented in this study by Warri and Port Harcourt) and tropical wet and dry climates (represented in this study by Ikeja, Benin and Calabar), the Tropical Savanna; consisting of guinea (rep-resented by Bida, Ilorin, Lokoja and Makurdi), sudan (represented in the study by Sokoto, Bauchi, Katsina, Yelwa, Potiskum Maiduguri and Yola), and Sahel (rep-resented in the study by Nguru) savanna, and montane region (represented by Jos) (Figure 5).
2.3. Determination of selected integrative indices
Previous studies on Nigeria and elsewhere (Eludoyin and Adelekan, 2013; Eludoyin, 2013 for records of previous studies and indices considered) suggest that
ET, temperature-humidity index (THI) and relative strain index (RSI) are important as indices of thermal comfort in the tropics, and so these have been selected for this study. The values of the indices (ET, THI and RSI) were estimated from the respective records of temperature and relative humidity for each station, and for different period (diurnal and monthly). The formulae used for computation of ET, THI, and RSI have been found to be valid and generally accepted for use in Nigeria and the tropics (ET: Ayoade, 1978; Olaniran, 1982; Ogbonna and Harris, 2008, THI: Olaniran, 1982; Unger, 1999 and RSI: Unger, 1999, Alessandro and de Garin, 2003). The ET, THI and RSI were calculated with the empirical Equations 1, 2 and 3:
ET=T−0.4(T−10)
1− H 500
(1)
THI=0.8T+ HT
100 (2)
RSI= [10.7+0.74 (T−35)]
44−0.0075HV (3)
where T is the mean temperature of the air (◦C), H is relative humidity (%),V is the saturation vapour pressure (hPa), and is estimated asV =6.11×10237.77.5T+T.
2.4. Analysis and descriptive mapping
THERMAL CLIMATE AND THERMAL IN NIGERIA 2005
Figure 5. Distribution of meteorological stations in Nigeria. Stations that are selected for this study are labelled.
(ILWIS version 3.3) (ITC, Eschende, Netherlands) for mapping as documented by Eludoyin and Adelekan (2013).
2.5. Delineation of thermal climate zones in Nigeria
We delineated the thermal climates in Nigeria for the years 1951–2009 with values of indices of thermal cli-mates (ET, THI and RSI) above or below thresholds for comfortable climate (18.9–25.6 ◦C, 15–24 ◦C and 0.1–0.2 (ratio, no unit) for ET, THI and RSI, respec-tively), subsequently converting the frequencies to their percentages, because the stations had differing amounts of data. Heat stress occurs when ET index is greater than 25.6 ◦C or when THI is greater than 24 ◦C or RSI greater than 0.2. Cold stress occurs with ET
≤ 18.9 ◦C; THI ≤ 15 ◦C or RSI ≤ 0.1 (Nieuwott, 1977, Ayoade, 1978, Kyle, 1994, Eludoyin and Adelekan, 2013). We subsequently classified the stations into five zones using the k-means cluster technique with ET, THI and RSI data. ‘Region 1’, with the fewest peri-ods when the thermal indices exceeded the thresholds, was classified as the ‘most’ thermally comfortable cli-mate, while ‘Region 5’, with most periods when thresh-olds of thermal comfort were exceeded, was classi-fied as most ‘thermally stressed climate’. Regions 2, 3 and 4 are transitory zones within 1 and 5, with Regions 2 and 3 being more thermally comfortable than ‘Region 4’.
3. Results
3.1. Mean (1951–2009) thermal variations in Nigeria
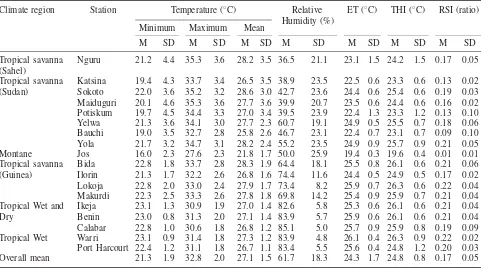
Table 2 lists the results of descriptive analysis of the variables. The overall average minimum temperature for
all the stations was 21.4 ◦C. Minimum temperatures were below the overall average in the tropical savanna and montane climate regions. Mean minimum temper-ature ranged between 16 and 23.1 ◦C, while the mean annual maximum temperature was between 27.6 and 35.3 ◦C. The mean maximum temperature in all sta-tions within the savanna was higher than its overall average (32.8 ◦C), except at Bauchi and Ilorin. The montane, Tropical Wet and Dry and Tropical Wet cli-mate regions, however, had lower (than the overall aver-age) mean maximum temperature. In addition, annual mean temperature ranged between 21.8 and 28.6 ◦C, while the mean relative humidity varied between 36.5 and 85.1%. The Sahel and Sudan savanna and montane regions were characterized by lower relative humidity than the overall mean (62%). Variations in both tempera-ture and relative humidity increased from south towards the north, except for few stations in the guinea and sudan savanna which exhibited higher variability than the sahel.
Table 2. Descriptive statistics of temperature, relative humidity and thermal climate at selected meteorological stations in Nigeria (1951–2009)
Climate region Station Temperature (◦C) Relative
Humidity (%)
ET (◦C) THI (◦C) RSI (ratio)
Minimum Maximum Mean
M SD M SD M SD M SD M SD M SD M SD
Tropical savanna (Sahel)
Nguru 21.2 4.4 35.3 3.6 28.2 3.5 36.5 21.1 23.1 1.5 24.2 1.5 0.17 0.05
Tropical savanna (Sudan)
Katsina 19.4 4.3 33.7 3.4 26.5 3.5 38.9 23.5 22.5 0.6 23.3 0.6 0.13 0.02
Sokoto 22.0 3.6 35.2 3.2 28.6 3.0 42.7 23.6 24.4 0.6 25.4 0.6 0.19 0.03
Maiduguri 20.1 4.6 35.3 3.6 27.7 3.6 39.9 20.7 23.5 0.6 24.4 0.6 0.16 0.02
Potiskum 19.7 4.5 34.4 3.3 27.0 3.4 39.5 23.9 22.4 1.3 23.3 1.2 0.13 0.10
Yelwa 21.3 3.6 34.1 3.0 27.7 2.3 60.7 19.1 24.9 0.5 25.5 0.7 0.18 0.06
Bauchi 19.0 3.5 32.7 2.8 25.8 2.6 46.7 23.1 22.4 0.7 23.1 0.7 0.09 0.10
Yola 21.7 3.2 34.7 3.1 28.2 2.4 55.2 23.5 24.9 0.9 25.7 0.9 0.21 0.05
Montane Jos 16.0 2.3 27.6 2.3 21.8 1.7 50.0 25.9 19.4 0.3 19.6 0.4 0.01 0.01
Tropical savanna (Guinea)
Bida 22.8 1.8 33.7 2.8 28.3 1.9 64.4 18.1 25.5 0.8 26.1 0.6 0.21 0.06
Ilorin 21.3 1.7 32.2 2.6 26.8 1.6 74.4 11.6 24.4 0.5 24.9 0.5 0.17 0.02
Lokoja 22.8 2.0 33.0 2.4 27.9 1.7 73.4 8.2 25.9 0.7 26.3 0.6 0.22 0.04
Makurdi 22.3 2.5 33.3 2.6 27.8 1.8 69.8 14.2 25.4 0.9 25.9 0.7 0.21 0.04
Tropical Wet and Dry
Ikeja 23.1 1.3 30.9 1.9 27.0 1.4 82.6 5.8 25.3 0.6 26.1 0.6 0.21 0.04
Benin 23.0 0.8 31.3 2.0 27.1 1.4 83.9 5.7 25.9 0.6 26.1 0.6 0.21 0.04
Calabar 22.8 1.0 30.6 1.8 26.8 1.2 85.1 5.0 25.7 0.9 25.9 0.8 0.19 0.09
Tropical Wet Warri 23.1 0.9 31.4 1.8 27.3 1.2 83.9 4.8 26.1 0.4 26.3 0.9 0.22 0.02
Port Harcourt 22.4 1.2 31.1 1.8 26.7 1.1 83.4 5.5 25.6 0.4 24.8 1.2 0.20 0.03
Overall mean 21.3 1.9 32.8 2.0 27.1 1.5 61.7 18.3 24.3 1.7 24.8 0.8 0.17 0.05
M represents the mean of the monthly average from 1951 to 2009. SD is the standard deviation of the monthly averages from 1951 to 2009 (n=708).
understand the effect of this on the interpretation of RSI. Except for the large variation (large standard deviation) in ET and THI at Nguru (Sahel), Potiskum (Sudan) and Port Harcourt (tropical wet), values of variation in other regions were less than 1◦C.
In addition, Figure 6 shows the spatial distribution of the 59 (1951–2009) years mean distributions of temperature, relative humidity, ET, THI and RSI for Nigeria. The southern region (including the Tropical Wet, Tropical Wet and Dry climate and some parts of tropical savanna) were characterized by higher mean minimum temperature than the north-central part of the Sudan savanna and montane regions. The station (Jos) in the montane region had the lowest mean minimum temperature. Lower mean maximum temperatures also occurred at Calabar and Jos than elsewhere in Nigeria. The northern region had the highest maximum temperature, with peaks around Sokoto, Nguru and Maiduguri. The mean ET pattern (Figure 6(e)) shows the south and the northwest at the margin of heat stress (24–26 ◦C), and the northeast as thermally comfortable (22–24 ◦C). Heat stress declines towards the montane, where the lowest (18–22◦C) was recorded. Earlier results (Table 2) showed that variation in ET is greater in the Sahel (Nguru) and a station in the Sudan savanna (Potiskum). In terms of THI, this region was shown to be thermally comfortable, while the montane location was also classified as most comfortable (Figure 6(f)). Significant thermal heat stress (THI greater than 26 ◦C) occurred mainly around Lokoja, Ikeja, Benin and Warri in the Guinea and tropical forest
(Tropical wet and dry, and tropical wet climates) region. Like the results on THI, the RSI map (Figure 6(g)) also shows area around Bida, Lokoja, Ikeja, Benin and Warri as most thermally stressed, and the region around the montane climate as most thermally comfortable.
3.2. Variation in temperature, relative humidity and thermal comfort index between 1951–1980 and 1981–2009
If we compare the average values for 1951–1980 with those for 1981–2009 we see that all the temperatures have increased at most stations by less than 1◦C (Figure 7). Minimum temperature increased by 1–2◦C in the northwest, Sahel (Nguru), Ikeja and around Bauchi. Nguru, Potiskum, Bauchi and Niger-Delta areas exhibited 0.5–1◦C increase in the maximum temperature but other areas, except Ilorin and Yelwa in the west showed a smaller (less than 0.5◦C) increase. The mean temperature showed between 1 and 2◦C increase at Nguru while increase at other regions were less than 1◦C. The mean temperatures of some areas in the savanna region (Sokoto, Nguru, Yola and Bida) reached 30◦C in 1981–2009. Conversely, relative humidity generally decreased in the western region (except Yelwa and Sokoto) but increased in the east, reaching up to 5% increase at Jos and Potiskum.
THERMAL CLIMATE AND THERMAL IN NIGERIA 2007
(a) (b)
(c) (d)
(e) (f)
(g)
(a)
(b)
(c)
(d)
Figure 7. Temperatures and relative humidity in 1981–2009, and change relative to 1951–1980 means in Nigeria.
1–2 ◦C. Change in mean THI in 1981–2009 from 1951 to 1981 mean was similar to ET, with a less than 2 ◦C decrease in the west and montane region. Port Harcourt and Nguru in the tropical wet and sahel savanna, respectively, exhibited 1–2 ◦C increase in the mean THI. The result of RSI also shows that while Yola, and Benin City showed a decrease by about 0.04, and about 0.02 in the northwest and few other stations (Ilorin, Jos, Potiskum and Maiduguri), other parts of the country have showed increase, exceeding 0.04, near Benin City
in the southern region, and near Yola in the northeastern region.
3.3. Trends in temperature, relative humidity and thermal comfort indices
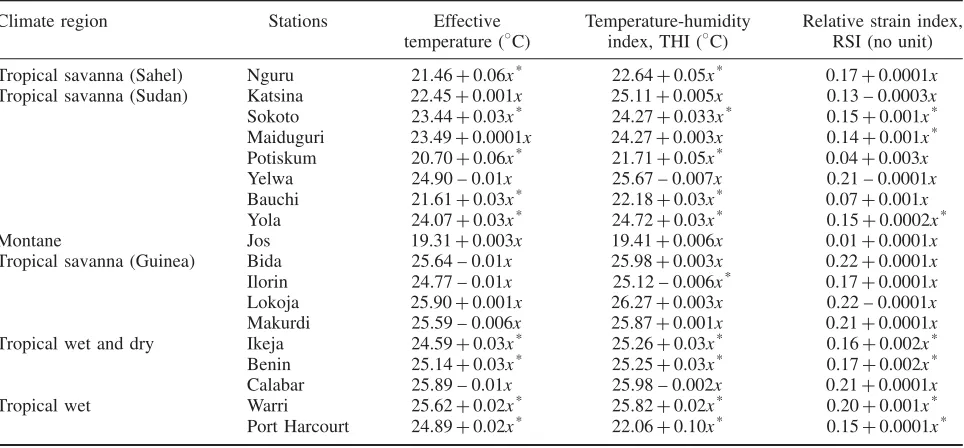
The results of linear regression analysis and their signif-icance for each variable and at all the stations are pre-sented in Tables 3 and 4. The general regression equation is 4
THERMAL CLIMATE AND THERMAL IN NIGERIA 2009
(a)
(b)
(c)
Figure 8. The ET, THI and RSI in 1981–2009, and relative to 1951–1980 means in Nigeria.
in whichy is the dependent variable (ET, THI or RSI),
x is the independent variable (time in years) and a
(the constant) and b are fitting parameters. Parameter
b is the regression coefficient quantifying the rate at which the temperature or other variable changes with time. The temperature variables showed significantly increasing trend at most stations, except the montane and few stations in the savanna. Only the minimum temperature decreased at the montane region (b= −0.03;
p<0.05) while maximum temperature at Yelwa has also decreased (b= −0.03; p<0.05). Whereas temperatures increased steadily at most stations (b≤0.05; p<0.05) relative humidity has generally decreased, especially
in the tropical rainforest region (b varies from −0.07 to 0.17; p<0.05) (Table 3). At Bauchi in the Sudan savanna region, however, there was a significant increase (b=0.17; p<0.05) within the 59 years Similarly, ET, THI and RSI showed an increased trend at most of the stations, especially within the Sudano–Sahelian savanna (b varies from 0.001 to 0.06) and tropical rainforest (bvaries from 0.02 to 0.03) regions (Table 4).
3.4. Monthly variation in thermal climate indices in Nigeria
Table 3. Linear trends in temperature in selected stations in Nigeria
Climate region Stations Temperature (◦C) Relative humidity (%)
Minimum Maximum Mean
Tropical savanna (Sahel) Nguru 19.98+0.04x* 34.67+0.02x 27.32+0.03x* 36.75 – 0.01x
Tropical savanna (Sudan) Katsina 18.82+0.02x 33.11+0.02x* 25.97+0.02x* 41.65+0.1x
Sokoto 20.38+0.01x* 34.6+0.02x* 27.47+0.03x* 40.76+0.06x
Maiduguri 19.34+0.02x 35.04+0.01x 26.85+0.03x 42.81 – 0.09x
Potiskum 18.45+0.04x* 33.42+0.03x* 25.95+0.03x* 40.76 – 0.04x
Yelwa 20.96+0.01x 34.81 – 0.03x* 26.89 – 0.01x 60.02+0.03x
Bauchi 17.82+0.04x* 32.17+0.02x* 24.99+0.03x* 41.97+0.17x*
Yola 20.77+0.04x* 34.36+0.01x 27.56+0.02x* 53.99+0.04x
Montane Jos 17.19–0.03x* 27.01+0.02x* 21.85–0.002x 44.72+0.16x
Tropical savanna (Guinea) Bida 22.27+0.02x 33.05+0.02x* 22.66+0.02x* 66.76 – 0.09x
Ilorin 20.42+0.03x* 32.74–0.02x 26.58+0.01x 75.99 – 0.05x
Lokoja 22.45+0.01x* 32.59+0.02x* 27.52+0.01x* 72.44 – 0.07x*
Makurdi 21.18+0.03x* 32.52+0.02x* 27.19+0.02x 71.55 – 0.05x
Tropical Wet and Dry Ikeja 21.65+0.05x* 30.25+0.02x* 25.95+0.04x* 86.28 – 0.13x*
Benin 22.63+0.01x* 30.68+0.02x* 26.26+0.03x* 84.87 – 0.03x*
Calabar 21.79+0.04x* 29.96+0.02x* 26.29+0.02x* 86.55 – 0.04x*
Tropical Wet Warri 22.39+0.03x* 31.16+0.01x* 26.77+0.02x* 84.85 – 0.03x*
Port Harcourt 21.79+0.02x* 30.17+0.03x* 25.98+0.02x* 84.56 – 0.03x
Linear trend of the asterisked (*) row is significant at the corresponding station within 95% confidence level (p≤0.05); ‘x’ is in years. Table 4. Linear trends in thermal comfort indices in selected stations in Nigeria.
Climate region Stations Effective
temperature (◦C)
Temperature-humidity index, THI (◦C)
Relative strain index, RSI (no unit)
Tropical savanna (Sahel) Nguru 21.46+0.06x* 22.64+0.05x* 0.17+0.0001x
Tropical savanna (Sudan) Katsina 22.45+0.001x 25.11+0.005x 0.13 – 0.0003x
Sokoto 23.44+0.03x* 24.27+0.033x* 0.15+0.001x*
Maiduguri 23.49+0.0001x 24.27+0.003x 0.14+0.001x*
Potiskum 20.70+0.06x* 21.71+0.05x* 0.04+0.003x
Yelwa 24.90 – 0.01x 25.67 – 0.007x 0.21 – 0.0001x
Bauchi 21.61+0.03x* 22.18+0.03x* 0.07+0.001x
Yola 24.07+0.03x* 24.72+0.03x* 0.15+0.0002x*
Montane Jos 19.31+0.003x 19.41+0.006x 0.01+0.0001x
Tropical savanna (Guinea) Bida 25.64 – 0.01x 25.98+0.003x 0.22+0.0001x
Ilorin 24.77 – 0.01x 25.12 – 0.006x* 0.17+0.0001x
Lokoja 25.90+0.001x 26.27+0.003x 0.22 – 0.0001x
Makurdi 25.59 – 0.006x 25.87+0.001x 0.21+0.0001x
Tropical wet and dry Ikeja 24.59+0.03x* 25.26+0.03x* 0.16+0.002x*
Benin 25.14+0.03x* 25.25+0.03x* 0.17+0.002x*
Calabar 25.89 – 0.01x 25.98 – 0.002x 0.21+0.0001x
Tropical wet Warri 25.62+0.02x* 25.82+0.02x* 0.20+0.001x*
Port Harcourt 24.89+0.02x* 22.06+0.10x* 0.15+0.0001x*
Linear trend of the asterisked (*) row is significant at the corresponding station within 95% confidence level (p≤0.05); ‘x’ is in years.
similar patterns with the peak relative humidity in August after a increase from April, and a decline from Septem-ber till March. Relative humidity in the Guinea savanna was high in most months, especially between March and December. The relative humidity during most months exceeded 40%, except for Bida in January. Stations within the tropical rainforest had high relative humid-ity throughout the year, exceeding 70% in all months. Temperature variables; minimum, maximum and mean temperature had similar patterns at all the stations, except for the variations in the periods of the peak among the stations from different regions. The times at which the temperature variables peaked increased with increasing latitude. For example, peaks of all the temperature
variables within the tropical rainforest occurred in Febru-ary. For most stations in the Guinea savanna, the peaks occurred in March, whereas temperatures peaked in April at stations within the Sudan savanna. The peaks occurred in May in the Sahel savanna. In addition, the temperature variables appear to be more stable in the trop-ical rainforest and montane regions than in the savanna.
3.5. Seasonal variation
THERMAL CLIMATE AND THERMAL IN NIGERIA 2011
Figure 10. Mean (1951–2009) seasonal distribution of thermal comfort indices (ET, THI and RSI) in Nigeria.
Sokoto had the largest ET in the rainy season (26–28◦C). In the dry season, Benin, Warri and Calabar areas in the rainforest had larger ET (26–28 ◦C) than other regions. The ET during the dry season increased from the north to south. Jos, on the other hand, had a distinctly small ET in both rainy and dry seasons, except that the wet season’s range (18–20 ◦C) was somewhat greater than in the dry season (20–22◦C). All stations in the savanna recorded smaller ET in the Harmattan than rainy and dry seasons, whereas most stations in the rainforest region had greater ET than the savanna and montane regions. The THI was also greater in the rainy season (20–28◦C) than in both the dry season and Harmattan period (18–28 ◦C) for most stations, but was smaller in the montane
region than other regions in this season. Peak values occurred in the north during this season. In the dry season, the mean THI was smaller in the north than in the south. Only the montane region was relatively stable in both dry and rainy seasons. The THI during the Harmattan period
was much smaller for the savanna (excluding the Guinea savanna) regions and the northern stations in general. The influence of large THI also retreated from what it was in the dry season. A smaller RSI ratio also occurred in the Harmattan (−0.1 to 0.2) than other seasons (0 to 0.3). The RSI during the Harmattan period partitioned Nigeria into two major zones; the north with RSI ratio of 0 to 0.1 and south 0.1 to 0.2. The north-west had the largest RSI in the rainy season, whereas the largest RSI in the dry season occurred in the south west and Niger-Delta area.
3.6. Decadal variations
THERMAL CLIMATE AND THERMAL IN NIGERIA 2013
(a)
Figure 11. (a) Decadal variations in the distribution of thermal comfort and discomfort based on the mean effective temperature (ET) index for Nigeria, from observed (1951–1960, 1961–1970, 1971–1980, 1991–2000, 2001–2010) and projected (2011–2020 and 2021–2030) periods. (b) Decadal variations in the distribution of thermal comfort and discomfort based on the mean relative strain index (RSI) for Nigeria, from
observed (1951–1960, 1961–1970, 1971–1980, 1991–2000, 2001–2010) and projected (2011–2020 and 2021–2030) periods.
and Lokoja in 1951–1960 and later spread to more regions in the south. By 1981–1990, most places in the Niger-Delta region had become thermally stressed, and the decade that began in 2001 showed an increase in thermal discomfort in the western region. The forecasted trend suggests a further increase northwards from the southwest and southeast, and from the northeast direction (Yola) towards the west.
The result of the RSI (Figure 11(b)), however, suggests a change from potential vulnerability to cold stress, to thermal stress in the northern region. The north-central part of Nigeria witnessed cold stress between 1951 and 1970, before such stress became restricted to the montane climate region in Jos from the decade starting in 1971. More regions have also become thermally uncomfortable from 1971, and the forecast suggests an increase from
both the west and east of the country, leaving only part of the north-central region and Ilorin (in the Guinea savanna) as thermally comfortable.
3.7. Delineation of regional thermal climate in Nigeria
(b)
Figure 11. Continued.
RSI (Regions 4 and 5). Subsequently, the five regions identified are characterized as described below:
Region 1: This is the montane climate region. It apparently has the most comfortable physiologic climate in Nigeria. Both minimum and maximum temperatures are generally low (16–20◦C and 27–33◦C) and relative humidity is also moderate (about 50% on average). The altitude in this region is between 1200 and 1500 m. We found that Bauchi is also classified within the region. This is probably because the station has montane weather for most of the year.
Region 2: This comprises part of the western Nigeria and some of eastern Nigeria including parts of the Guinea, Sudan and Sahel savanna. Parts of the region experience thermal stress in dry season and early rainy season, but not in the Harmattan and rainy season. The thermal condition is seasonal.
Region 3: This comprises the highly urbanized and industrial regions, in which thermal stress in 1981–2009 was greater than previously in 1951–1980. Temperature
and relative humidity are high because the region is close to the Atlantic Ocean. Places within the region (as demonstrated by the meteorological data we used) have similar seasonal and monthly patterns in temperature, relative humidity and thermal condition. The thermal stress is likely to be partly man-made; a result of urbanization.
Region 4: This region includes the Niger-Delta in the south, and north-eastern Nigeria, most of which have been categorized as thermally stressed in the dry season and the Harmattan period. Studies (Ogundare and Sidiq, 2010) have shown that the thermal stress in part of the Niger-Delta region may be linked to the oil exploitation and gas flaring there. The classification of the north-eastern region is into this region is probably based on its high (35–37◦C) maximum temperature, which suggest significant daytime thermal stress.
THERMAL CLIMATE AND THERMAL IN NIGERIA 2015
Figure 12. Nigerian regions based on thermal condition. Region 1 is most thermally comfortable while Region 5 is characterised with most thermally stressed condition, thermal stress increases from Regions 1–5.
Niger–Benue trough is the most uncomfortable in almost all the periods considered (e.g. dry, Harmattan and rainy season in 1951 to 2009 and 1981–2009).
4. Discussion and conclusions
We have investigated the spatial and temporal varia-tions in the thermal comfort of Nigeria, using both uni-tary (temperature and relative humidity) and integrative indices (ET, THI and RSI). The mean annual mini-mum, maximum and mean temperatures for 1951–2009 (with standard deviations in brackets) are 21.4 (3.5), 32.8 (3.4) and 27.1 (2.7) ◦C, respectively. The mean relative humidity was 62 (24.8) %. The mean ET, temperature–humidity index (THI) and relative strain index (RSI) are 24.3 (0.85), 24.8 (1.83) and 0.20 (0.18) ◦C, respectively. We found that ET, THI and RSI
var-ied substantially over the whole of Nigeria, and we think that these variables merit further attention, especially to ascertain the uncertainties in their estimates. For example, while RSI indicated that the north central part of Nigeria had some cold stress in the years 1951–1970, the THI or ET did not. We also noticed differences in the rela-tionship between temperature and relative humidity with ET, THI and RSI (Figure 13), which can explain the dif-ferences that were observed in the comfort indices that were investigated in this study. The different results of the ET, THI and RSI suggest that relying on only one index of thermal climate is not sufficient to interpret the Nigerian physiologic or thermal climate. This is proba-bly partly because Nigeria is a large country and contains about six climate regions (as noted earlier in the study),
and is not as homogenous as in most countries where use of singular thermal index would produce less uncertainty. The influence of relief on the climate of Nigeria is shown to be significant by the thermal comfort classifi-cation of Jos, the montane station as the ‘most’ thermally comfortable region in Nigeria. It is well known that tem-perature diminishes with increasing altitude. On the other hand, regions classified as thermally uncomfortable, the valleys of the Niger and Benue rivers, Niger-Delta region, southwest and northeastern Nigeria exhibit some contrast-ing features. Previous study (Ayoade, 1978) classified the Niger-Benue valley as the most uncomfortable climate region in Nigeria. The reason for this is not yet fully understood. Nonetheless, the location of the Niger-Benue valley places it at the front of the Inter Tropical Discon-tinuity (ITD) for more of the year than any other part of Nigeria. Further study will be required to understand the effect of its position on the thermal condition there. Stud-ies of the Niger-Delta region (Ogundare and Sidiq, 2010) have implicated gas flaring activities associated with oil exploration as the main cause of rise in ET. Southwest-ern Nigeria has rapidly urbanized since colonial times (United Nations, 2004, 2012). Commerce and industry have grown and with them administration and the human population, and these have had their impacts on local cli-mate with ‘heat islands’ in many of the towns (Omogbai, 1985, Aina, 1989, Oniarah, 1990, Adebayo, 1991, Efe, 2004, Adelekan, 2005, Akinbode et al., 2008).
(a) (b)
(c)
Figure 13. Effective temperature (a), temperature-humidity (b), and relative strain (c) indices over different ranges of temperature and relative humidity in Nigeria. The curves shown are thresholds (25.6◦C, 24◦C and 0.1 for ET, THI and RSI, respectively). Figure 13(c) shows only
when RSI value is positive, and does not include extreme or negative units when the interpretation of RSI can be ambiguous.
be experienced at almost everywhere except the north central region within the next two decades. The monthly patterns showed that thermal stress is first experienced in the rainforest region before the northern region, in a trend that is similar to the movement of the ITD. The seasonal distribution of the thermal condition showed that more areas experienced thermal stress in the north in the rainy season while during the dry season, more areas experience thermal stress in the south. Large areas in the north were more comfortable in the Harmattan. Of the three seasons, Harmattan was observed to be the most comfortable in the north of Nigeria, although the Harmattan period is characterized by dust which is a more serious hazard than heat at this time.
In conclusion, we can accept the first hypothesis that thermal stress has increased in Nigeria between 1951 and 2009 but not the second which states that thermal comfort is directly related to proximity to either the influence of the Atlantic Ocean or Sahara. On the other hand, except on the highland at Jos (1285 m) and the uncertain influence of the movement of the Inter Tropical Discontinuity (ITD), more studies will be required to distinguish the role of urbanization and movement of the air masses on the thermal comfort in Nigeria.
Acknowledgements
We acknowledge the support of the Education Trust Fund and Adekunle Ajasin University, Akungba-Akoko, Nige-ria for providing research grant and study leave for the first author to analyse her data, and the Depart-ment of Biomathematics and Bioinformatics, Rothamsted Research, Harpenden, United Kingdom for computational and scientific support for the analysis. We also appreciate the anonymous reviewers for their useful comments, and the last reviewer specifically for insights into some of the figures (especially Figure 13).
References
Adebayo YR. 1987. A note on the effect of urbanization on temperature in Ibadan.J. Climatol.7: 185–192.
Adebayo Y. 1991. Day–time effects of urbanization on relative humidity and vapour pressure in a tropical city. Theor. Appl. Climatol.43: 17–30.
Adelekan IO. 2005. Urban climate research in Nigeria. Country Report.
Newslett. Int. Assoc. Urban Clim.13: 8–10.
Adepoju A. 1982. Population growth and urbanization. InPopulation and Development in Nigeria, Orubulaye IO, Oyeneye OY (eds). Nigeria Institute of Social and Economic Research: Ibadan, Nigeria; 178.
THERMAL CLIMATE AND THERMAL IN NIGERIA 2017
http://www.wmo.int/pages/prog/www/IMOP/publications/IOM– 94–TECO2006/P3%2820%29_Aderinto_Nigeria.pdf.
Aina SA. 1989.Aspects of the Urban Climate of Oshogbo, Unpublished M.Sc Dissertation, University of Ibadan, Nigeria.
Ajibola K. 2001. Design for comfort in Nigeria – a bioclimatic approach.Renew. Energ.23: 57–76.
Akinbode OM, Eludoyin AO, Fashae OA. 2008. Temperature and relative humidity distributions in a medium–size administrative town in southwest Nigeria.J. Environ. Manage.87: 95–105.
Alcamo J, Moreno JM, Nov´aky B, Bindi M, Corobov R, Devoy RJN, Giannakopoulos C, Martin E, Olesen JE, Shvidenko A. 2007. Europe, climate change 2007: impacts, adaptation and vulnerability. InContribution of Working Group II to the Fourth Assessment Report of the Intergovernmental Panel on Climate Change, Parry ML, Canziani OF, Palutikof JP, der Linden PJ V, Hanson CE (eds). University Press: Cambridge, UK, 541–580.
Alessandro A, de Gar´ın A. 2003. A study on predictability of human physiological strain in Buenos Aires City. Meteorol. Appl. 10: 263–271.
Arundel AV, Sterling EM, Biggin JH, Sterling TD. 1986. Indirect health effects of relative humidity in indoor environments.Environ. Heal. Perspect.65: 351–365.
Ayoade J. 1978. Spatial and seasonal patterns of physiologic comfort in Nigeria.Theor. Appl. Climatol.26: 319–337.
Balbus JM, Malina C. 2009. Identifying vulnerable subpopulations for climate change health effects in the United States.J. Occup. Environ. Med.51(1): 33–37.
Boko M, Niang I, Nyong A, Vogel C, Githeko A, Medany M, Osman-Elasha B, Tabo R, Yanda P. 2007. Africa. Climate change 2007: impacts, adaptation and vulnerability. InContribution of Working Group II to the Fourth Assessment Report of the Intergovernmental Panel on Climate Change, Parry ML, Canziani OF, Palutikof JP, van der Linden PJ, Hanson CE (eds). University Press, Cambridge, UK, 433–467.
Brager GS, de Dear RJ. 1998. Thermal adaptation in the built environment: a literature review.Energy Buildings27: 83–96. Bunyavanich S, Landrigan CP, McMichael AJ, Epstein PR. 2003. The
impact of climate change on child health.Ambul. Paediatr.3: 44–52. Candido C, de Dear RJ, Lamberts R, Bitterncourt L. 2010. Air movement acceptability limits and thermal comfort in Brazil’s hot humid climate zone.Build. Environ.45: 222–229.
Carbon Dioxide Information Analysis Centre, 2012. National CO2 Emission from Fossil-Fuel Burning, Cement Manufacture, and Gas Flaring, World Resources 2000–2001, United States Department of Energy.
Coˆelho MZ, Gonc¸alves FLT, Dias de Oliveira Latorre MR. 2010. Statistical Analysis aiming at predicting respiratory tract disease hospital admissions from environmental variables in the City of S˜ao Paulo.J. Environ. Public Health : 11 Article ID 209270, DOI: 10.1155/2010/209270
Dada FAO, Jibrin GM, Ijeoma A. 2008.Macmillan Nigeria Secondary Atlas. Macmillan Nigeria Publishers Ltd: Ibadan, Nigeria. De Freitas C. 2003. Tourism climatology: evaluating environmental
information for decision making and business planning in the recreation and tourism sector.Int. J. Biometeorol.48: 45–54. Efe SI. 2004. Urban Effects on Precipitation Amount and Rainwater
Quality in Warri Metropolis, Unpublished PhD thesis, Delta Univer-sity, Abraka, Nigeria.
Eludoyin OM. 2013. Some aspects of physiologic climatology in Nigeria.Interdiscip. Environ. Rev.14(2): 150–185.
Eludoyin OM, Adelekan IO. 2013. The physiological climate of Nigeria.Int. J. Biometeorol.57: 241–264.
G´omez F, Gil L, Jabaloyes J. 2004. Experimental investigation on the thermal comfort in the city: relationship with the green areas, interaction with the urban microclimate.Build. Environ.39: 1077–1086.
Greenwood B. 1999. Meningococcal meningitis in Africa.Trans. Roy. Soc. Trop. Med. Hyg.93: 341–353.
Greenwood B. 2006. Editorial: 100 years of epidemic meningitis in West Africa– has anything changed? Trop. Med. Int. Health 11: 773–780.
Hajat S, Armstrong BG, Gouveia N, Wilkinson P. 2005. Mortality displacement of heat-related deaths: a comparison of Delhi, Sao Paulo, and London.Epidemiology16: 613–620.
Han J, Zhang G, Zhang Q, Zhang J, Liu J, Tian L, Zheng C, Hao J, Lin J, Liu Y, Moschandrea DJ. 2007. Field study on occupants’ thermal comfort and residential thermal environment in a hot–humid climate of China.Build. Environ.42: 4043–4050.
Ileoje NP. 2001.A New Geography of Nigeria, New Revised Edition. Longman Publishers: Ibadan, Nigeria.
Jauregui E. 1991. The human climate of tropical cities: an overview.
Int. J. Biometeorol.35: 151–160.
Jauregui E. 1993. Urban bioclimatology in developing countries.
Experientia 49: 964–968.
Jauregui E. 1997. The last Ms for 40th anniversary issue. Aspects of urban human biometeorology.Int. J. Biometeorol.40: 58–61. Jendritzky G, Maarouf A, Staiger H. 2001. Looking for a universal
thermal climate index: UTCI for outdoor applications. Moving thermal comfort standards into the 21st century, Windsor-Conference on Thermal Standards. 5–8 April, Windsor, UK.
Jonsson P. 2004. Vegetation as an urban climate control in the subtrop-ical city of Gaborone, Botswana.Int. J. Climatol.24: 1307–1322. Kalkstein L, Smoyer K. 1993. The impact of climate change on human
health: some international implications.Experientia49: 969–979. Kalkstein L, Valimont K. 1986. An evaluation of summer discomfort
in the United States using a relative climatological index.Bull. Am. Meteorol. Soc.67: 842–848.
Kiang R, Adimi F, Soika V, Nigro J, Singhasivanon P, Sirichaisinthop J, Leemingsawat S, Apiwathnasorn C, Looareesuwan S. 2006. Meteorological, environmental remote sensing and neural network analysis of the epidemiology of malaria transmission in Thailand.
Geospat. Health1: 71–84.
Kr¨uger EL, Minella FO, Rasia F. 2011. Impact of urban geometry on outdoor thermal comfort and air quality from field measurements in Curitiba, Brazil.Build. Environ.46: 621–634.
Kwast EB, Rochat RW, Kidane–Mariam W. 1986. Maternal mortality in Addis Ababa, Ethiopia.Stud. Fam. Plan.1: 288–301.
Kyle W. 1994. The human bioclimate of Hong Kong. In Brazdil R, Kolar M. Contemporary Climatology.In Proceedings of COC/IGU Meeting. 15–20 August. Masaryk University, Brno, Czech Republic, 345–350.
Le Treut H, Somerville R, Cubasch U, Ding Y, Mauritzen C, Mokssit A, Peterson T, Prather M, Qin D, Manning M, Chen Z, Marquis M, Averyt KB, Tignor M. 2007. Historical overview of climate change.
Earth1: 93–127.
Lee DHK. 1953. Physiological climatology as a field of study. Ann. Assoc. Am. Geogr.43: 127–137.
Lin T, Ho T, Wang Y. 2011. Mortality risk associated with temperature and prolonged temperature extremes in elderly populations in Taiwan.Environ. Res.111: 1156–1163.
Matzarakis A. 2001. Assessing climate for tourism purposes: existing methods and tools for the thermal complex. InReport of a Workshop Held at Porto Carras, Matzarakis A, de Freitas CR (eds). Neos Marmaras: Halkidiki, Greece, 105–115.
Meze-Hausken E. 2000. Migration caused by climate change: how vulnerable are people in dryland areas?Mitig. Adapt. Strateg. Glob. Change5(4): 379–406.
Mieczkowski Z. 1985. The tourism climatic index: a method of evaluating world climates for tourism.Can. Geogr.29: 220–233. Mohammed I, Nasidi A, Alkali AS, Garbati MA, Ajayi-Obe EK,
Audu KA, Usman A, Abdullahi S. 2000. A severe epidemic of meningococcal meningitis in Nigeria.Trans. Roy. Soc. Trop. Med. Hyg.94: 265–270.
Nafziger WE. 1972. The economic impact of the Nigerian civil war.
J. Mod. Afr. Stud.10: 333–345.
National Population Commission, NPC. 2006. National Population Census, Abuja, Nigeria. http://www.population.gov.ng/.
Nieuwolt S. 1977. Tropical Climatology: An Introduction to the Cli-mates of the Low Latitudes. Wiley: London, UK.
Ogbonna A, Harris D. 2008. Thermal comfort in sub–Saharan Africa: field study report in Jos, Nigeria.Appl. Energ.85: 1–11.
Ogundare BA, Sidiq OB. 2010. Environmental implications of gas flaring in the Niger–Delta region of Nigeria.J. Geogr. Plan. Sci.
3: 31–40.
Ojo B, Kayode F. 2006. The role of colour in environmental beau-tification and urban aesthetics: the Nigerian example.Indoor Built Environ.15: 543–550.
Olaniran O. 1982. The physiological climate of Ilorin, Nigeria.Theor. Appl. Climatol.31: 287–299.
Omogbai BE. 1985.Aspects of Urban Climate of Benin City, Unpub-lished M.Sc. Dissertation, University of Ibadan, Nigeria.
Oniarah A. 1990.Aspects of the Urban Climate of Kano, Unpublished M.Sc Dissertation, University of Ibadan, Nigeria.
Sawa B, Buhari B. 2011. Temperature variability and outbreak of meningitis and measles in Zaria, northern Nigeria.Res. J. Appl. Sci. Eng. Technol.3(5): 399–402.
Unger J. 1999. Comparisons of urban and rural bioclimatological conditions in the case of a central–European city.Int. J. Biometeorol.
43: 139–144.
United Nations. 2004.World Urbanisation Prospects: The 2003 Revi-sion. United Nations Publications: New York, NY.
United Nations 2008.World Urbanization Prospects: The 2007 Revi-sion. United Nations Population Division: New York, NY. United Nations 2012.World Urbanisation Prospects: The 2011 Revision
Highlights, Department of Economic and Social Affairs, Population Division: New York, NY.
United Nations Population Fund, UNFPA. 2007. The state of world population 2007: unleashing the potential of urban growth. UNFPA, USA.
United Nations Statistics Division 2013. Nigeria. World Statistics
Pocketbook, Country Profile. data.un.org/CountryProfile.aspx? crName=Nigeria.
Watkinson AR, Gill JA, Hulme M. 2004. Flying in the face of climate change: a review of climate change, past, present and future.Ibis
146: 4–10.
William F, Boren SA. 2008. The role of electronic medical record in care delivery in developing countries. Int. J. Inf. Manag. 28: 503–507.
Wolkoff P, Kjaergaard SK. 2007. The dichotomy of relative humidity on indoor air quality.Environ. Int.33: 850–857.
World Health Organisation, WHO. 2011. Regional consultation on health of the urban. InProceedings of the 2010 Regional consultation of Mumbai, India. Regional Office for South East Asia, UNFPA, India.