R E S E A R C H A R T I C L E
Open Access
Formation of chimeric genes with essential
functions at the origin of eukaryotes
Raphaël Méheust
1, Debashish Bhattacharya
2, Jananan S. Pathmanathan
1, James O. McInerney
3,
Philippe Lopez
1and Eric Bapteste
1*Abstract
Background:Eukaryotes evolved from the symbiotic association of at least two prokaryotic partners, and a good deal is known about the timings, mechanisms, and dynamics of these evolutionary steps. Recently, it was shown that a new class of nuclear genes, symbiogenetic genes (S-genes), was formed concomitant with endosymbiosis and the subsequent evolution of eukaryotic photosynthetic lineages. Understanding their origins and contributions to eukaryogenesis would provide insights into the ways in which cellular complexity has evolved.
Results:Here, we show that chimeric nuclear genes (S-genes), built from prokaryotic domains, are critical for explaining the leap forward in cellular complexity achieved during eukaryogenesis. A total of 282 S-gene families contributed solutions to many of the challenges faced by early eukaryotes, including enhancing the informational machinery, processing spliceosomal introns, tackling genotoxicity within the cell, and ensuring functional protein interactions in a larger, more compartmentalized cell. For hundreds of S-genes, we confirmed the origins of their components (bacterial, archaeal, or generally prokaryotic) by maximum likelihood phylogenies. Remarkably, Bacteria contributed nine-fold more S-genes than Archaea, including a two-fold greater contribution to informational functions. Therefore, there is an additional, large bacterial contribution to the evolution of eukaryotes, implying that fundamental eukaryotic properties do not strictly follow the traditional informational/operational divide for
archaeal/bacterial contributions to eukaryogenesis.
Conclusion:This study demonstrates the extent and process through which prokaryotic fragments from bacterial and archaeal genes inherited during eukaryogenesis underly the creation of novel chimeric genes with important functions.
Keywords:Eukaryogenesis, Evolutionary transition, Chimeric genes, Evolutionary genomics, Endosymbiosis
Background
It has recently been demonstrated that endosymbiosis and the subsequent evolution of eukaryotic photosyn-thetic lineages was concomitant with the formation of a novel class of nuclear genes, referred to as symbioge-netic genes (S-genes) [1]. New genes can evolve in many ways [2], including by duplication [3], de novo formation [4], or by the fusion of gene fragments that encode func-tional domains and give rise to novel chimeric proteins [5]. S-genes are in the latter category, and emerged in photosynthetic eukaryotes from the union of domains acquired by endosymbiotic gene transfer (EGT) from the plastid to the host nucleus, with domains of other
origins. S-genes identified in algae and plants are pri-marily involved in the integration of an oxygen-evolving, potentially toxic endosymbiont in the eukaryotic host. Specifically, recycled genetic domains from plastid DNA contributed to the enhancement of metabolic integration and reactive oxygen species (ROS) detoxification in photosynthetic eukaryotes [1].
However, plastids are neither the first nor the only or-ganelles present in eukaryotes [6]. Mitochondrial acquisi-tion occurred earlier, likely driving eukaryogenesis. This major evolutionary transition [7, 8] took place about two billion years ago and involved two prokaryotic partners, one ancestral archaeum [9, 10] and one ancestral alpha-proteobacterium [11, 12]. Even though the details of the genetic, physiological, and structural basis of their merger remain to be established [13, 14], there is a consensus forming that eukaryotes are a genetic chimera because * Correspondence:[email protected]
1Sorbonne Universités, UPMC Univ Paris 06, CNRS, Evolution Paris Seine
-Institut de Biologie Paris Seine (EPS - IBPS), 75005 Paris, France Full list of author information is available at the end of the article
they are comprised of at least two genomes, namely a nu-clear genome and DNA derived from one or two endo-symbionts (i.e., the mitochondrion and plastid) [11].
During the evolution of eukaryotes, the mitochondrial genome has been significantly reduced in size, with many genes being lost and others being transferred, ei-ther intact or in pieces, to the host eukaryotic nucleus through EGT [15–17]. In addition to these EGT-derived genes, a recent analysis reported the presence of bacter-ial genes of non-alpha-proteobacterbacter-ial provenance in the Last Eukaryotic Common Ancestor (LECA). This finding raises the possibility of additional bacterial contributions to the emergence of eukaryotes [18]. Regardless of the number of prokaryotic donors, the nuclear genome of eukaryotes encodes genes inherited both from Bacteria and Archaea. The bacterial sequences primarily encode operational functions, whereas genes of archaeal origin are usually involved in informational functions [19]. In addition to these ancestral genes of symbiotic origin, eu-karyotes also contain lineage-specific genes [20,21] cre-ated during, and after, eukaryogenesis. As a result, numerous eukaryotic features and processes (e.g., the nucleolus, the cytoskeleton, the DNA replication and transcription systems), while inherited from prokaryotes [22, 23], were ‘tinkered’ with and made more complex [24, 25] via the addition of essential components that lack prokaryotic homologs [25, 26]. Furthermore, eu-karyotes have also evolved novel features (e.g., endoplas-mic reticulum, Golgi, peroxisomes, spliceosome) without direct prokaryotic antecedents [27]. These innovations occurred early during eukaryogenesis because LECA was endowed with most of the structural traits present in ex-tant lineages [25–28].
Despite this general knowledge regarding eukaryogen-esis, the origin of many nuclear genes remains poorly understood. For example, one study reported that 63% of eukaryote nuclear genes lack homologs outside of eu-karyotes [21]. In contrast, eukaryotic nuclear genes usu-ally harbor multiple domains, which indicates that their evolution can follow multiple complex paths, including the fusion and fission of domains. Because the nuclear genome of eukaryotes hosts genes from multiple origins (with a pool of genes originating from Archaea and an-other from Bacteria), and because the taxonomic distri-bution of many of these genes indicates they evolved during eukaryogenesis, it is important (and still un-known) to elucidate their provenance. More specifically, did these genes arise via the remodeling of genetic ma-terial from distinct prokaryotic contributors? We pre-dicted that aspects of the leap forward in organizational and compositional complexity from a consortium of pro-karyotes resulted from the evolution of S-genes during the early stages of eukaryogenesis. Phylogenetic methods that use simultaneous alignment of collinear proteins
sharing significant sequence similarity over all, or most, of their lengths are useful to analyze the contribution of transferred intact genes to eukaryote evolution. How-ever, the detection of reticulate sequence evolution, such as the fusion and recycling of domains derived from heterologous proteins, benefits from alternative network approaches. Here, we have used sequence similarity net-works [29] that rely on reconstruction of both full and partial (i.e., protein domain) sequence relationships using pairwise protein similarity values to determine whether S-genes played a critical role in eukaryogenesis.
We report the formation of S-genes (282 gene families) early in eukaryotic evolution. These chimerical proteins contributed essential components to macromol-ecular eukaryotic complexes, such as the ubiquitin sys-tem, the spliceosome, the SSU-processome, and the transcription and translation systems, and were involved in membrane trafficking and lipid metabolism. Remark-ably, in eukaryotic informational genes, we detected twice as many S-genes of bacterial than of archaeal origin, in agreement with Cotton and McInerney [21]. Fundamental eukaryotic properties are thus derived from pieces of prokaryotic genes that have recombined with other domains. Early in their history, and thereafter, eukaryotes exploited domains from multiple co-interacting genomes to retool their own functional rep-ertoire. This observation lies outside of the traditional informational versus operational divide of genetic contri-butions of archaeal and bacterial lineages, respectively, to the origin of eukaryote gene inventories.
Results and discussion Early creation of S-genes
Detection of S-genes
164 from Archaea, totaling 8,422,211 proteins) (Additional file1: Figure S1). Initially, we found that 633 gene families comprised composite eukaryotic genes with a prokaryotic origin, i.e., both the composite eukaryotic genes and at least one prokaryotic gene could be aligned over their full lengths. The origin of these composite genes likely predated LECA. We also found that composite eukaryotic genes in 383 gene families did not share detectable local similarity with prokaryotic sequences, and were thus likely to be eukaryotic innova-tions. Finally, 605 gene families corresponded to S-genes, because only partial sequence similarity was detected between composite eukaryotic and prokaryotic sequences. Of these 605 families, 32 were removed be-cause of the low sequence similarity with prokaryotic se-quences found by using a more sensitive procedure based on hidden Markov model (HMM) profiles. We also checked for full-length homology with genomes from the recently discovered Asgard phylum [10]. Only a single S-gene family encoding tubulin (family 403) ap-pears to have been inherited from the Asgard group; this is not to be taken as evidence against an emergence of eukaryotes from Asgard. Rather, the limited full-length homology between eukaryotic S-proteins and Asgard proteins is compatible with the emergence of eukaryotes from the latter clade. That is, S-genes likely evolved in the branch leading to LECA, rather than in the common
ancestor of LECA and its closest Asgard relative. Finally, five families were removed because the prokaryotic sig-nal detected for the components was likely due to HGTs from eukaryotes to intracellular prokaryotes [33]. The 567 remaining S-genes are of interest because they evolved from combining and recycling at least one gen-etic fragment of prokaryotic ancestry, either archaeal or bacterial, usually with eukaryotic genetic fragments, within a eukaryotic host lineage.
The distribution of S-genes in eukaryotes identifies 282 ancient families
The distribution of S-genes across eukaryotic lineages reveals that 50% of these families (e.g., 282 gene families) are present both in Opimoda and Diphoda and therefore were likely present in LECA (Fig. 1; see also Additional file 3: Figure S3 and Additional file 4: Figure S4 for the time of emergence of S-genes based on alternative eukaryotic trees). Nonetheless, S-genes with a broad dis-tribution across eukaryotic supergroups may be the re-sult of two types (of mutually non-exclusive) processes. The first is that these genes may be genuinely ancient, emerging during eukaryogenesis and retained in various eukaryotic supergroups. Under this scenario, phylogenies of broadly distributed S-genes should support the mono-phyly of each supergroup and potentially resolve super-group interrelationships. The second is that the broad
distribution of S-genes might be the result of horizontal transfer that spread S-genes across eukaryotic super-groups. The latter includes EGT if an ancestral eukaryote engulfed another distantly related eukaryote that encoded S-genes of endosymbiont origin. Alterna-tively, this pattern could result from the horizontal transfer of individual S-genes between distantly related eukaryotes. In these cases, resolved individual phyloge-nies of the S-gene should show a mixture of sequences from different supergroups (i.e., supergroups would not be monophyletic). Distinguishing between these two processes requires well-resolved individual gene trees. To this end, we reconstructed and manually inspected maximum likelihood phylogenetic trees (Additional file 5: Sheet 1) from 255 broadly distributed S-genes (e.g., ≥ 4 sequences from S-genes with > 3 hosts, pro-posed to be ‘ancient’ based on their taxonomic distri-bution, could be aligned; see Methods). These analyses indicate that 85% (216 out of 255) of these S-genes are of ancient origin and were vertically inherited in eukaryotes. Other more complex scenar-ios could not be ruled out to explain the topologies of the remaining S-gene trees.
We posit that the formation of S-genes in the earliest diverging eukaryotes may be an outcome of extensive genome remodeling due to intron invasion [34] and gene duplication in the LECA [3]. We tested this hypothesis by looking at 82 anciently derived (hereafter, referred to as ‘early’) S-gene families present in six well-annotated genomes of Diphoda (Phaeodactylum tricornutum,
Paramecium tetraurelia, Chlamydomonas reinhardtii) and Opimoda (Dictyostelium discoideum,Monosiga bre-vicollis, Capsaspora owczarzaki). We aligned the corre-sponding protein sequences using MAFFT [35], highlighting the position of introns, and checked manu-ally for homologous sequences of at least one Diphoda and at least one Opimoda containing at least one intron, located at a similar position between components (i.e., ± 20 aa of a component borders). Introns shared by Diphoda and Opimoda are possibly ancient, predating the split between these two major lineages (even though convergences regarding the similar positions of these in-trons in different eukaryotic lineages cannot be ruled out). Among tested early S-gene families, 20 displayed at least one ancient intron between their components (Additional file6and Additional file7: Figure S5), a fea-ture consistent with the hypothesis that introns may have contributed to the evolution of some novel genes in eukaryotes [36]. Moreover, 51 S-genes families (including all 20 of the above families) presented likely ancient introns, although located within (and not between) components.
In contrast with early S-genes, S-genes with a re-stricted taxonomic distribution are compatible with their
formation at multiple phylogenetic depths, secondary loss in multiple lineages [37], and/or gene fission [38] of ancestral S-genes. Interestingly, 32% of S-genes are present in a single eukaryotic lineage (184 families), and could serve as synapomorphies (i.e., adaptive functions) for these groups [38]. In particular, within the SAR group, ciliates contain a high proportion of exclusive S-genes (38 families, Additional file 8: Figure S6). Ciliates are known for their complex mechanisms of pro-grammed genome rearrangements [39], which may have facilitated chimeric gene creation [40]. S-genes in ciliates do not seem to fulfil random functions, i.e., they are mostly involved in cellular processes and signaling (21 S-genes), with 13 playing a role in signal transduction mechanisms (Additional file6).
New essential eukaryotic components
Many early S-genes encode components of the informational machinery
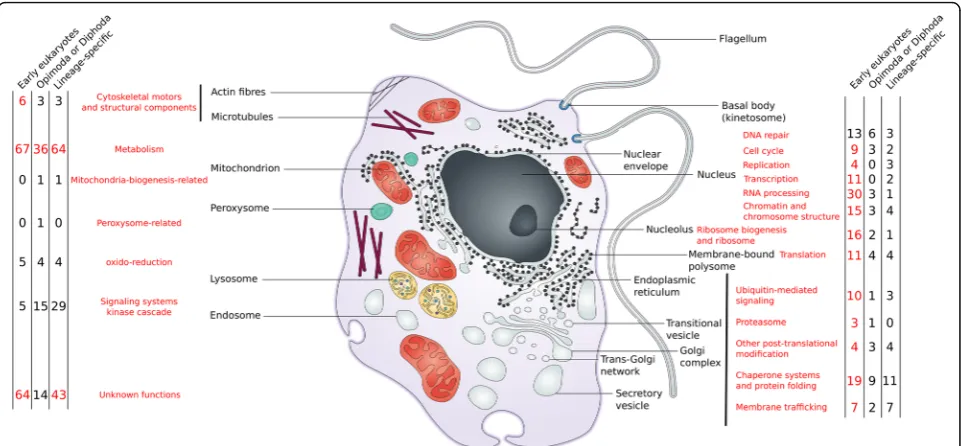
Early S-genes contributed in many important ways to eukaryogenesis. Functional predictions suggest they are involved in cellular processes and signaling, primarily in the‘O’(Post-translational modification, protein turnover, chaperones) category, but also in the ‘U’ (Intracellular trafficking, secretion, and vesicular transport),‘D’ (Cell cycle control and mitosis), and ‘Z’ (Cytoskeleton) cat-egories, in information storage and processing (mainly the ‘A’ (RNA processing and modification), ‘K’ (Tran-scription), ‘L’ (DNA Replication and repair), and ‘J’ (Translation) categories), as well as in metabolism (particularly the‘I’(Lipid metabolism) category) (Fig.2).
difficult to establish. Genotoxicity might be one of many barriers to the success of such endosymbioses [42, 43]. During early eukaryogenesis, the DNA within the proto-mitochondrion was likely adversely impacted by the chem-ically harsh environment resulting from the inclusion of that organelle within its host [44]. In addition, the organelle generated ROS, rendering the cellular environment toxic for host DNA if this genome was not protected by the nu-clear membrane. Two out of three components of the
MRX complex, involved in repairing DNA double-strand breaks using homologous recombination [45], are S-genes (families 18,347 and 18,341) that provide protection from genotoxicity. Interestingly, S-gene MRE11 (family 18,347) of the MRX complex is also involved in meiotic double-strand DNA breaks repair inCaenorhabditis elegans[46], suggesting a potential link between MRX S-genes and the evolution of sex. None of the yeast nuclear pore complex proteins are descended from early S-genes. This is either
Fig. 2Functional annotation of the 573 S-genes based on COG categories. S-gene families were divided into early (S-genes found in both Opimoda and Diphoda, 286 gene families, in blue), intermediate (S-genes found either in Opimoda or Diphoda, 101 gene families, in pink), and lineage specific (S-genes found in one eukaryotic supergroups, 186 gene families, in green) (COG category definitions can be found
here:http://eggnogdb.embl.de/download/eggnog_4.5/COG_functional_categories.txt)
because LECA lacked a nucleus, implying that, in addition to a possible sensitivity to genotoxic substances, early hosts of the mitochondria presented less barriers to lateral gene transfer (LGT). Alternatively, there was a nucleus, but the nuclear pore complexes were not affected by this form of genetic remodeling (i.e., the use of a prokaryotic fragment).
Some S-genes may have resulted from the crystallization of ancient associations
S-gene evolution addressed yet another challenge faced by eukaryotes, namely that early eukaryotic cells were larger and more compartmentalized than individual pro-karyotic cells, which presumably limited protein–protein interactions because these interactions require some form of coordinated intracellular targeting. We report 282 occurrences of the physical association of multiple domains in a single novel eukaryotic gene, whereas these domains are not so tightly connected in prokaryotes. This genetic remodeling ensured the direct interaction of these domains once translated into proteins in the eukaryotic cell. In contrast, domains encoded by separ-ate genes are less likely to be able to interact in a larger compartmentalized cell [47]. Consistent with this notion that S-genes stabilize functional interactions, and assum-ing that some operons were inherited from the bacterial and archaeal partners, we infer that 19 ancestral pro-karyotic operons, encoding functions such as proton transport, transmembrane transport, or DNA-templated transcription, fused into S-genes during early eukaryote evolution. The transformation of operons into S-genes facilitates the coordinated expression of interacting pro-teins and presumably solved the problem of decoupled transcription and translation in eukaryotes (Table 1). The sparse taxonomic distribution of 14 other prokary-otic operons suggests they evolved into S-genes later during eukaryotic evolution, or were secondarily lost from eukaryotic lineages.
S-gene-encoded proteins are not enriched in targeted proteins In silico predictions indicated that approximately 110 S-genes are targeted to organelles (19%) (Additional file6). Among them, 34 families contain more than 50% of their members predicted as mitochondrion targeted (Additional file 6). Of note, proteins encoded by the early operon-like S-gene family 4453 are targeted to mitochondria. These genes encode the alpha and beta subunits of NAPH transhydrogenase. Another interest-ing S-gene is the family 3528 encodinterest-ing a protein kinase (PKP2) in Saccharomyces cerevisiae, which negatively regulates pyruvate dehydrogenase [43]. Surprisingly, S-genes are significantly depleted in targeted proteins (Z-score −4.89, P= 9.93 × 10⁻⁷). This limited propor-tion of targeted S-genes contrasts with the 64% of targeted S-genes found in Kaessmann’s study [2] and
can be seen as counter-intuitive. We hypothesize that this result highlights the diversity of the roles played by S-genes during eukaryogenesis. Whereas, in photo-synthetic eukaryotes, the vast majority of S-genes are involved in the photosynthetic function, the chal-lenges faced by the first eukaryotic cells extended be-yond the scope of the acquisition of a novel organelle (e.g., dealing with a bigger cell and dealing with nu-cleic parasites).
Many S-genes may also have contributed to the increase of cellular complexity
Many early S-genes are involved in chaperone systems and protein folding that may also have contributed to dealing with an increase in cell complexity [3]. Six S-gene families containing a DnaJ domain and 11 S-S-genes with isomerase activities act as chaperones and folding catalysts (Additional file6). S-genes are also involved in intracellular trafficking, such as the Golgi-REG interface vis-à-vis the COPI and COPII coating machineries (fam-ilies 3724, 3693, 63,542, and 7977). Finally, early S-genes were frequently involved in post-translational modifica-tion and protein turnover, with at least 14 S-genes be-longing to the ubiquitin system and the proteasome. These proteins, although of archaeal origin [48], are known to have diversified via architectural rearrange-ments in early eukaryotes with the evolution of further complexity in some lineages [49]. In a primitive eukaryotic cell already harboring complex endomem-brane compartments, early developments in post-translational and trafficking systems were likely to have been advantageous. Early S-genes also contributed meta-bolic functionality with involvement in lipid transport and metabolism, with six represented in glyceropho-spholipid metabolism, which is important for membrane biogenesis (Additional file10: Figure S8). Of note, subse-quent lineage-specific tinkering of metabolic S-genes was an important process as illustrated by the number of metabolic S-genes with a lineage-specific distribution (Additional file8: Figure S6).
because 51 of them encode proteins involved in macro-molecular complexes, 34 of which contribute to key eukaryotic informational macromolecular machineries in yeast (Additional file6).
Phylogenetic origins of S-genes
Taxonomic assignment of the components of S-genes The origin of each S-gene component (i.e., archaeal, bac-terial, or prokaryotic in general) was identified based on the top ten BLASTP hits (see Methods and Additional file 11: Figure S9). When components were only found in eukaryotes (lacking a match with any prokaryotic se-quence), we performed a HMMER search to confirm that the components of these S-genes were not homolo-gous to prokaryotic sequences that may have diverged
beyond recognition using BLASTP (see Methods and Fig.4). A straightforward interpretation for components limited to eukaryotes is that they evolved after eukaryo-genesis and have a non-symbiogenetic origin as eukaryote-specific components.
We also performed maximum likelihood phylogenetic analyses of the 429 S-genes with at least one archaeal (Additional file5: Sheet 2) or bacterial (Additional file5: Sheet 3) component to confirm our BLAST-based assig-nation of these components. All of these phylogenies were both bioinformatically and manually inspected to assign an origin to each component of the 429 S-genes (e.g., archaeal or bacterial, or when uncertain regarding the prokaryotic domain of its origin, simply prokaryotic). We used several criteria to interpret these trees. First,
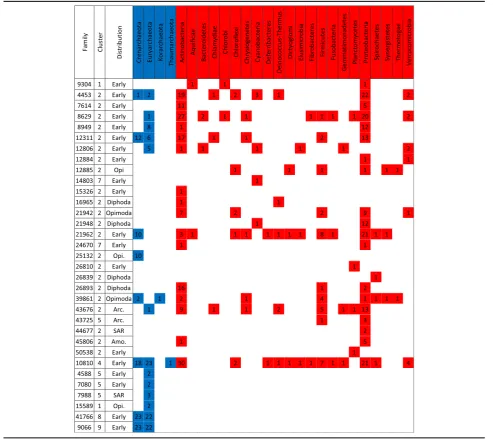
Table 1The 33 operon-like composite families, along with the prokaryotic phyla where these operons were detected
although we looked at the 500 top hits, some compo-nent trees were exclusively comprised of (1) either ar-chaeal and eukaryotic sequences, or (2) bacterial and eukaryotic sequences. For those trees, the origin of the components is clear, in agreement with the BLAST as-signation. Second, we rooted the component trees har-boring bacterial, archaeal, and eukaryotic sequences between Bacteria and Archaea, when possible (i.e., when ancient paralogy and LGT between Archaea and Bacteria did not prevent such a conventional rooting of the com-ponent tree). In this set of rooted phylogenies, we tested whether the eukaryotic components from the S-genes were nested in the Archaea (or in the Bacteria), and were monophyletic. This approach allowed us to confirm the archaeal or bacterial origin of the components of S-genes (Additional file 5: Sheets 2 and 3). Finally, the remaining trees were inspected manually. Regarding 410 out of the 429 families for which phylogenetic trees of bacterial and archaeal components could be recon-structed, 320 families returned phylogenetic trees of components that are consistent with the BLASTP as-signment, 15 families show inconsistent phylogenetic trees and BLASTP assignations, 39 families have incon-clusive (i.e., too weakly resolved) phylogenetic trees for
all their components, and 36 families are only inconclu-sive for some of their components, i.e., they have at least one inconclusive phylogenetic tree for a component, yet at least another informative phylogenetic tree, for a dif-ferent component, that is consistent with the origin as-signment based on BLASTP. These two independent analyses agree for the majority, and most importantly, are largely not incongruent (only 15 families showing in-consistency). They also identify 320 S-gene families that are supported both by the phylogenetic analysis and the BLASTP assignation, whereas 90 S-gene families are assigned to a given phylogenetic origin only based on the BLASTP inference (Additional file 6). A finer-grained analysis of the origins of the bacterial compo-nents identified two bacterial phyla, the Proteobacteria (26%) and the Cyanobacteria (21%), as major contribu-tors (Additional file12: Sheet 2). This is compatible with the notion that the ancestors of the mitochondria and plastids are the most important contributors to bacterial genes in eukaryotes [37]. However, additional phyla contributed to S-genes, including Firmicutes (9%), Chloroflexi (6%), Bacteroidetes (6%), and Actinobacteria (6%), indicating multiple bacterial donors to the eukaryotic gene inventory, as proposed by Pittis et al.
[18] (but see [50,51] for alternative explanations for this apparent diversity of bacterial sources).
Components of S-genes do not associate randomly
Clustering S-genes based on the phylogenetic origin of their components showed that components do not asso-ciate randomly (Fig.4). Very few S-genes (only 8; cluster 6 in Fig. 4) have combined fragments of archaeal and bacterial origins. This result might be surprising if one considers that genetic fragments from these two pro-karyotic sources have co-occurred in the same genome for about two billion years [11]. In fact, most S-genes (387; clusters 2, 3, 5, and 7) contain a component of bac-terial origin that is either combined with another bacter-ial (203; clusters 2 and 7) or eukaryotic component (122; cluster 3), whereas only 42 S-genes with a component clearly of archaeal origin were identified (clusters 6, 8, 9, and 10). In order to understand this limited number of S-genes derived from Archaea, we looked in detail at clusters 1 (60 S-genes), 4 (62 S-genes), 5 (62 S-genes), and 10 (4 S-genes), which correspond to S-genes with components of prokaryotic origin (i.e., components simi-lar to prokaryotes that we cannot assign to Archaea or Bacteria, according to our parameters). We observed that 47, 37, 35, and 2 families in clusters 1, 4, 5, and 10, respectively, contain at least one archaeal se-quence in the top three hits of their components (Additional file 12: Sheet 1). These observations sug-gest that some families in these clusters may contain components of archaeal origin that are identified as prokaryotic because of the limited number of genomes available from Archaea.
We also looked in detail at the phylogenetic trees of the 42 S-genes with at least one archaeal component to verify that our approach did not miss the‘ultimate’ ori-gin of some of these archaeal components. This ad-dresses the possibility that these sequences originated from bacterial genomes, and were then transferred to an archaeal major group (consistent with previous work [52, 53]), before being inherited by eukaryotes. If the eukaryotic components for which BLAST assigned an ar-chaeal origin were nested within Archaea in a rooted tree of life, then the‘proximate’origin of such bacterial-then-archaeal-components would still be archaeal, be-cause they entered eukaryotes via the archaeal partner. To determine whether the ultimate origin of the eukaryotic component might nonetheless be ‘bacterial’, we analyzed the taxonomic distribution within the ar-chaeal (and eukaryotic) clade on the one hand, and the taxonomic distribution within the bacterial clade on the other. We reasoned that, if the component gene/domain present in the Archaea was acquired from Bacteria at the time one major archaeal group evolved, then the di-versity of Archaea hosting this gene/domain should be
restricted to one archaeal major group. When that was the case, the tree topology could suggest that the gene was first transferred from a bacterium to an archaeum, then inherited from an archaeum, and subsequently recycled and used as a component in a eukaryotic S-gene. We identified two such components (Additional file 5: Sheet 2). When, by contrast, the taxonomic distri-bution of Archaea was broader than a single archaeal major group and, likewise, when the taxonomic distribu-tion of Bacteria was also broad, the component gene/do-main was likely of ancient prokaryotic origin (i.e., originated before the split of Archaea and Bacteria), and the component tree provided no positive evidence for an ultimate bacterial origin; there were 19 such compo-nents. Finally, a third class of 25 component trees re-quired visual inspection (because of ancient paralogy, recent LGTs, or phylogenetic artefacts leading to com-plex relationships between taxa; Additional file 5). In those trees, only two appeared compatible with an ultimate bacterial origin. Thus, the results showed that S-genes are largely of bacterial origin, whereas S-genes with archaeal components are more rare, which is consistent with the analysis of full-length genes [54].
Specific examples of these S-gene categories will help highlight the diversity of their origins during eukaryo-genesis. For example, family 12,448 (Fig. 5a) illustrates the merging of components from very different origins. This ARC-BAC S-gene family is involved in the biosyn-thesis of the hypermodified tRNA base wybutosine [55], which enhances the accuracy of translation [56]. Although in eukaryotes, the wybutosine biosynthesis pathway is likely derived from the archaeal ancestor [57], we report here the fusion of a bacterial domain. This results in a protein with a unique domain architec-ture consisting of an N-terminal flavodoxin region of bacterial origin (Fig. 5b) and a C-terminal catalytic do-main TYW1 of archaeal origin [57] (Fig.5c). TYW1 is a member of the radical SAM superfamily that binds iron-sulfur clusters. The role of the flavodoxin-like domain is not known; however, all radical SAM enzymes require the reductive activation of the iron-sulfur cluster by an external reductant which, in vivo, is thought to be flavo-doxin or a related protein [55]. Thus, this association of two domains could have resulted in an emergent prop-erty at the level of S-proteins, i.e., the bacterial domain reduced the iron sulfur cluster of the archaeal domain, without the need for an external reductant.
Spb1p, is nucleolar and essential [58]. Spb1p is required for ribosome synthesis [58] because it catalyzes the methylation of guanine at position 2922, a universally conserved position at the catalytic center of the ribo-some that is essential for translation, during maturation of the 27S pre-rRNA [59].
An even more common type of domain association involves components with a bacterial origin with com-ponents of eukaryotic origin. This type of fusion is ex-emplified by the evolution of a subunit of a translation elongation factor, family 6384 (Additional file14: Figure S11A). Eukaryotic translation elongation factors (eEF) include eEF1A and eEF1B, which recruit aminoacyl-tRNAs onto the ribosome [60]. S-gene family 6384 en-codes the gamma subunit of translational elongation factor eEF1B. These S-proteins are comprised of two domains, which are connected through a highly polar central lysine-rich stretch of residues (Additional file
14: Figure S11A). The N-terminal region encodes a glutathione S-transferase domain of bacterial origin [61] (Additional file 14: Figure S11B), whereas, al-though highly conserved in eukaryotes, no sequence or structural homology with known functional domains has thus far been described for the C-terminal region [60]. This region of eukaryotic provenance has been pro-posed to interact with another eEF1B gamma subunit to support the quaternary structure of the eEF1B complex [60]. In humans, the N-terminal region interacts with the alpha and epsilon subunits [62]. No clear enzymatic func-tion has been associated with eEF1B gamma proteins, but it is likely that its main role is to ensure the proper scaf-folding of the different subunits in the eEF1B complex, as well as to direct its intracellular localization [60]. The eEF1B gamma subunit is also a substrate for CDK1/cyclin B, suggesting its possible role in the control of expression during the cell cycle.
Finally, some S-genes reinforce pre-existing interactions between proteins (and their domains). This class of S-genes is illustrated by family 9304, characterized by Gawryluk et al. [63]. This family associates components of prokaryotic origin (Additional file 15: Figure S12A) that are organized in an operon. In eukaryotes, the S-gene family encodes an ATP-citrate lyase of two distinct and fused subunits A and B (Additional file 15: Figure S12B and S12C). ATP-citrate lyase catalyzes the ATP-dependent cleavage of citrate into oxaloacetate and acetyl-CoA, a key metabolite because acetyl-CoA is involved in multiple essential metabolic pathways in eukaryotes [64]. Interestingly, the phylogenetic trees corresponding to each subunit are congruent, strongly suggesting that the two subunits have a shared history (Additional file 15: Figure S12B and S12C), consistent with the existence of a select-ive pressure for their co-occurrence in genomes.
Functions of S-genes correlate with their component origins The phylogenetic origin of S-gene components also cor-relates with functions (Fig. 4). S-genes with archaeal components (clusters 6, 8, 9, and 10 in Fig. 4) (42 S-genes) are primarily associated with informational func-tions (28/42) (χ2 test, adjusted P = 0.00311, Additional file 15: Figure S12), whereas S-genes of bacterial origins (clusters 2, 3, 5, and 7 in Fig.4) are primarily involved in operational functions, typically metabolism (clusters 2 and 7, 79/203 S-genes involved in metabolism) (χ2 test, adjustedP = 0.03094, Additional file16: Figure S13). S-genes with bacterial and eukaryotic components are enriched in cellular processes and signaling such as sig-nal transduction (13 families), chaperones (8 families carry DnaJ domain), or trafficking (10 families) (54/122 S-genes in cluster 3 are involved in cellular processes and signaling) (χ2test, adjustedP = 0.07106, Additional file 16: Figure S13). At first glance, the evolution of S-genes thus seems consistent with the findings by Rivera and Lake [19] on the origin of eukaryotic genes, i.e., tact genes inherited from an archaeal ancestor are in-volved in informational functions, whereas intact genes of bacterial origin are involved in operational functions. However, although this correlation exists for S-genes in relative proportion, when the number of families is con-sidered, S-gene families with bacterial origins encode twice as many informational processes (62) than S-gene families with archaeal origins (28). In yeast, for 209 de-scribed informational genes [54], a vast majority are of archaeal origin (146). However, for the subset of these informational genes that we classified as S-genes, the proportions are shifted. Thus, even though S-genes only represent about 19% of the yeast informational genes, their evolution contrasts with that of informational genes in general, and is strongly impacted by genes of bacterial origin.
Thus, there is a large hidden bacterial contribution to the evolution of eukaryotes, beyond operational functions, consistent with the work of Cotton and McInerney [21]. Identifying a dominant bacterial signal in eukaryotic infor-mational genes may be explained by the inability to iden-tify bona fide archaeal homologues due to a much smaller database of available genomes from these prokaryotes. Regardless, we feel that explaining this finding is not triv-ial, and we can only speculate. Because the host was likely an archaeum, replacing genes that encode a significant fraction of the informational machinery of archaeal origin with bacterial genes might have been counter-selected in chimeric eukaryotic lineages. However, modifying minor components of this machinery may have been less detri-mental given the‘rain’of bacterial DNA originating from the mitochondrial endosymbiont, or possibly from other bacterial symbionts [18, 65]. Another explanation for the seemingly higher evolvability of bacterial genes may come from a more specific consideration of the informational processes, i.e., these S-genes with bacterial domains are largely involved in RNA processing (Additional file 17: Figure S14). For example, 10 such S-genes are associ-ated with the spliceosomal machinery (Additional file9: Figure S7), and therefore these informational bacterial components may theoretically derive from the genome of the mitochondrial ancestor. Indeed, the spliceosome, a new informational machinery that evolved in eukary-otes, appears in part to be derived from group II introns – thus from bacterial DNA [66]. However, analyses of trees from the uncontroversial bacterial components of these S-genes did not recover a signal for such an Alpha-proteobacterial origin. The comple-mentary observation, a possible subgenic contribution of Archaea to eukaryogenesis, is not supported by our data. That is, Archaea did not contribute many genetic fragments to S-genes associated with operational genes in eukaryotes. Thus, not only at the gene level [54], but also at the subgenic level, the evolvability of genes derived from Archaea appears more limited than that of Bacteria in nuclear genomes. Whereas S-genes with bacterial components are found in all functional categories, this is not the case for S-genes with archaeal components.
Small domains do not impact the results
tend to be involved in physical interactions. They have been linked with the evolution of eukaryotes and of or-ganismal complexity [67,68]. For these reasons, it is im-portant to note that 30% of S-genes are comprised of such small and low complexity domains. Among the do-mains present in S-proteins, WD40 is the most frequent (64 S-protein families). In S. cerevisiae, 16 S-gene fam-ilies contain WD40 domains, all of which are ancient and 10 of which have been found to be essential (Additional file 6). WD40 acts as a scaffold to recruit other molecules [69,70], consistent with the finding that 9 S-proteins are involved in macromolecular machines such as the processome and the spliceosome (Additional file 6). Of note, three families are annotated only as WD40 domains (families 3840, 6543, 9846); however, two of them have known functions in ribosome biogen-esis (PWP1, family 9846) [71] and in the spliceosome (CDC40/PRP17, family 6543) [72], confirming that, in spite of their simple domain architectures, these proteins have important roles in the cell. Regardless of their bio-logical importance, the phylogenetic origin of WD40 do-mains is a matter of discussion because the results pinpoint to a cyanobacterial origin (Additional file 12), although many of the families carrying WD40 domains, such as COPI (family 3693), COPII (family 3724), PWP1 (family 9846), and PWP2 (family 5265), are pan-eukaryotic, which is inconsistent with the current know-ledge about eukaryogenesis. This can be due to bad taxonomic assignment. We verified that our initial as-signments of the origins of small and low complexity do-mains to archaeal or bacterial origins did not bias our results or explain the trends with regard to phylogenetic origins and functions of S-genes. To this end, we re-analyzed the data under a more conservative assump-tion, specifying that all small/low complexity domains are generally assigned to a prokaryotic origin, i.e., not specifically bacterial or archaeal (Additional file 6). This approach resulted in the same conclusions concerning S-genes, indicating that the presence of small and low complexity S-gene domains did not strongly impact our inferences (Additional file18: Figure S15 and Additional file19: Figure S16).
Conclusions
Given the complex nature of eukaryogenesis, it is not surprising that valuable genetic information was exploited in many different ways to remodel host cell biology. Our results demonstrate that S-genes were a key part of this process, with 282 composite sequences having formed during the early phases of eukaryogenesis. We propose that these S-gene families helped address many of the challenges faced by early eukaryotes by en-hancing the informational machinery, processing spli-ceosomal introns, countering genotoxicity within the
cell, and ensuring functional protein interactions in a larger, more compartmentalized cellular environment. Moreover, it is surprising that only 42 S-genes contain an archaeal domain, which, on a per-gene basis, is about nine-fold less than that provided by Bacteria. Further-more, in terms of the absolute number of gene families, Bacteria made a two-fold greater contribution to infor-mational functions than Archaea. Therefore, fundamen-tal eukaryotic properties do not strictly follow the traditional informational/operational divide for archaeal/ bacterial contributions to eukaryogenesis.
Methods
Dataset construction
A protein sequence database was assembled by down-loading every archaeal, viral, and plasmid genome that was annotated as ‘complete’ according to the NCBI Genome database on November 2013 (152, 3769, and 4294 genomes, respectively). Regarding Bacteria, one representative genome was chosen randomly per eubac-terial family (230 genomes). Finally, 38 unicellular eukaryotic genomes and their organelle genomes were sampled across the eukaryotic tree of life–19 for photo-synthetic organisms and 19 that are non-photophoto-synthetic, with a comparable total gene number and phylogenetic diversity in their ribosomal proteins. The resulting 2,192,940 protein sequences were used to perform an all-versus-all sequence comparison using BLASTP [30] (version 2.2.26) (30% protein identities cut-off in agree-ment with [73], E-value cutoff 1 × 10⁻⁵ and using the soft-masking parameter for low complexity regions) (see Additional file20for the list of genomes used).
Domain and functional annotations
Domains were predicted using the Conserved Domain Database [31] (CDD) (version 3.13) (default parameters) and Pfam [32] (version 29.0) (default parameters). Sequences were functionally annotated by the category of their best HmmScan [74] match (version 3.1) (E-value cut-off 1 × 10⁻⁵) against eukaryotic EggNog database [75] (ver-sion 4.5).S. cerevisiaegenes were annotated with the DEG database [76] (version 13.3) and protein–protein interac-tions with the BioGRID database [77] (version 3.4.136).
Detection of S-gene families
Connected components in this graph were considered protein families. Families with only eukaryotic se-quences, at least three different eukaryote species, more than 50% of genes detected as composite by FusedTri-plets, and with at least two domains, were kept for fur-ther analysis. In order to verify that no proteins from families have full-length homologs with prokaryotic se-quences, each protein was blasted against an extensive prokaryotic dataset including Asgard genomes (2540 from Bacteria and 164 from Archaea, 8,422,211 pro-teins). If all sequences of a family lacked full-length ho-mologs (i.e., no mutual alignment coverage > 80%) but showed partial similarity with prokaryote sequences, the composite family was considered an S-gene family. These families were used to create HMM-profiles using hmmbuild (default parameters) from the HMMER [74] suite (version 3.1b2) to search for distant homology. The corresponding HMM-profiles were used to screen the extended prokaryotic dataset using hmmsearch (E-value: 1 × 10⁻⁵). When a full-length match (≥80% mutual coverage) was identified between an S-gene and a pro-karyotic gene, the corresponding family was removed from the list of S-gene candidates.
In theory, one S-gene could ultimately encode a non-S-protein, if the prokaryotic domain(s) of this S-gene were spliced out. However, since we analyzed S-proteins here, by definition, the pools of S-proteins we detected had to be associated with S-genes (i.e., composite genes including some prokaryotic domains). Therefore, in this work, we used the terms S-genes and S-proteins inter-changeably. For each S-gene, prokaryotic component se-quences were clustered into component families according to the following rule: if two component se-quences overlapped by more than 70% of their lengths on the protein composite, they belonged to the same component family. A refining procedure was performed to merge overlapping and/or nested component families. Two component families were merged if one family was included by more than 70% of its length into the other.
Within each S-gene family, each component sequence received a taxonomic annotation by BLAST, based on the top 10 BLAST hits with prokaryotic sequences. Namely, if the ten best prokaryotic BLAST hits for a component sequence, according to the BLASTP bitscore against the composite gene, matched with a unique pro-karyotic domain (e.g., Archaea or Bacteria), the compo-nent was considered to have originated from that prokaryotic domain. If there were less than ten best pro-karyotic BLAST hits for a component sequence, or the ten best BLAST hits returned both archaeal and bacter-ial sequences, the component was considered to origin-ate from prokaryotes. This assignation was realized for all individual components within an S-gene family, and subsequently summarized to represent the proposed
origin(s) of homologous components within that S-gene family (Additional file10: Figure S8). Thus, each S-gene family received a ratio that represented the proportion of the components with a given origin (ARC, BAC, PROK, EUK).
A more conservative taxonomic assignment was per-formed by considering the components carrying the follow-ing small and low complexity domains (accordfollow-ing to the CDD database) as prokaryotic (LRR_4, WD40, LRR_RI, ANK, Kelch_1, Kelch_2, Kelch_3, Kelch_4, Kelch_5, Kelch_6, TPR, TPR_1, TPR_2, PPR, UBQ, MORN, FNI, Ube1_repeat1, Ubiquitin, TF_Zn_Ribbon, Zn-ribbon_TFIIS, UBL, RCC1, Ube1_repeat2, EFh, Kelch, FNIP, TPR_10, TPR_17, Zpr1, zf-ZPR1, UBA_EF-Ts, Ubox, S1, ZnF_C3H1, DnaJ, RING, UBA_PLICs, UBL, ZnF_C3H1).
The presence of components exclusively found in eu-karyotes (i.e., without prokaryotic sequence hits) does not demonstrate that these domains are truly of eukaryotic origin. We cannot exclude the possibility that high divergence in eukaryotes and/or prokaryotes de-creased sequence similarity to prokaryotic domains be-yond recognition by BLAST. We tried to minimize the number of such potential false positives by using HMMER to detect distant homology. All components with proposed eukaryotic origins were used to build HMM-profiles with hmmbuild (default parameters). These profiles were used to screen the prokaryotic se-quences from the extended prokaryotic dataset using hmmsearch (E-value: 1 × 10⁻⁵). All of these results were manually inspected.
Operon-like composite detection
Operon-like composites were detected using the ProOpDB database [78], in which 191/382 genomes used in this study are referenced. Briefly, if two components of a composite were found in an operon in the same prokaryote, the composite was considered as an operon-like composite.
Subcellular localization and enrichment test
Subcellular localizations were predicted using TargetP [79] (version 1.1b) using–P parameters for genes carried by photosynthetic organisms and–N for others. If more than 50% of the members of a family were predicted as targeted to a particular location, then this was taken to represent the family. In order to test if these S-proteins are enriched in targeted proteins, 573 non-S-protein families were randomly sampled 100 times.
Phylogenetic analysis
inferred using the maximum likelihood method imple-mented in IQ-TREE [81] (version 1.4.4) (parameters:
–TEST -bb 1000). For each reconstruction, the best model was selected using the –TEST parameter and 1000 ultrafast-bootstraps were computed.
Regarding the phylogenetic reconstructions of the full-length gene families, the relative age of broadly distrib-uted genes was determined as follows. For each S-gene tree, we retrieved all its resolved partitions (with bootstrap support ≥ 85%) and verified that these parti-tions were not mixtures of sequences from eukaryotic supergroups. A total of 147 phylogenetic trees (e.g., 58% of the trees) did not show such mixing of sequences from different supergroups. Therefore, for all these S-genes, there is a priori no positive evidence of introgres-sion of genes and the broad distribution of these S-genes is likely explained by vertical descent since they evolved in the LECA. A total of 108 phylogenetic trees showed at least one resolved partition with sequences from different supergroups. These 108 trees were visu-ally inspected and conservatively interpreted. First, we verified whether Opimoda and Diphoda were mixed in this/these partition(s). When sequences from these two groups are not mixed, then there is no positive evidence for an LGT between these major groups, and therefore the distribution in Opimoda and in Diphoda is likely to be explained by ancient vertical acquisition in their last common ancestor. Second, we verified whether only Diphoda were mixed in this/these partition(s), which is compatible (and even expected) in case of EGT and LGT or contamination. Based on these observations, we assigned a putative age to the gene family as old, if the S-gene distribution is primarily explained by vertical descent; likely old, when the mix between Opimoda and Diphoda was limited (for example, compatible with re-cent LGT that might explain the presence of the s-gene in some taxa but not in all of these taxa); and inconclu-sive, when LGT between Opimoda and Diphoda could not be ruled out.
Regarding the phylogenetic reconstructions of the components of S-genes, HMM profiles of components were built and used to screen the prokaryotic database. For each profile, the 500 prokaryotic sequences having the best bitscores were retrieved (hmmsearch E-value: 1 × 10⁻⁵
). When possible, the top 50 archaeal and 50 bac-terial sequences were kept for the phylogenetic recon-structions. The archaeal or bacterial origins of components were determined as follows. First, compo-nent trees were exclusively comprised either of archaeal and eukaryotic sequences, or of bacterial and eukaryotic sequences. For those trees, the origin of the component is trivially archaeal (or bacterial). Second, for trees har-boring bacterial, archaeal, and eukaryotic sequences, trees were rooted between bacteria and archaea, when
possible (i.e., ancient paralogy and LGT between archaea and bacteria may prevent such a conventional rooting of the component tree). Next, in this set of rooted trees, we tested whether eukaryotic components from the S-genes were nested in the Archaea (or in the Bacteria). Third, the remaining trees were manually inspected. When the phylogeny does not allow the origin assignment, the trees were considered as inconclusive.
Additional files
Additional file 1:Figure S1.Protocol used for the detection of S-gene families. A. Sequences have been clustered in gene families. B. Composite genes have been detected using FusedTriplets. C. Gene families detected as composite and having at least two domains have been kept for further analysis. D. Composite gene families only found in eukaryotes and having at least one component of prokaryotic origin were considered as S-gene families. (PNG 970 kb)
Additional file 2:Figure S2.Two-dimensional density graph of percentage of families detected as composite according to FusedTriplets (x-axis) and with at least two known domains according to Pfam (A) and CDD (B) (y-axis). Each point corresponds to a family. Since these points can stack, isodensity lines in blue delimit regions having constant density. (PNG 2568 kb)
Additional file 3:Figure S3.Alternative phylogeny of eukaryotes, based on Burki et al. [84], that shows the distribution of 573 S-gene families. Family evolution reconstruction was performed using Dollo parsimony. The four boxes correspond to the number of families involved in metabolism (red), information storage and processing (blue), cellular processes and signaling (green), and poorly characterized processes (white). Few families are found in the internal node of Archaeplastida and Cryptophyta (seven families) and in the internal node of SAR and Haptophyta (four families). (PNG 585 kb)
Additional file 4:Figure S4.Putative phylogeny of eukaryotes, based on He et al. [85], that shows the distribution of 573 S-gene families. Family evolution reconstruction was performed using Dollo parsimony. The four boxes correspond to the number of families involved in metabolism (red), information storage and processing (blue), cellular processes and signaling (green), and poorly characterized processes (white). This tree topology decreases dramatically the number of early families (152 families). However, this change is largely dependent on the unbalanced distribution of genomes between Discoba (only three genomes) and the Opimoda + Diphoda group (35 genomes). (PNG 594 kb)
Additional file 5:Results of phylogenetic analysis of S-gene families and of components of S-genes. (XLSX 78 kb)
performed using TargetP. Columns AA, AB, AC, and AD correspond to the ratio of protein members having a mitochondrion transit peptide, chloroplast transit peptide, a signal peptide, and any other location, respectively. Column AE is the general annotation regarding whether the family is targeted or not (if more than 50% of the members of a family were predicted to contain a signal or a transit peptide, the family was considered as targeted). Columns AF and AG correspond to information about intron conservation within and between components, respectively. (XLSX 208 kb)
Additional file 7:Figure S5.One example of intron position conservation between one Opimoda (M. brevicollis, gi: 167536479) and one Diphoda (P. tetraurelia, gi:145550193) S-genes (family 11,734). Each sequence is represented in red. The yellow circles represent the intron positions on the sequence. The black segments on top of each sequence show the component positions. Their position is also mapped on the S-genes in blue. Each conserved intron is numbered. The conserved introns localized between two components are in orange. (PNG 263 kb)
Additional file 8:Figure S6.Distribution of 573 S-gene families across eukaryotic species. The heatmap represents the presence (black line) or absence (white line) of a given S-gene family in a eukaryotic species (each line represents a given species, each column represents a given family). Eukaryotic species are colored with respect to their classification into major supergroups (light green: Archaeaplastida, dark yellow: Cryptophytes, yellow: Haptophytes, light blue: Rhizaria, blue: Alveolates, purple: Stramenopiles, brown: excavates, red: Opisthokonts, orange: Amoebozoa). The colored top bar indicates the functional annotation of the S-gene families according to COG (red: metabolism, blue: information storage and processing, green: cellular processes and signaling, white: poorly characterized). The heatmap is structured along its x-axis, based on the number of eukaryotic supergroups containing the S-gene family, binned in decreasing order (from the left: S-gene families distributed in all nine supergroups, to the right: S-gene families present in a single supergroup but in at least three species; each bin is separated by a thin red line). (PNG 638 kb)
Additional file 9:Figure S7.KEGG map of the spliceosome showing the 15 S-genes in green (4504: Prp19, 3721; U1A/U2B”, 6543: Prp17, 5353: SF3b, 16,534: SF3b, 60,389: SF3b, 14,116: U2AF, 39,809: PUF60, 20,969: SR140, 7536: Prp31, 3214: Brr2, 4638: Syf, 8301: RBM22, 7062: AQR, 60753: SR). (PNG 47 kb)
Additional file 10:Figure S8.KEGG map of the glycerophospholipid pathway showing the 6 S-genes (26,775: 1.1.1.8; 19,545: 2.3.1.42; 60,473: 2.7.1.107; 5156: 2.7.7.14; 30,146: 3.1.4.4, 26,228: LPGAT/LPCAT, 26810: BTA1). (PNG 42 kb)
Additional file 11:Figure S9.Protocol used for the taxonomic assignment of S-gene families. A. For each component of S-proteins, taxonomic assignment was performed based on the 10 best BLASTP hits. B. Taxonomic assignment information was summed up at the family level, each S-gene family received a ratio that represented the proportion of the components with a given origin (ARC, BAC, PROK, EUK). These values were then used to cluster families having similar component origins (Fig.4). (PNG 480 kb)
Additional file 12:Detailed origin of prokaryotic S-gene components. Fam: S-gene family, Cpt: component, Cluster: cluster number according to Fig.4, Bacteria: number of hits from Bacteria, Archaea: number of hits from Archaea. For each S-gene component, the rank in the BLAST search and the taxonomic assignation of the 25 sequences with the best hits to that component were reported (Aci:Acidobacteria, Act:Actinobacteria, Aqu: Aquificae, Arm:Armatimonadetes, Bac:Bacteroidetes, Chl:Chloroflexi, Cre:
Crenarchaeota, Cya:Cyanobacteria, Def:Deferribacteres, Dei:
Deinococcus-Thermus, Eur:Euryarchaeota, Fir:Firmicutes, Fus:Fusobacteria, Gem:
Gemmatimonadetes, Ign:Ignavibacteriae, Nit:Nitrospirae, Pla:Planctomycetes,
Pro:Proteobacteria, Spi:Spirochaetes, Syn:Synergistetes, Ten:Tenericutes, Tha:
Thaumarchaeota, The:Thermotogae, Ver:Verrucomicrobia, roo: Unknown).
Red cells correspond to bacterial phyla while blue cells correspond to archaeal phyla. When only one S-gene component is described, the unrepresented S-gene components from the S-gene family are either
exclusively found in photosynthetic eukaryotes, or have diverged too much to be confidently assigned to a prokaryotic group. (XLSX 1743 kb)
Additional file 13:Figure S10.S-gene family 18,563. A. Component architecture and phylogenetic tree of S-gene family 18,563. Family 18,563 is composed of one component (RNA methyltransferase (MTase)) of ar-chaeal origin according to our BLASTp taxonomic assignment and two domains of eukaryotic origins (for the phylogenetic tree, blue: SAR, red: Archaeplastida, purple: Opisthokonta, cyan: Haptophyta, orange: Amoebozoa, blue-green: Discoba) (13 sequences, 599 sites, model LG + I + G4, 1000 ultrafast bootstraps). B. ML phylogenetic tree of the MTase component (green: Eukarya, blue: Archaea, red: Bacteria, black circle: bootstraps > 80%) (113 sequences, 146 sites, model LG + I + G4, 1000 ultrafast bootstraps). (PNG 2662 kb)
Additional file 14:Figure S11.S-gene family 6384. A. Component architecture and phylogenetic tree of S-gene family 6384. Family 6384 is composed of one component (glutathione S-transferase (GST)) of bacterial origin according to our BLASTp taxonomic assignment and of two domains of eukaryotic origins (for the phylogenetic tree, blue: SAR, red: Archaeplastida, purple: Opisthokonta, orange: Amoebozoa) (27 sequences, 315 sites, model LG + I + G4, 1000 ultrafast bootstraps). B. ML phylogenetic tree of the GST component (green: Eukarya, blue: Archaea, red: Bacteria, black circle: bootstraps > 80%) (127 sequences, 172 sites, model LG + I + G4, 1000 ultrafast bootstraps). (PNG 2925 kb)
Additional file 15:Figure S12.S-gene family 9304. A. Component architecture and phylogenetic tree of S-gene family 9304. Family 9304 is composed of two components (ATP-citrate lyase subunits A and B (ACLA and ACLB)) of prokaryotic origin according to our BLASTp taxonomic assignment (for the phylogenetic tree, blue: SAR, orange: Amoebozoa, purple: Opisthokonta) (15 sequences, 1171 sites, model LG + I + G4, 1000 ultrafast bootstraps). B. Maximum-likelihood
phylogenetic tree of the ACLA component (green: Eukarya, blue: Archaea, red: Bacteria, black circle: bootstraps > 80%) (115 sequences, 364 sites, model LG + I + G4, 1000 ultrafast bootstraps). C. Maximum-likelihood phylogenetic tree of the ACLB component (green: Eukarya, blue: Archaea, red: Bacteria, black circle: bootstraps > 80%) (115 sequences, 485 sites, model LG + I + G4, 1000 ultrafast bootstraps). (PNG 3389 kb)
Additional file 16:Figure S13.χ2test of the distribution of COG
categories. The color code is the same as in Fig.4. Barplots correspond to observed proportions while black lines correspond to expected proportions (ARC-X: clusters 6, 8, 9 and 10; BAC-BAC: clusters 2 and 7, BAC-EUK: cluster 3, PROK-BAC: cluster 5, PROK-PROK: cluster 4, and PROK-EUK: cluster 1 in Fig.4). (PNG 466 kb)
Additional file 17:Figure S14.Functional annotation of the S-genes involved in information storage and processing according to the different clusters in Fig.4(ARC-X: clusters 6, 8, 9, and 10; BAC-BAC: clusters 2 and 7, BAC-EUK: cluster 3, PROK-BAC: cluster 5, PROK-PROK: cluster 4 and PROK-EUK: cluster 1). (PNG 365 kb)
(PROK-PROK), cluster 6 roughly corresponds to 21 S-genes with archaeal and eukaryotic components (ARC-EUK), cluster 7 roughly corresponds to a mix of 11 S-genes with only archaeal components (ARC-ARC) and with archaeal and prokaryotic components (ARC-PROK), and finally cluster 8 roughly corresponds to 7 S-genes with bacterial and archaeal components (ARC-BAC). (PNG 904 kb)
Additional file 19:Figure S16.χ2test of the distribution of COG
categories (conservative taxonomic assignment). The color code is the same as in Additional file15: Figure S12. Barplots correspond to observed proportions while black lines correspond to expected proportions (ARC-X: clusters 6, 7, 8, BAC-BAC: cluster 3, BAC-EUK: cluster 1, PROK-BAC: cluster 2, PROK-PROK: cluster 5 and PROK-EUK: cluster 4 in Additional file15: Figure S12). (PNG 327 kb)
Additional file 20:List of 38 eukaryote genomes and the 382 prokaryotic genomes used in our comparative analysis. (XLSX 277 kb)
Additional file 21:Supporting data for this study, consisting of fasta sequences of S-genes, intron position alignments, components information, and phylogenetic trees. (ZIP 11370 kb)
Funding
EB is funded by the European Research Council (FP7/2007–2013 Grant Agreement #615274). DB is grateful to the Rutgers University School of Environmental and Biological Sciences and members of the Genome Cooperative at SEBS for supporting this research.
Availability of data and materials
Supporting data for this study, consisting of fasta sequences of S-genes, intron position alignments, components information and Phylogenetic trees have been made publically and freely accessible athttp://www.evol-net.fr/ downloads/meheustEtAlSgeneEukaryogenesis.zipand in Additional file21. Computer codes are freely accessible athttps://github.com/raphael-upmc/ network/tree/master/other. Correspondence and requests for materials should be addressed to RM at [email protected].
Authors’contributions
EB, PL, and RM designed the study. RM performed analyses. JSP performed intron characterization. All authors analyzed the data and wrote the paper, and have read and approved the final manuscript.
Competing interests
The authors declare that they have no competing interests.
Publisher’s Note
Springer Nature remains neutral with regard to jurisdictional claims in published maps and institutional affiliations.
Author details 1
Sorbonne Universités, UPMC Univ Paris 06, CNRS, Evolution Paris Seine -Institut de Biologie Paris Seine (EPS - IBPS), 75005 Paris, France.2Department of Biochemistry and Microbiology, Rutgers University, New Brunswick, NJ 08901, USA.3Division of Evolution and Genomic Sciences, School of Biological Sciences, Faculty of Biology, Medicine and Health, The University of Manchester, Manchester Academic Health Science Centre, M13 9PL, Manchester, UK.
Received: 19 September 2017 Accepted: 21 February 2018
References
1. Méheust R, Zelzion E, Bhattacharya D, Lopez P, Bapteste E. Protein networks identify novel symbiogenetic genes resulting from plastid endosymbiosis. Proc Natl Acad Sci U S A. 2016;113:3579–84.https://doi.org/10.1073/pnas.1517551113 2. Kaessmann H. Origins, evolution, and phenotypic impact of new genes.
Genome Res. 2010;20:1313–26.https://doi.org/10.1101/gr.101386.109 3. Makarova KS, Wolf YI, Mekhedov SL, Mirkin BG, Koonin EV. Ancestral
paralogs and pseudoparalogs and their role in the emergence of the eukaryotic cell. Nucleic Acids Res. 2005;33:4626–38.
https://doi.org/10.1093/nar/gki775
4. McLysaght A, Guerzoni D. New genes from non-coding sequence: the role of de novo protein-coding genes in eukaryotic evolutionary innovation. Philos Trans R Soc Lond B Biol Sci. 2015;370:20140332.https://doi.org/10. 1098/rstb.2014.0332
5. Kawai H, Kanegae T, Christensen S, Kiyosue T, Sato Y, Imaizumi T, et al. Responses of ferns to red light are mediated by an unconventional photoreceptor. Nature. 2003;421:287–90.https://doi.org/10.1038/ nature01310
6. Karnkowska A, Vacek V, Zubáčová Z, Treitli SC, Petrželková R, Eme L, et al. A eukaryote without a mitochondrial organelle. Curr Biol. 2016;26(10):1274–84. https://doi.org/10.1016/j.cub.2016.03.053
7. Szathmáry E. Toward major evolutionary transitions theory 2.0. Proc Natl Acad Sci U S A. 2015;112(33):10104–11.https://doi.org/10.1073/pnas.1421398112 8. Szathmáry E, Smith JM. The major evolutionary transitions. Nature. 1995;374:
227–32.https://doi.org/10.1038/374227a0
9. Spang A, Saw JH, Jørgensen SL, Zaremba-Niedzwiedzka K, Martijn J, Lind AE, et al. Complex archaea that bridge the gap between prokaryotes and eukaryotes. Nature. 2015;521:173–9.https://doi.org/10.1038/nature14447 10. Zaremba-Niedzwiedzka K, Caceres EF, Saw JH, Bäckström D, Juzokaite L,
Vancaester E, et al. Asgard archaea illuminate the origin of eukaryotic cellular complexity. Nature. 2017;541:353–8.https://doi.org/10.1038/nature21031 11. McInerney JO, O’Connell MJ, Pisani D. The hybrid nature of the Eukaryota
and a consilient view of life on Earth. Nat Rev Microbiol. 2014;12:449–55. https://doi.org/10.1038/nrmicro3271
12. Lane N, Martin W. The energetics of genome complexity. Nature. 2010;467: 929–34.https://doi.org/10.1038/nature09486
13. Williams TA, Foster PG, Cox CJ, Embley TM. An archaeal origin of eukaryotes supports only two primary domains of life. Nature. 2013;504:231–6. https://doi.org/10.1038/nature12779
14. O’Malley MA. The first eukaryote cell: an unfinished history of contestation. Stud Hist Philos Biol Biomed Sci. 2010;41:212–24.https://doi.org/10.1016/j. shpsc.2010.07.010
15. Timmis JN, Ayliffe MA, Huang CY, Martin W. Endosymbiotic gene transfer: organelle genomes forge eukaryotic chromosomes. Nat Rev Genet. 2004;5: 123–35.https://doi.org/10.1038/nrg1271
16. O’Malley MA. Endosymbiosis and its implications for evolutionary theory. Proc Natl Acad Sci U S A. 2015;112(33):10270–7.https://doi.org/10.1073/ pnas.1421389112
17. Archibald JM. Endosymbiosis and eukaryotic cell evolution. Curr Biol. 2015; 25:R911–21.https://doi.org/10.1016/j.cub.2015.07.055
18. Pittis AA, Gabaldón T. Late acquisition of mitochondria by a host with chimaeric prokaryotic ancestry. Nature. 2016;531:101–4.https://doi.org/10. 1038/nature16941
19. Rivera MC, Jain R, Moore JE, Lake JA. Genomic evidence for two functionally distinct gene classes. Proc Natl Acad Sci U S A. 1998;95:6239–44.
20. Esser C, Ahmadinejad N, Wiegand C, Rotte C, Sebastiani F, Gelius-Dietrich G, et al. A genome phylogeny for mitochondria among alpha-proteobacteria and a predominantly eubacterial ancestry of yeast nuclear genes. Mol Biol Evol. 2004;21:1643–60.https://doi.org/10.1093/molbev/msh160
21. Cotton JA, McInerney JO. Eukaryotic genes of archaebacterial origin are more important than the more numerous eubacterial genes, irrespective of function. Proc Natl Acad Sci U S A. 2010;107:17252–5.https://doi.org/10. 1073/pnas.1000265107
22. Koonin EV, Yutin N. The dispersed archaeal eukaryome and the complex archaeal ancestor of eukaryotes. Cold Spring Harb Perspect Biol. 2014;6: a016188.https://doi.org/10.1101/cshperspect.a016188
23. Koonin EV. Origin of eukaryotes from within archaea, archaeal eukaryome and bursts of gene gain: eukaryogenesis just made easier? Philos Trans R Soc Lond B Biol Sci. 2015;370(1678):20140333.https://doi.org/10.1098/rstb. 2014.0333
24. McInerney J, Pisani D, O’Connell MJ. The ring of life hypothesis for eukaryote origins is supported by multiple kinds of data. Philos Trans R Soc Lond B Biol Sci. 2015;370:20140323.https://doi.org/10.1098/rstb.2014.0323 25. Koumandou VL, Wickstead B, Ginger ML, van der Giezen M, Dacks JB, Field
MC, et al. Molecular paleontology and complexity in the last eukaryotic common ancestor. Crit Rev Biochem Mol Biol. 2013;48(4):373–96. 26. Mast FD, Barlow LD, Rachubinski RA, Dacks JB. Evolutionary mechanisms for
establishing eukaryotic cellular complexity. Trends Cell Biol. 2014;24:435–42. 27. Gabaldón T, Pittis AA. Origin and evolution of metabolic sub-cellular
![Fig. 1 Putative phylogeny of eukaryotes, based on Derelle et al. [82], that shows the distribution of 573 S-gene families](https://thumb-us.123doks.com/thumbv2/123dok_us/8906807.1834511/3.595.57.539.425.694/putative-phylogeny-eukaryotes-based-derelle-shows-distribution-families.webp)