University of New Orleans University of New Orleans
ScholarWorks@UNO
ScholarWorks@UNO
University of New Orleans Theses and
Dissertations Dissertations and Theses
Spring 5-17-2013
Automated Timeline Anomaly Detection
Automated Timeline Anomaly Detection
Joshua M. Barone
University of New Orleans, [email protected]
Follow this and additional works at: https://scholarworks.uno.edu/td
Part of the Other Computer Sciences Commons
Recommended Citation Recommended Citation
Barone, Joshua M., "Automated Timeline Anomaly Detection" (2013). University of New Orleans Theses and Dissertations. 1609.
https://scholarworks.uno.edu/td/1609
This Thesis is protected by copyright and/or related rights. It has been brought to you by ScholarWorks@UNO with permission from the rights-holder(s). You are free to use this Thesis in any way that is permitted by the copyright and related rights legislation that applies to your use. For other uses you need to obtain permission from the rights-holder(s) directly, unless additional rights are indicated by a Creative Commons license in the record and/or on the work itself.
Automated Timeline Anomaly Detection
A Thesis
Submitted to the Graduate Faculty of the University of New Orleans
in partial fulfillment of the requirements for the degree of
Master of Science in
Computer Science Information Assurance
by
Joshua Barone
B.S. University of New Orleans, 2004
Table of Contents
List of Figures ... iv
Abstract ... v
1.1 Background ...1
1.2 Motivation ...3
1.3 Objective ...5
2.1 The Sleuth Kit ...5
2.2 Event Log Formats ...6
2.2.1 Windows NT Event Log Format ...6
2.2.2 Windows Vista Event Log Format ... 13
2.2.3 Unix Log Format ... 19
3 Detecting Anomalies ... 20
4 TADpole ... 23
4.1 Discovery Phase ... 24
4.2 Parsing Phase ... 26
4.3 Detection Phase ... 27
4.4 Pairing Phase ... 29
4.5 Correlation Phase ... 31
4.6 Reporting Phase ... 33
5 Testing ... 35
5.1 Windows XP Professional - Roll Forward Test ... 38
5.2 Windows XP Professional - Roll Backward Test ... 40
5.3 Windows Vista Business - Roll Forward Test ... 41
5.5 Windows 7 Enterprise - Roll Forward Test ... 46
5.6 Windows 7 Enterprise - Roll Backward Test ... 48
5.7 M57-Patents Scenario ... 49
6 Conclusion ... 50
7 Future Work ... 51
8 References ... 52
9 Appendices ... 53
9.1 Appendix A: Windows XP Professional - Roll Forward Test ... 53
9.2 Appendix B: Windows XP Professional - Roll Backward Test ... 54
9.3 Appendix C: Windows Vista Business - Roll Forward Test ... 55
9.4 Appendix D: Windows Vista Business - Roll Backward Test ... 57
9.5 Appendix E: Windows 7 Enterprise - Roll Forward Test ... 58
9.6 Appendix F: Windows 7 Enterprise - Roll Backward Test ... 60
9.7 Appendix G: M57-Patent Scenario ... 60
List of Figures
Figure 1 Event log record header ...6
Figure 2 Windows NT Event Log Cursor Format ...8
Figure 3 Windows NT Event Log Record Format ... 10
Figure 4 Windows Vista Event Log Header Format ... 13
Figure 5 Windows Vista Log File Chunk Header Format ... 16
Abstract
Digital forensics is the practice of trained investigators gathering and analyzing evidence from digital devices such as computers and smart phones. On these digital devices, it is possible to change the time on the device for a purpose other than what is intended. Currently there are no documented techniques to determine when this occurs. This research seeks to prove out a technique for determining when the time has been changed on forensic disk image by analyzing the log files found on the image. Out of this research a tool is created to perform this analysis in automated fashion. This tool is TADpole, a command line program that analyzes the log files on a disk image and determines if a timeline anomaly has occurred.
1.1 Background
Our society has steadily become more technological and with this continuous
introduction of technology, there is more opportunity for people to do nefarious things.
This includes introduction of malware (viruses, trojan horses, etc...), identity theft,
financial fraud, and more. Not only is there more opportunity for this type of crime, but
the tools and tactics used are becoming more sophisticated. Tactics include better ways
of hiding traces of the crime, better methods of encrypting data to prevent others from
accessing incriminating data, using steganography to hide communications within
innocuous transmissions, and others.
Digital forensics is the science of locating, collecting, preserving, and analyzing
evidence from digital devices for use in exposing improper or illegal use of the digital
devices. Devices include such items as computers, laptops, net-books, tablet
computers, smartphones, smart appliances, video game consoles, and anything that
electronically stores data or connects to the Internet. The digital media used by these
devices to store data may be DVDs, CDs, flash memory, USB thumb drives, external
hard drives, and others. Digital forensics is essentially a collection of practices and
methodologies that layout how an investigator gathers digital evidence and analyzes it.
The modern forensics investigator has great responsibilities. If they are negligent
in their handling of evidence, it is possible their actions will result in unjustified
conviction of someone who is innocent or exoneration of someone who is guilty. An
investigator must therefore be careful to reduce these risks as much as possible by
ensuring the integrity of the evidence being examined as well as ensuring that the
There are usually four stages to digital forensics investigation:
● Gathering of evidence - This is the stage in which all digital media that were
seized are replicated. This is done by making a forensic copy. Traditionally this is
an exact copy of the data, as well as a cryptographic hash that fingerprints the
data to prove that it wasn’t altered.
● Analysis of evidence - In this stage, all evidence that was gathered is processed
and analyzed to determine what information is of forensic value. In this stage, the
evidence is correlated to present a more complete picture of what was done. This
involves various practices and procedures, like creating a timeline based on
events in log files and timestamps on and in files on the system, also decrypting
data on the system. This also includes recovering all files and data that were
deleted, data in swap partitions, and hibernation storage files. There exist many
tools (both commercial and open software), for performing these tasks within this
step.
● Evaluation of evidence - In this stage, all evidence and analysis is put together to
determine what was done on the system, as well as how it was done, and by
whom. This is done by corroborating events with multiple pieces of evidence, if
available. This stage is more of a practice of intuition on the part of the
investigator, as the investigator’s experience and training leads them in the
understanding of the evidence and what it means. The investigator uses the
evidence to draw conclusions about what was done and how it was done. These
patterns that are documented by other investigators and patterns that have been
experienced and documented by the investigator in the past.
● Presentation of evidence - In this stage, all information and evidence gathered is
made into a format that others are capable of understanding. This includes
reports explaining what steps were taken to collect evidence, the evidence
collected, and conclusions drawn from the evidence.
1.2 Motivation
During the course of an investigation, it is usually very helpful to create a timeline
of events that occurred on a target system. Timelines are often created from log files
that are found on a system, and timestamp (MAC times) on files. MAC timestamps
refers to the three timestamps that associated with a file. These timestamps are the
time the file was last modified, last accessed (read), and the time the file was created.
Creating these timelines is a well explored and studied practice. There are several tools
that exist to aid in the creation of a timeline, including tools like log2time or GrokEvt.
● log2timeline1 - This tool is a framework for automatic creation of a super timeline.
The main purpose is to provide a single tool to parse various log files and
artifacts found on suspect systems (and supporting systems, such as network
equipment) and produce a timeline that can be analysed by forensic
investigators/analysts.
● GrokEvt2 - This tool is a collection of Python scripts designed for reading
Windows NT style event logs. This include the event logs found on Windows NT,
These tools organize the events in log files in order to present a cohesive
timeline of events. These tools are lacking though. There are assumptions made by
these tools, when creating the timeline, that discount anomalies in the timeline. The
focus of my research is on detecting anomalies in the timeline. These anomalies are
possibly indicative of manipulation of the clock on a system. There could be several
reasons for changing the clock on a system. Some of these reasons are benign;
however, not all reasons are. These benign reasons could include things like:
● Testing code during development, to make sure it works as expected during
certain periods of time.
● Changing time to accommodate for daylight savings time.
● Adjusting the clock to accommodate for clock skew.
More nefarious reasons could be:
● Temporarily changing the time, so that is appears that work was done in the past
or future.
● Changing the clock backward in time to fool a piece of software with a trial
license.
● Temporarily changing the time, so that any events logged appear in the past or
future.
There is currently no automated way to detect these anomalies in a timeline. If an
investigator wished to find evidence of these anomalies, it would have to be done
manually, combing through multiple log files, which are very lengthy, and in the case of
need to be correlated among the multiple logs to help prove their validity. This is a very
daunting and tedious task, and one that should ideally be automated.
1.3 Objective
This research attempts to autonomously detect and report timeline anomalies.
Our solution will also include an implementation in the form of an application that will be
able to detect timeline anomalies within a disk image. This application is a proof of
concept and will be limited to working on Windows based operating systems. There are
a few reasons for this decision. The first is that the Windows operating system is the
most pervasive. Another reason is that Windows event log files all share a consistent
format. The application will make use of The Sleuth Kit, in order to work with files within
a disk image. With some adjustments, other operating systems could be supported.
Support for other operating systems is the focus of future work.
2.1 The Sleuth Kit
The Sleuth Kit is a programming library and a collection of tools that allow an
investigator to inspect volume and file system information for a variety of filesystem
types. The library provides access to the functionality of The Sleuth Kit, allowing it to be
included as part of larger software applications. The Sleuth Kit has a built in
understanding of many different filesystem types. It is particularly adept at working with
the popular file systems found on Windows, Linux, Unix, and Mac OS X. Because the
Sleuth Kit is an open source tool, there also exists community provided extensions and
treat a forensic disk image as if it were a physical hard drive. This allows the
investigator to locate and read files within the image, also low lev
metadata, et cetera.
2.2 Event Log Formats
2.2.1 Windows NT Event Log Format
The Windows NT event log format is the format that is used in Windows NT and
Windows XP. This log format is a binary and proprietary file format, which i
well documented. Since Windows uses filename extensions to denote file types, these
files all have the evt filename extension. The basic structures in this log file are records.
There are 3 types of records (Header, Cursor, and Log). The first r
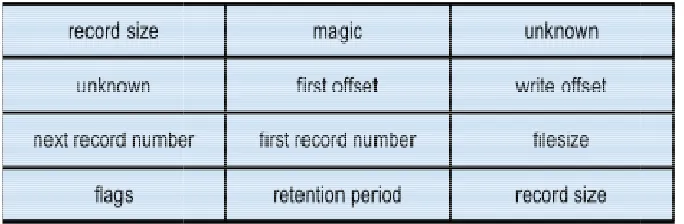
header, which instructs how to read the log file. The header is the first 48 bytes at the
beginning of the file. The header is described as follows:
Figure 1 Event log record header
Each block is described as follows:
● record size - This 32 bit block denotes the size of this record in bytes, which in
this case is a header and has a fixed size of 48 bytes. This block is repeated at
the end of the header as well.
treat a forensic disk image as if it were a physical hard drive. This allows the
investigator to locate and read files within the image, also low level, sector
2.2.1 Windows NT Event Log Format3
The Windows NT event log format is the format that is used in Windows NT and
Windows XP. This log format is a binary and proprietary file format, which i
indows uses filename extensions to denote file types, these
files all have the evt filename extension. The basic structures in this log file are records.
There are 3 types of records (Header, Cursor, and Log). The first record of the file is the
header, which instructs how to read the log file. The header is the first 48 bytes at the
beginning of the file. The header is described as follows:
Figure 1 Event log record header
Each block is described as follows:
This 32 bit block denotes the size of this record in bytes, which in
this case is a header and has a fixed size of 48 bytes. This block is repeated at
the end of the header as well.
treat a forensic disk image as if it were a physical hard drive. This allows the
el, sector-based I/O,
The Windows NT event log format is the format that is used in Windows NT and
Windows XP. This log format is a binary and proprietary file format, which is not very
indows uses filename extensions to denote file types, these
files all have the evt filename extension. The basic structures in this log file are records.
ecord of the file is the
header, which instructs how to read the log file. The header is the first 48 bytes at the
This 32 bit block denotes the size of this record in bytes, which in
● magic - This is a predetermined 4 bytes (32 bits) that can be used to validate that
this is a Windows NT event log header. The 4 bytes are “LfLe”.
● unknown - There are two 32 bit blocks whose purpose is undocumented. The
value of these blocks is always 1. Possibly this is specifying the version of the log
format.
● first offset - This 32 bit block is the offset into the file where the first log record
can be found.
● write offset - This 32 bit block is the offset into the file where the next log record
would be written to.
● next record number - This is the next event record id number to use.
● first record number - This is the event record id number of the first record in this
log.
● filesize - The size of this log file in bytes.
● flags - This 32 bit block contains bit flags.
○ 0x01 (Dirty) - This flag is set when the log is first written to. If the log entry
is added without incident this flag is unset, meaning the header data is all
valid.
○ 0x02 (Wrapped) - This flag denotes a wrapped log, meaning the newest
log entry is at a lower offset than older entries.
○ 0x04 (Log Full) - This flag is set if the log can not be written to because
there isn’t enough free space in the file and the file could not grow any
configured and retention does not allow
record.
○ 0x08 (Primary)
-backup log file.
● retention period - This 32 bit block contains the retention period (in seconds)
used for this log file.
Once the header is read and parsed,
cursor. The cursor is described in Figure 2.
Figure 2 Windows NT Event Log Cursor Format
The blocks of the cursor are described as follows:
● record length - This 32 bit block denotes the size of this record
this case is a cursor and
the end of the header as well.
● magic number - This is a predetermined 16 bytes (128 bits) that can be used to
validate that this is a Windows NT event log
“\x11\x11\x11\x11\x22\
● first offset - This 32 bit block is the offset into the file where the first log record
can be found.
● write offset - This 32 bit block is the offset into the file
would be written to.
● next record number - This is the next event record id number to use.
configured and retention does not allow overwriting the oldest event
- This flag is set in an active log file denoting that it is not a
This 32 bit block contains the retention period (in seconds)
Once the header is read and parsed, the next step in the process is to read in the
cursor. The cursor is described in Figure 2.
Figure 2 Windows NT Event Log Cursor Format
of the cursor are described as follows:
This 32 bit block denotes the size of this record in bytes, which in
this case is a cursor and has a fixed size of 40 bytes. This block is repeated at
the end of the header as well.
This is a predetermined 16 bytes (128 bits) that can be used to
validate that this is a Windows NT event log cursor. The 16 bytes are
\x22\x22\x22\x33\x33\x33\x33\x44\x44\x44\x44”
This 32 bit block is the offset into the file where the first log record
This 32 bit block is the offset into the file where the next log record
This is the next event record id number to use.
est event
This flag is set in an active log file denoting that it is not a
This 32 bit block contains the retention period (in seconds)
the next step in the process is to read in the
in bytes, which in
s a fixed size of 40 bytes. This block is repeated at
This is a predetermined 16 bytes (128 bits) that can be used to
cursor. The 16 bytes are
x44”.
This 32 bit block is the offset into the file where the first log record
where the next log record
● first record number - This is the event record id number of the first record in this
log.
The cursor record should be found at the offset specified in the write offset field
in the header. If, however, the cursor is not found at that offset, which can happen if the
cursor has been moved but the machine was shut down before the header was
updated, it must be found by doing a manual search. This can be done by reading 128
bit sequences, starting from the end of the file and working back toward the beginning,
and comparing them to the cursor’s magic number. The match denotes that the cursor
has been found. The cursor can be used to read in the log records within the file. This
can be done by reading log records starting at the first offset, denoted by either the
header or the cursor, and reading the calculated number of records. The number of
records is calculated as the next record number minus the first record number. Each log
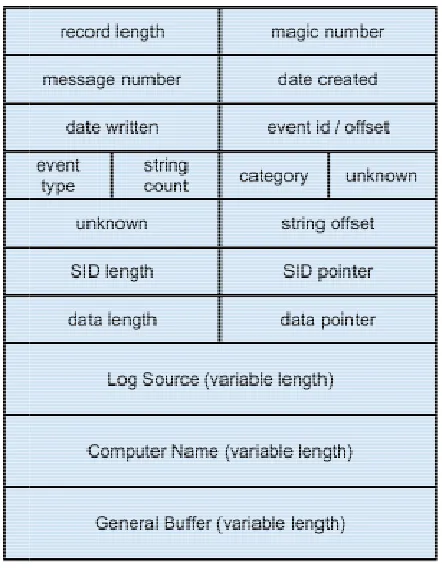
Figure 3 Windows NT Event Log Record Format
Each block is described as follows:
● record length - This 32 bit block denotes the size of this record in bytes, which in
this case is a log record and is variable in size.
● magic number - This is a predetermined 4 bytes (32 bits) that can be used to
validate that this is a Windows NT event log header. The 4 bytes are
● message number - This 32 bit block contains the message number.
● date created - 32 bit block containing the date the record event was created. This
time is denoted as seconds since epoch, and in UTC/GMT format.
● date written - 32 bit block containing the date the record event was written. This
time is denoted as seconds since epoch, and in UTC/GMT format.
● event id / offset - This is a 32 bit block containing the Event ID and the offset into
the system DLL that contain
Figure 3 Windows NT Event Log Record Format
Each block is described as follows:
This 32 bit block denotes the size of this record in bytes, which in
is a log record and is variable in size.
This is a predetermined 4 bytes (32 bits) that can be used to
validate that this is a Windows NT event log header. The 4 bytes are
This 32 bit block contains the message number.
32 bit block containing the date the record event was created. This
time is denoted as seconds since epoch, and in UTC/GMT format.
32 bit block containing the date the record event was written. This
time is denoted as seconds since epoch, and in UTC/GMT format.
This is a 32 bit block containing the Event ID and the offset into
DLL that contains the message template corresponding to the event. This 32 bit block denotes the size of this record in bytes, which in
This is a predetermined 4 bytes (32 bits) that can be used to
validate that this is a Windows NT event log header. The 4 bytes are “LfLe”.
This 32 bit block contains the message number.
32 bit block containing the date the record event was created. This
time is denoted as seconds since epoch, and in UTC/GMT format.
32 bit block containing the date the record event was written. This
time is denoted as seconds since epoch, and in UTC/GMT format.
This is a 32 bit block containing the Event ID and the offset into
The high order two bytes are the offset into the system DLL. The low order two
bytes are the Event ID. Together, as the single 32 bit block, they are used as a
parameter to FormatMessage() in a Windows system to get the message from
the corresponding DLL.
● event type - This is a 16 bit block containing the event type. This has one of 5
values.
○ Error - This event type indicates a significant problem occurred, such as
loss of data or functionality.
○ Warning - An event of this type is not indicative of an immediate problem,
but may be reporting the potential for a problem.
○ Information - This event type contains information regarding the
successful operation of an application.
○ Success Audit - This event type is indicative of the successful attempt of
security access, such as user login or privilege escalation for installing
software.
○ Failure Audit - This event type is indicative of the failed attempt of security
access.
● string count - This is a 16 bit block containing the number of strings in the event.
This refers to the number of strings in the variable section.
● category - This 16 bit block denotes the event category.
● unknown - This is a 48 bit block, whose purpose is unknown, contents vary.
● string offset - This is the offset, from the beginning of the record, of a sequence
● SID length - This is a 32 bit block containing the length of the SID section. This is
set to 0 if the section isn’t included.
● SID offset - This 32 bit block contains the offset, from the beginning of the record,
to the beginning of the SID section.
● data length - This 32 bit block contains the length of the supplementary data
section. This is set to 0 if the section isn’t included.
● date offset - This 32 bit block contains the offset, from the beginning of the
record, to the beginning of the supplementary data section.
● variable length sections
○ log source - This section is the collection of strings used when looking up
which DLLs to use for retrieving the message string based on Event ID.
○ computer name - This section is a UTF-16 string, that is NULL terminated
(‘\x00\x00’), containing the computer name that generated the log entry.
○ general buffer - This section contains the SID section as well as
supplementary data section.
In some instances, the log record is wrapped. In this case the record begins as
the last record in the file, but its contents is too long. When this happens, the contents
are continued at the beginning of the file, behind the header. To read this kind of record,
first the end of the file needs to be read and then the remaining data needs to be read
from the beginning of the file.
Utilizing the header and the information contained within it, the various record
and when it occurred. And they combine to present a picture of the events occurring on
a computer system.
2.2.2 Windows Vista Event Log Format
The Windows Vista event log format is the format that is used in Windows Vista
and Windows 7. This log format is a binary and proprietary file format, which is not very
well documented. Since Windows uses filename extensions to denote file types, these
files all have the evtx filename extension. The log file starts with a header. The header
is the first 4096 bytes of the file. Only the first 128 bytes (1024 bits) of the header are
actually used right now. The thinking behind this is that the header is loade
memory in order to expidite access. Since memory is allocated in pages, with 4096
bytes being the physical page size, it makes sense for the header to be this long. Figure
4 describes the layout of the header.
Figure 4 Windows Vista Event Log Head
Each block of the header is described as follows:
and when it occurred. And they combine to present a picture of the events occurring on
2.2.2 Windows Vista Event Log Format4
The Windows Vista event log format is the format that is used in Windows Vista
and Windows 7. This log format is a binary and proprietary file format, which is not very
indows uses filename extensions to denote file types, these
es all have the evtx filename extension. The log file starts with a header. The header
is the first 4096 bytes of the file. Only the first 128 bytes (1024 bits) of the header are
actually used right now. The thinking behind this is that the header is loade
memory in order to expidite access. Since memory is allocated in pages, with 4096
bytes being the physical page size, it makes sense for the header to be this long. Figure
4 describes the layout of the header.
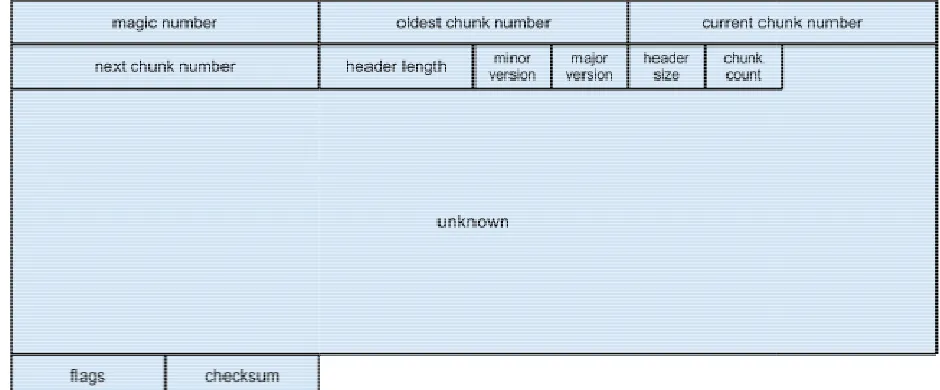
Figure 4 Windows Vista Event Log Header Format
Each block of the header is described as follows:
and when it occurred. And they combine to present a picture of the events occurring on
The Windows Vista event log format is the format that is used in Windows Vista
and Windows 7. This log format is a binary and proprietary file format, which is not very
indows uses filename extensions to denote file types, these
es all have the evtx filename extension. The log file starts with a header. The header
is the first 4096 bytes of the file. Only the first 128 bytes (1024 bits) of the header are
actually used right now. The thinking behind this is that the header is loaded into
memory in order to expidite access. Since memory is allocated in pages, with 4096
● magic number - This is a constant 64 bit block that helps to identify this file as a
Windows Vista event log file. The constant value is “ElfFile\x00”.
● oldest chunk number - This 64 bit number is the index of the oldest chunk in the
log file.
● current chunk number - This is the 64 bit number of the current chunk in the log
file.
● next chunk number - This is the 64 bit number of the next chunk to be created in
the log file.
● header length - This unsigned 32 bit number is the length of the first part of the
header in bytes. This is a constant number, 128 bytes (0x80).
● minor version - This unsigned 16 bit number is the minor version of the format of
the log file.
● major version - This unsigned 16 bit number is the major version of the format of
the log file. This will be 2. Version 1 was the Windows NT Event Log file format.
● header size - This is an unsigned 16 bit number indicating the size of the entire
header in bytes. This is a constant value of 4096 bytes (0x1000).
● chunk count - This is an unsigned 16 bit number expressing the number of
chunks contained in the log file.
● unknown - This is a 76 byte section whose purpose is unknown. This section has
a constant value of all 0s.
● checksum - This unsigned 32 bit block contains a CRC-32 checksum which is
calculated over the first 120 bytes (0x78) of the header. This includes everything
up to the flags.
Each log file is divided into one or more “chunks.” These chunks hold the
recorded events. Each chunk is 64 kilobytes in length. During the system’s operation,
the current chunk is loaded in memory in order to provide faster access. The first 512
bytes (0x200) of each chunk is the header, which describes the layout of the data in the
Figure 5 Windows Vista Log File Chunk Header Format
Each block of the chunk header is described as follows:
● magic number - This is a consta
within the log file. The constant value is “ElfChnk
● first log record number
Figure 5 Windows Vista Log File Chunk Header Format
Each block of the chunk header is described as follows:
This is a constant 64 bit block that helps to identify the chunk
within the log file. The constant value is “ElfChnk\x00”.
first log record number - This is the 64 bit number of the first chunk in the log. nt 64 bit block that helps to identify the chunk
● last log record number - This is the 64 bit number of the last chunk in the log.
● first file record number - This is the 64 bit number of the first chunk in this log file.
● last file record number - This is the 64 bit number of the last chunk in this log file.
● table offset - This unsigned 32 bit number is the offset within the chunk to the
beginning of the tables.
● last offset - This unsigned 32 bit number is the offset within the chunk to the last
record.
● next offset - This unsigned 32 bit number is the offset within the chunk to the next
record location to be written.
● data checksum - This unsigned 32 bit block contains a CRC-32 checksum which
is calculated over the contents of the chunk, excluding the header.
● unknown - This is a 68 byte block whose purpose is unknown.
● header checksum - This unsigned 32 bit block contains a CRC-32 checksum
which is calculated over the contents of the chunk header. The checksum
calculation excludes 8 bytes of the header starting at the offset 120 (0x78). This
is the last 4 bytes of the unknown block and the header checksum field.
● string table - This is a 2048 bit block that is a collection of strings that would
otherwise be duplicated within the chunk.
● template table - This is a 1024 bit block this is a collection of template strings that
would otherwise be duplicated within the chunk. A template string is an
incomplete string, meaning the string is missing information that will be included
before being displayed. For an example, this could be a string that is duplicated
If the log file is empty, there will be a chunk in the file, but each of the chunk
number fields will have a value of
would be set to 1. The data section of each chunk is f
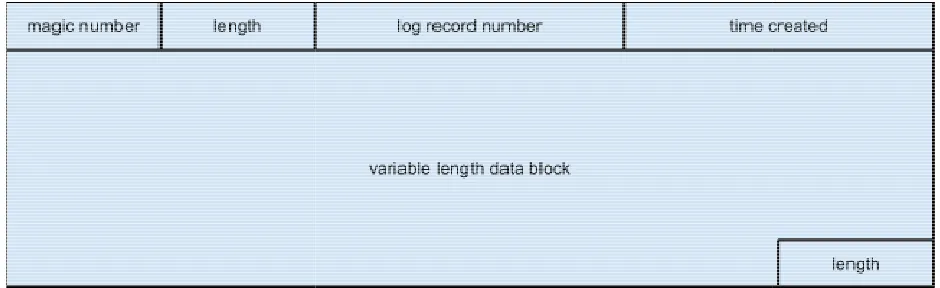
The structure of these event records is described in F
Figure 6 Windows Vista Event Log Record Format
Each block of the event record is described as follows:
● magic number - This is a constant 32 bit block that h
record within the chunk. The constant value is “**
● length - This is the unsigned 32 bit number denoting the entire length of the event
record. This length field is repeated at the end of the event record.
● log record number - This is a 64 bit number representing the identifying number
of the event record. This number is relative to the event records within the same
log channel.
● time created - This is a 64 bit block that contains the time the event record was
created. This field is in Windows Vista FILETIME format, which is units of 100
nanoseconds since 1601
● variable length data block
this event record. The data is actually a proprietary binary encoding
If the log file is empty, there will be a chunk in the file, but each of the chunk
number fields will have a value of -1, except for the first log record number field which
would be set to 1. The data section of each chunk is further divided into event records.
event records is described in Figure 6.
Figure 6 Windows Vista Event Log Record Format
Each block of the event record is described as follows:
This is a constant 32 bit block that helps to identify the event
record within the chunk. The constant value is “**\x00\x00”.
This is the unsigned 32 bit number denoting the entire length of the event
record. This length field is repeated at the end of the event record.
This is a 64 bit number representing the identifying number
of the event record. This number is relative to the event records within the same
This is a 64 bit block that contains the time the event record was
field is in Windows Vista FILETIME format, which is units of 100
nanoseconds since 1601-01-01T00:00:00.
variable length data block - This block contains the information being logged in
this event record. The data is actually a proprietary binary encoding
If the log file is empty, there will be a chunk in the file, but each of the chunk
1, except for the first log record number field which
urther divided into event records.
elps to identify the event
This is the unsigned 32 bit number denoting the entire length of the event
record. This length field is repeated at the end of the event record.
This is a 64 bit number representing the identifying number
of the event record. This number is relative to the event records within the same
This is a 64 bit block that contains the time the event record was
field is in Windows Vista FILETIME format, which is units of 100
This block contains the information being logged in
2.2.3 Unix Log Format
There are many different log files on Unix and Linux systems. These file includes
several system logs as well as others such as apache logs on web servers and others.
Most logs on these systems can be found in the /var/log directory. There are five
primary log files to be considered on a unix system.
● /var/log/btmp - contains the failed login histroy.
● /var/log/messages - contains messages from the syslog facility. This file might
instead be called /var/log/syslog on some systems.
● /var/log/secure - contains the logged information for access and authentication.
● /var/run/utmp - contains the summary of currently logged on users.
● /var/log/wtmp - contains the history of logins and logouts on the system.
Most log files on Unix systems are simple text files. These text files separate
each logged event with a new line. The format of these logged events, however, is
different and unique to each log file. There isn’t a defined pattern for the log files such
as there are on Windows systems. A big difference though between log files on unix
and windows is documentation. Even though the log files each have a different format,
they are easy to read and are usually well documented as to what each field is and it’s
purpose. Because of the multiple formats that these log files use, they are being
excluded from the tool being implemented by this research, but it is worth noting that
3 Detecting Anomalies
At the heart of the solution for autonomously detecting anomalies in the timeline
is the understanding of how log files are created. When applications and operating
systems are logging events, log entries are added to the log in the order that they are
received. This is the key to the solution. Current timelining solutions assume that entries
with timestamps that are out of order, e.g., an entry is followed by an entry whose
timestamp precedes it, are the result of delays in the I/O or threading issues. While this
is sometimes the case, when someone is purposefully manipulating the time on a
computer system, these out of order entry sequences will always be present in an
unaltered log file. Of course, the presence of these entry sequences is not enough to
verify that a timeline anomaly is present. There must be more evidence to corroborate
the existence of the anomaly.
This evidence is found in the form of timeline gaps. A gap in the timeline is simply
two log entries where the delta in the timestamps for those entries is of a significantly
long time. Again, a gap in the timeline is not in and of itself evidence of a timeline
anomaly. Gaps in the timeline occur for many innocuous reasons, such as a machine
that was put to sleep or powered off, applications and operating systems left in an idle
state, and any other reason where the system is not generating log events for a period
of time. The gap in the timeline is only significant when that gap is paired with entries
whose timestamps are out of sequence.
There are 2 cases that need to be considered. The first case is when the clock
was set back in time. This means that the person purposefully sets the clock back in
this occurs the log file will first have entries with out of sequence timestamps, several
more log entries, and eventually entries denoting a gap in the timeline. This will be
defined as a roll back, since the clock was temporarily rolled back in time. The second
case to consider is when the clock was set forward in time. This is when a person sets
the clock forward in time, does some work, then sets the time back to the current time
(real time). In this case the log file will first have entries that denote a gap in the
timeline, followed by more log file entries, and eventually entries with out of sequence
timestamps. This case will be defined as a roll forward, since the clock is temporarily
rolled into the future. In both of these cases the log entries that occur between the 2
anomaly markers are going to have timestamps that are within the anomalous timeline.
That is timestamps in the anomalous timeline would be past timestamps in the case of a
roll back, or future timestamps in the case of a roll forward. The collection of log events
is what make up an anomaly pair. An anomaly pair contains 4 events. The first 2 events
are the pair that make up the original roll forward or roll back. The second 2 events are
the pair events that make the reset of the time to the current time. An anomaly pair is
also indicative of two separate timelines. The first timeline considered is the anomalous
timeline. This timeline is represented by the timestamps of the second event in the first
pair and the first event in the second pair, this would be events 2 and 3 respectively
within the anomaly pair collection. The second timeline is the real time timeline,
meaning it represents the timeline that existed before the clock was changed. This
timeline is represented by the timestamps of the first event of the first pair and the
second event of the second pair, this would be event 1 and 4 respectively within the
Finding evidence of either a roll forward or a roll back in a log file is not sufficient
evidence to determine a timeline anomaly has occurred. To truly determin
anomaly has occurred, it is necessary to correlate the anomaly with anomalies found in
other log files on the system. Doing this correlation is not a simple task. Individual log
channels log events in varying frequencies. For this reason, anomali
exactly across log files. There are actually 4 cases which need to be considered for
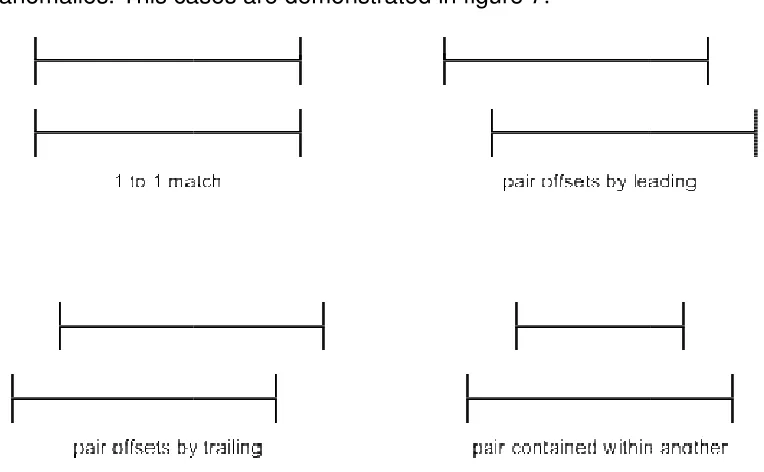
correlating anomalies. This cases are demonstrated in figure 7.
Figure 7 Correlation Categories for Anomalies
The correlation patterns are further d
● 1 to 1 match - This is the best case scenario for event correlation. This would be
the pattern found if the two anomaly pairs contains the exact timestamps. This is
the least likely pattern to be found, due to different logs recording diffe
of events. Each event type is most probably not occurring at the exact time on a
system.
Finding evidence of either a roll forward or a roll back in a log file is not sufficient
evidence to determine a timeline anomaly has occurred. To truly determin
anomaly has occurred, it is necessary to correlate the anomaly with anomalies found in
other log files on the system. Doing this correlation is not a simple task. Individual log
channels log events in varying frequencies. For this reason, anomalies will not match up
exactly across log files. There are actually 4 cases which need to be considered for
correlating anomalies. This cases are demonstrated in figure 7.
Figure 7 Correlation Categories for Anomalies
The correlation patterns are further described below:
This is the best case scenario for event correlation. This would be
the pattern found if the two anomaly pairs contains the exact timestamps. This is
the least likely pattern to be found, due to different logs recording diffe
of events. Each event type is most probably not occurring at the exact time on a Finding evidence of either a roll forward or a roll back in a log file is not sufficient
evidence to determine a timeline anomaly has occurred. To truly determine that an
anomaly has occurred, it is necessary to correlate the anomaly with anomalies found in
other log files on the system. Doing this correlation is not a simple task. Individual log
es will not match up
exactly across log files. There are actually 4 cases which need to be considered for
This is the best case scenario for event correlation. This would be
the pattern found if the two anomaly pairs contains the exact timestamps. This is
the least likely pattern to be found, due to different logs recording different types
● pair offsets by leading - In this case the first anomaly pair precedes the second
pair with an overlap of the anomalous timelines.
● pair offsets by trailing - In this case the first anomaly pair trails the second pair
with an overlap of the anomalous timelines.
● pair contained within another - This case occurs when one pair’s anomalous
timeline starts after the other and finishes before it.
The more log files that correlate an anomaly, the greater the probability that the
anomalous event is not a false positive. The correlation across multiple log files can
also be used to the narrow the window of real time and widen the window of anomalous
time to get a more accurate picture when the roll back or roll forward occurred, as well
as how long the anomalous period lasted. This is beneficial to the investigator in that it
can help narrow the focus to files that were altered during the anomalous time periods.
4 TADpole
Along with this research a tool was created to demonstrate the concepts
presented here. This tool is TADpole. TADpole is a utility application that operates on a
forensic disk image to detect timeline anomalies. TADpole is designed for performing
timeline anomaly detection on Microsoft Windows operating system based disk images.
The reason for this focus is the consistent nature of the log files on these systems.
Since Unix and Linux log files are all of varying formats it becomes more difficult to
quickly develop an application that could parse out these formats. Unix support is the
TADpole is a console application written in C++, focusing on running on Unix,
Linux, and Mac OS X platforms. These platforms were chosen because they provide
many libraries to aid in the development of the application, and these libraries are
consistent across these platforms. There are several reasons that the C++ language
was chosen for developing TADpole.
● Object Oriented Programming design patterns can be used.
● Linux / Unix / Mac OS X all have gcc compilers, make, and autotools making
building of the application easier and consistent on all platforms.
● The Sleuth Kit is a C/C++ library. On Linux, Unix, and Mac OS X platforms this
library is a single library file making it easy to import. On Microsoft Windows
platforms this library is spread out across multiple dynamic link library files.
● C++ allows for easy parsing and understanding of the binary file formats found in
windows event log files.
TADpole is designed to operate in several phases: discovery, parsing, detection,
pairing, correlation, and finally reporting. These phases are described below in more
detail.
4.1 Discovery Phase
The discovery phase is the phase in which the log files within the image are
located so that they can be processed. This is accomplished by leveraging The Sleuth
Kit application library. The Sleuth Kit library is used to open a forensics disk image and
locate log files in the system. This is done by extending a provided class in the library,
a file is found a function, processFile, is called to handle the processing of the found file.
This allows for inspecting the file to make sure that is a log file, and if so, inspect the file
for anomalies. To leverage this, a class was created that extends TskAuto. This class is
LogProcessor. LogProcessor implements the the virtual function necessary for TskAuto
to accomplish its work. This function has the following signature:
virtual TSK_RETVAL_ENUM processFile
(TSK_FS_FILE* fs_file, const char *path);
This is the function that initiates the work of identifying if the given file is indeed a log
file. Because TADpole is only concerned with Windows Event Log Files this becomes a
simple task. The processFile function simply looks at the filename contained within the
TSK_FS_FILE structure and looks to see if it ends with evt or evtx file extensions. This
check is done with a simple helper method within the LogProcessor, hasEnding. This
function takes the filename and the expected extension as arguments and returns true if
the filename ends with the file extension, and false otherwise. Since the filesystem on
Windows Systems (FAT32, NTFS) are case insensitive it is necessary to make both
strings lowercase first to ensure that the match is not determined by case. The function
makes use of the C++ string library in order to transform the strings and do the
comparison. The function can be seen here:
bool hasEnding
(std::string const &fullString, std::string const &ending) {
std::string lf(fullString); std::string le(ending);
std::transform(lf.begin(), lf.end(), lf.begin(), ::tolower); std::transform(le.begin(), le.end(), le.begin(), ::tolower);
lf.length() - le.length(), le.length(),
le)); else
return false; }
If it is determined that the file being processed is indeed a Windows Event Log File, the
next phase is triggered for the file.
4.2 Parsing Phase
The parsing phase is the phase in which the Windows Event Log File is parsed
and the events are extracted for analysis. To accomplish this an object oriented design
was used. An interface was created, ILogParser, in order to capture the work needed to
be done by a parser. This interface is defined as follows:
class ILogParser {
public:
virtual std::string getExtension() = 0; virtual std::vector<LogEvent*>
parseLogFile(TSK_FS_FILE *file, const char *path) = 0; };
This interface provides two method definitions. The first, getExtension, defines a
method to return a string containing the file extension that the parser is capable of
working on. The second function, parseLogFile, is the function that actually does the
parsing of the log file and returns a collection of LogEvent objects. The LogEvent class
is a data holder class that is defined in the application that holds three pieces of data,
date created, date written, and event id. These 3 pieces of information are the minimal
type, the implementing parsers can be used in a uniform way, independent of the event
entry types of their corresponding log files.
With the interface defined as above, two parsers were created, EvtLogParser
and EvtxLogParser. EvtLogParser was created to work on Windows NT Event Log Files
with the evt file extension. EvtxLogParser was created to work on Windows Vista Event
Log Files with the evtx file extension. These parsers work on their respective log file
formats to create a collection of LogEvents. The collection that is returned from the
parsers is an ordered collection of LogEvents. The order of the events is the same as
the order found in the log file. This is an important note, as it will aid in the next phases
of the program.
4.3 Detection Phase
In the detection phase, TADpole seeks to find, or detect, anomalies within the
LogEvent collection parsed from a log file. This is accomplished by walking the
collection from beginning to end, comparing an event to the one that follows. When
comparing the LogEvents it is necessary to compare both the date created as well as
the date written. Though these two dates are often the same within an event, it is not
always the case. There might be a delay in the time that an event is created and when it
can be written to the event log. This delay could occur for various reasons, such as slow
disk writes causing buffering or the central processing unit of the computer system
handling another process temporarily so that the write of the event is paused. Because
these dates might be different, they must be accommodated.
modified by a certain delta. The delta is provided to ensure that the anomalies that are
found are actual anomalies and not events that were written to the file out of sequence.
Two deltas were defined as number of seconds. These deltas were selected after
analysis of several log files and some trial and error attempts.
#define FORWARD_JUMP_DELTA 3600// 1 hour #define BACKWARD_JUMP_DELTA 300// 5 minutes
To detect a roll back anomaly the BACKWARD_JUMP_DELTA is used. This is
done by adding the delta value to the date in the following LogEvent and comparing it to
the date in the current LogEvent. If the modified date in the following LogEvent is less
than the date in the current LogEvent, it is determined that a roll back anomaly has
been found. The delta chosen for the backward jump is designed to insure that the out
of order event dates are not a product of lag within the computer system but are
purposeful manipulations of the clock.
To detect a roll forward anomaly the FORWARD_JUMP_DELTA is used. It is
applied by subtracting the delta to the date in the following LogEvent and comparing it
to the date in the current LogEvent. If the modified date in the following LogEvent is
greater than the date in the current LogEvent, it is determined that a roll forward
anomaly has been found. The delta of an hour was selected to help determine if the gap
was significant and not just a small idle session on the computer system. The roll
forward anomaly is the more difficult of the two anomalies to insure that it is an actual
anomaly and not just a product of the computer being idle, sleeping, hibernating, or
being shutdown for a period of time. From just this level of analysis of the log files, it is
impossible to determine this. It is in the pairing phase that it is determined whether or
In either of the cases, when an anomaly is found, an Anomaly object is created.
The anomaly object contains the two LogEvents that denote the anomaly as well as an
indication of the anomaly type. As these Anomaly objects are created, they are added to
a collection. The Anomaly collection is an ordered collection, where the order of the
Anomaly objects is the same order as found in the log file. This is important for the next
phase, as it aids in the pairing of the anomalies.
4.4 Pairing Phase
Within the pairing phase, all anomalies collected in the previous phase are
analyzed, and where applicable are paired together to form an anomaly pair. TADpole
finds these anomaly pairs by walking the collection of anomalies from beginning to end
and comparing the Anomaly to the one that follows. There are two cases that need to
be considered when pairing anomalies.
The first case is a roll forward followed by a roll backward. This case is indicative
of the clock being pushed forward into a future date and time, then being reset to the
current date and time after work was done. In code this would be found as the current
Anomaly being looked at being of type FORWARD_JUMP_ANOMALY and the next
Anomaly being BACKWARD_JUMP_ANOMALY.
The second case to be considered is a roll backward followed by a roll forward.
This particular case is indicative of the clock being rolled back to a past date and time,
then being reset to the current date and time after work was performed. In code this
would be found as the current Anomaly being looked at being of type
The case where an anomaly is followed by an anomaly of the same type could
easily be explained as not a purposeful manipulation of the clock. The case of two roll
forward anomalies could, for example, show that the computer was simply put to sleep,
or shut off, for a period of time twice. This is normal use of the computer and should
therefore be excluded. The case of two roll back anomalies could be an example of the
clock being adjusted for legitimate reasons, such as the clock being adjusted for
daylight savings time and then again for clock skew. This case too is normal use and
should be excluded.
Each time an anomaly pair is identified within the Anomaly collection, a new
object is created to hold the pair. This object is AnomalyPair. An AnomalyPair object
holds just two pieces of data, the two Anomalys that make up the pair. The type of
AnomalyPair, which case the pair was identified as, can be determined by inspecting
the type of the first Anomaly in the pair.
This phase is the final phase in the processing of an individual log file. Being that
this is the case, once the collection of AnomalyPairs is created, a new object is created
to contain the AnomalyPair collection as well as the information about the log file in
which the anomalies were found. The object created in this case is called
LoggedAnomalies. A LoggedAnomalies object holds another object called LogInfo as
well as the AnomalyPair collection. LogInfo contains the information that was passed
into the processFile method originally, TSK_FS_FILE pointer and a char pointer
representing the path to the file. Once the LoggedAnomalies object is created it is
added to collection that is a member of the LogProcessor class. This will allow the
4.5 Correlation Phase
The correlation phase is the final processing phase, occurring after all log files on
a system have been processed. During this phase, all anomalies that are found on a
system are correlated. This correlation is necessary as it increases the confidence that
a particular anomaly is truly an anomaly and not just a mistake. TADpole accomplishes
this task of correlation by processing the LoggedAnomalies collection that was created
after the pairing phase.
For every LoggedAnomalies in the collection, an entry is added to another
collection. The collection that is being added to is a collection of AnomalyCollection
objects. Each AnomalyCollection object contains an AnomalyPair, which is a
representation of the timeline anomaly that was detected. The AnomalyCollection also
contains the list of log files in which the represented anomaly was found. Also it
contains the actual AnomalyPair for each log file that correlates with the represented
anomaly in the AnomalyCollection.
The AnomalyPairs within each LoggedAnomalies is compared to the
AnomalyPair in every AnomalyCollection. If the AnomalyPair intersects the AnomalyPair
in an AnomalyCollection, then those anomalies are considered to be correlated. When
this occurs an entry is added to the AnomalyCollection which correlated. This entry
contains the AnomalyPair from the LoggedAnomalies that correlated as well as the
LogInfo, which contains the information about the log file in which the anomaly was
found. If a match is not found then a new AnomalyCollection is created and the
AnomalyPair from the LoggedAnomalies is added to it. The adding of an anomaly to
adjusts the representative AnomalyPair to better represent the AnomalyCollection.
These adjustments work to shrink the window of real time and widen the window of
anomalous time. This works by comparing LogEvent objects within the AnomalyPairs.
The representative AnomalyPair will take the greater, latest in time, of the first LogEvent
objects. This serves to find the more accurate time when which the roll back or roll
forward was performed. The second LogEvent objects are compared and the least of
those, earliest in time, is set in the representative AnomalyPair. This determines the
more accurate time to which the clock was rolled forward or rolled back. The greatest of
the third LogEvent objects is used to determine the most accurate time at which the
clock was reset to real time, current time. Finally, the least of the fourth LogEvent
objects is selected as it represents the more accurate time to which the clock was reset.
To help in the process of determining if two anomalies intersect a helper function
was added to the AnomalyPair pair. The function signature is:
bool intersects(AnomalyPair *pair);
This function will compare the current AnomalyPair to the given one and return true if
the two AnomalyPair intersect. Because the log events have two different date and time
fields, date written and date created, an AnomalyPair actually has two different timelines
that need to be considered and compared. Also, when determining if an AnomalyPair
intersects another, the anomalous timeline is the one that is used. This means that the
timeline that exists from the second LogEvent in the first Anomaly and the first LogEvent
in the second Anomaly of a pair. An intersection of anomalies is one of the correlation
4.6 Reporting Phase
After all the work of finding anomalies and correlating them together, the
investigator needs to know the results of what was found in the disk image. The
reporting phase is where this occurs. TADpole provides two ways to report the
information found, a simple grepable report or a more verbose XML report. Both of
these report types work by presenting the data within the collection of
AnomalyCollection objects that was created in the previous phase. The report presents
the four timelines represented by each anomaly. These timelines are the real time
according to the created and written dates as well as the anomalous time according to
the created and written dates. The report will also show the log files in which the
anomaly was located. The XML report goes further and displays the date and time for
each log event that makes up an anomaly.
Anomaly
real (created): 2008-11-01T00:33:42 - 2008-11-01T11:18:12 real (written): 2008-11-01T00:33:42 - 2008-11-01T11:18:12 anomaly (created): 2008-10-30T22:33:57 - 2008-10-30T22:38:50 anomaly (written): 2008-11-01T00:33:42 - 2008-10-30T22:38:50 logs:
Windows/System32/winevt/Logs/Microsoft-Windows-GroupPolicy%4Operational.evtx
Windows/System32/winevt/Logs/Application.evtx Windows/System32/winevt/Logs/Microsoft-Windows-TaskScheduler%4Operational.evtx
Windows/System32/winevt/Logs/Security.evtx Windows/System32/winevt/Logs/System.evtx
Example entry of grepable report
<anomaly>
<realstartcreated>2008-11-01T00:33:42</realstartcreated> <realstartwritten>2008-11-01T00:33:42</realstartwritten> <realendcreated>2008-11-01T11:18:12</realendcreated> <realendwritten>2008-11-01T11:18:12</realendwritten>
<log>
<path>Windows/System32/winevt/Logs/</path> <name>System.evtx</name>
<times>
<realstartcreated>2008-11-01T00:33:33</realstartcreated> <realstartwritten>2008-11-01T00:33:33</realstartwritten> <realendcreated>2008-11-01T11:14:40</realendcreated> <realendwritten>2008-11-01T11:14:40</realendwritten>
<anomalystartcreated>2008-10-30T22:33:57</anomalystartcreated> <anomalystartwritten>2008-10-30T22:33:57</anomalystartwritten> <anomalyendcreated>2008-11-01T01:37:39</anomalyendcreated> <anomalyendwritten>2008-11-01T01:37:39</anomalyendwritten> </times>
</log> </logs> </anomaly>
Example entry of XML report
TADpole also provides some extra functionality to help out investigators. This
extra functionality makes a second pass over the disk image and creates a list of files
whose MAC times (Modified / Accessed / Created) fall within an anomalous timeline.
This helps point an investigator to particular files that may have been altered while the
clock had been changed. This extra functionality is accomplished with another class that
extends TskAuto. The class is called FileProcessor. FileProcessor works by checking
every file’s MAC time and seeing if it falls within an anomaly within the collection of
AnomalyCollection objects. If it is found to be within an anomaly the file information is
added the the AnomalyCollection. Both report types will output this list along with each
anomaly entry.
5 Testing
To test TADpole, six different VMWare images were created, two instance of
each, Windows XP Professional, Windows Vista Business, WIndows 7 Enterprise.
BAT script was created to continually generate log events. This ensures that there is
sufficient evidence of the anomaly within the log files. This is a simple script that
leverages the eventcreate.exe application available on all three platforms. In order to
wait for a specified time would normally be done with a sleep command, but this
command was only present in Windows 7 Enterprise. To create a consistent way of
waiting a specified amount of time, the ping.exe command was used. By pinging a
non-existent address and specifying the time out in milliseconds, the command will wait the
specified amount of time then exit. This has the side effect of being a sleep command.
:looplabel
eventcreate /L System /ID 123 /D "Test Event" /T INFORMATION ping 123.45.67.89 -n 1 -w 3000 > nul
eventcreate /L Application /ID 123 /D "Test Event" /T INFORMATION ping 123.45.67.89 -n 1 -w 10000 > nul
goto :looplabel
This script creates an entry in the System log, waits three seconds, creates an
entry in the Application log, waits ten seconds then loops. This loop is an infinite loop,
so the script will run, and generate event entries, until the script is stopped with
CTRL-C. Before each test is run, the event logs are cleared. This is done to remove any
artifacts that might exist in the logs from installation. On the Windows XP images, this
was just a matter of opening the event viewer and clearing the logs. On the Vista and
Windows 7 images there are a great deal more log files. To clear these, the following
script was used:
@for /f %%i in ( 'wevtutil el' ) do wevtutil cl "%%i" >NUL 2>&1
wevtutil.exe cl "Microsoft-Windows-Diagnosis-DPS/Operational"
wevtutil.exe cl "Microsoft-Windows-User Profile Service/Operational"
wevtutil.exe cl "Microsoft-Windows-Windows Defender/Operational"
wevtutil.exe cl "Microsoft-Windows-Windows Firewall With Advanced
Security/Firewall"
wevtutil.exe cl System
To simulate work being done on the system the following actions were taken on each of
the virtual machines:
1 event.bat is started (on Windows Vista Business and Windows 7 Enterprise this
requires running as administrator).
2 6 file are created on the system: test1.txt, test2.txt, test3.txt, test4.txt, test5.txt,
test6.txt.
3 The system time is set to either a time in the future or the past.
4 The content of test3.txt, test4.txt, test5.txt is modified.
5 test6.txt is deleted
6 3 new files are created on the system: test7.txt, test8.txt, test9.txt.
7 The system time is reset to the real time.
8 The content of test4.txt and test8.txt is modified.
9 test2.txt, test5.txt, test9.txt are deleted.
10 A new file is created: test10.txt.
11 event.bat is stopped.
12 The system is shutdown.
The process outlined will generate ten separate files on the system as well as
generating many log file entries. The nature of the files creation, modification, and
deletion is done in order to test TADpole’s ability to not only detect an anomaly, but also
time period. Once the virtual machines have been shutdown the vmdk images are
converted into raw images that can be processed by The Sleuth Kit, and therefore
TADpole. The conversion is done by using “qemu-img convert”. The command used for
this conversion is:
qemu-img convert -O raw <vmdk image> <raw image>
Once this conversion is complete the raw image can be used directly by TADpole to
produce the reports of the tests. Those results are described below.
5.1 Windows XP Professional - Roll Forward Test
For the purposes of this test, the time was adjusted one month forward. The
results of this test returned a single anomaly. This anomaly is found in both the
Application and System log files, which were constantly being written to. This anomaly
is reported as follows:
Anomaly
real (created): 2012-10-10T18:04:35 - 2012-10-10T18:07:33 real (written): 2012-10-10T18:04:35 - 2012-10-10T18:07:33 anomaly (created): 2012-11-10T18:04:40 - 2012-11-10T18:07:24 anomaly (written): 2012-11-10T18:04:40 - 2012-11-10T18:07:24 logs:
WINDOWS/system32/config/AppEvent.Evt WINDOWS/system32/config/SysEvent.Evt
This report shows that the anomalous time line occurs in November 10th and the
real time occurs in October 10th. This is the result that is expected as that was the time
that the clock was adjusted to in the test. Another run was made with TADpole, this time
with file reporting turned on. This was done to insure that TADpole was able to find the
files that were manipulated during the anomalous period. The report generated reveals
period. Several of these files reveal the work that was done during the anomalous time
period.
Anomaly
real (created): 2012-10-10T18:04:35 - 2012-10-10T18:07:33 real (written): 2012-10-10T18:04:35 - 2012-10-10T18:07:33 anomaly (created): 2012-11-10T18:04:40 - 2012-11-10T18:07:24 anomaly (written): 2012-11-10T18:04:40 - 2012-11-10T18:07:24 logs:
WINDOWS/system32/config/AppEvent.Evt WINDOWS/system32/config/SysEvent.Evt files:
Documents and Settings/Administrator/Recent/test3.lnk Documents and Settings/Administrator/Recent/test4.lnk Documents and Settings/Administrator/Recent/test5.lnk
RECYCLER/S-1-5-21-1644491937-682003330-839522115-500/Dc2.txt RECYCLER/S-1-5-21-1644491937-682003330-839522115-500/Dc3.txt test/test3.txt
test/test7.txt test/test8.txt
WINDOWS/Prefetch/EVENTCREATE.EXE-28AF53E7.pf WINDOWS/Prefetch/NOTEPAD.EXE-336351A9.pf WINDOWS/Prefetch/PING.EXE-31216D26.pf
… removed for brevity …
The last three files in the list above reveal the executables that were being used.
Eventcreate and ping were used in the batch script that ran in the background to
generate the log entries. Notepad was used to make changes in the text files. The three
files presented directly in the output (test3.txt, test7.txt, text8.txt) are files that were
modified or created during the anomalous time period. The files test5.txt, test6.txt, and
text9.txt do not appear directly in the output. However, test3, test4 and test5 are
revealed as lnk files in the users Recent folder. These are the three files that were
modified during the anomalous time period. Observing the content of Dc2.txt and
Dc3.txt in the RECYCLER folder (trash can), revealed these files to actually be test5.txt
and test9.txt. This is very telling. When the file was deleted, the MAC time on the file