ISSN 2324-805X E-ISSN 2324-8068 Published by Redfame Publishing URL: http://jets.redfame.com
Effects of 8 Weeks of Plyometric Exercise on Certain Physiological
Parameters and Performance of Swimmers
Yildirim Gokhan Gencer1, Emre Can Igdir1, Serdar Sahin1, Fatih Eris1 1
Yuzuncu Yil University, School of Physical Education and Sports, Van, Turkey
Correspondence: Yildirim Gokhan Gencer, Yuzuncu Yil University, School of Physical Education and Sports, Van, Turkey.
Received: April 9, 2018 Accepted: May 8, 2018 Online Published: May 15, 2018
doi:10.11114/jets.v6i7.3194 URL: https://doi.org/10.11114/jets.v6i7.3194
Abstract
In this study, it is aimed to review the effects of 8 week plyometric exercises on certain physiological parameters and freestyle swimming performance of swimmers of age 10-11 who practice swimming with a licence in city of Van. Study group has been created by 24 male volunteer swimmers who practice swimming with a licence in city of Van. 24 volunteer athletes aged 10-11, who are licenced swimmers for two years and who exercise regularly 5 days a week have been selected for the study. The athletes are randomly divided into experimental and control groups of 12. Throughout the study, in addition to swimming exercises, experimental group is scheduled to 3 days a week plyometric exercise program. Control group is not given any additional exercise except from the swimming exercises. It is seen that the obtained data does not show normal distribution and non-parametric tests of Mann Whitney U and Wilcoxon Test are used for data analysis. Significance level is taken as p<0,05. As per obtained data, pretest and post test data of male swimmers of experimental group show that horizontal and vertical leaps, anaerobic power, 30m sprint, hand grip right and left, 25 and 50 m freestyle swimming parameters showed statistical significant difference; whereas for control group, weight, height, body mass index, anaerobic power and right and left hand grip force parameters showed statistical significant difference (p<0,05). When the pretest and posttests of experimental and control groups are compared, only vertical leap parameter showed significant difference in favor of the experimental group (p<0,05) and for the other parameters, no statistical significant difference is seen (p>0,05). As a result, it is seen that the 8 week plyometric exercise has a significant effect on vertical leap and even though not statistically significant, it is pondered that it has a positive effect on freestyle swimming duration of experimental group, compared to that of control group.
Keywords: plyometric exercise, swimming, physiological parameter, performance
1. Introduction
When the human race settled down to pursue their existence in prehistoric times, they preferred to settle down by water. Among the reasons of this choice, there were the facts that food resources are richer by water and it is easier to be protected by wild animals there. Human beings then began swimming with more primitive techniques than that of today’s modern swimming, in order to satisfy their hunger and to protect themselves from wild animals (Morpa, 2003; Bozdogan and Ozuak 2003). Since then, swimming has evolved and improved to become what it is today and is now divided into 4 different styles in international competitions.
Fastest one in these different swimming styles is the free style swimming. It consists of one right arm traction followed by the left and foot stomps (Bozdogan, 2003). Swimming as a sport is a branch that affects especially the upper extremity power. Attributes sought after in a successful swimmer are being tall, a large muscle mass, long upper and lower extremities and a wide shoulder structure (Troup, 1999). The sport of swimming is a complex sport branch which includes many factors such as high level anaerobic and aerobic capacity, stamina, force, a flexible body, velocity, speed, coordination and a good sense of rhythm (Tuzen et al., 2005). In swimming, the facts that lower extremity is powerful at a maximal level and its explosiveness are among the important variables which affect the performance of the athlete (Yapici et al., 2015).
performed both inside and outside water. Within the power exercises done on the ground, as per the age and physical properties of the athletes, jumping exercises can be done in addition to various other ones such as exercises performed with own body weight, exercises with auxiliary tools (bosu ball, thera band etc.) or exercises with small-medium or high weights (Yapici et al., 2016). Plyometric exercises, as it is a type of exercise which helps work every muscle of an athlete, is used as an effective method in increasing the power and speed capacity of athletes (Donald et al., 2003). This study aims to reveal the effect of 8 week of plyometric exercise method on certain physiological parameters and performance of swimmers aged 10-11.
2. Method
24 male athletes aged 10-11 from the city of Van who have a background of swimming with a license for two years voluntarily participated in the study, with consent forms obtained from their parents. 12 athletes are selected to undergo Pylometric exercises as experimental group and 12 athletes are selected to the control group. Random selection is used to set the groups. Experimental group is scheduled to perform Plyometric exercises 3 days a week in addition to their regular swimming exercises. Control group is requested to continue their regular daily swimming exercises. Selected measurements are obtained from the athletes before applying the exercise program and also after 8 weeks and then the change between pre and posttest values are reviewed.
Plyometric Exercise Program: Exercises are performed 3 days a week (Mondays, Wednesdays and Fridays). Resting periods are paid attention to (Nobre et al., 2017).
1st Week
Sideway Jump: Sideway jumps are performed as many as 14 x 5 times. Squat Jump: Squat Jumps are performed as many as 14 x 5 times.
Jumping Different Lengths: Jumps to the different length platforms are applied as many as 14 x 5 times.
Increasing Height Jump: Jumps to the platforms with sequenced increasing heights are performed as many as 14 x 5 times.
Decreasing Height Jump: Jumps to the platforms with sequenced decreasing heights are performed as many as 14 x 5 times.
2nd Week
Sideway Jump: Sideway jumps are performed as many as 16 x 5 times. Squat Jump: Squat Jumps are performed as many as 16 x 5 times.
Jumping Different Lengths: Jumps to the different length platforms are applied as many as 16 x 5 times.
Increasing Height Jump: Jumps to the platforms with sequenced increasing heights are performed as many as 16 x 5 times.
Decreasing Height Jump: Jumps to the platforms with sequenced decreasing heights are performed as many as 16 x 5 times.
3rd and 4th Weeks
Sideway Jump: Sideway jumps are performed as many as 18 x 5 times. Squat Jump: Squat Jumps are performed as many as 18 x 5 times.
Jumping Different Lengths: Jumps to the different length platforms are applied as many as 18 x 5 times.
Increasing Height Jump: Jumps to the platforms with sequenced increasing heights are performed as many as 18 x 5 times.
Decreasing Height Jump: Jumps to the platforms with sequenced decreasing heights are performed as many as 18 x 5 times.
Jumping Different Lengths: Jumps to the different length platforms are applied as many as 20 x 5 times.
Increasing Height Jump: Jumps to the platforms with sequenced increasing heights are performed as many as 20 x 5 times.
Decreasing Height Jump: Jumps to the platforms with sequenced decreasing heights are performed as many as 20 x 5 times.
One foot to left-one foot to right jump: Jumps on left foot for 20 x 5 times and jumps on right foot for 20 x 5 times are performed.
6th and 7th Weeks
Sideway Jump: Sideway jumps are performed as many as 22 x 5 times. Squat Jump: Squat Jumps are performed as many as 22 x 5 times.
Jumping Different Lengths: Jumps to the different length platforms are applied as many as 22 x 5 times.
Increasing Height Jump: Jumps to the platforms with sequenced increasing heights are performed as many as 22 x 5 times.
Decreasing Height Jump: Jumps to the platforms with sequenced decreasing heights are performed as many as 22 x 5 times.
One foot to left-one foot to right jump: Jumps on left foot for 22 x 5 times and jumps on right foot for 22 x 5 times are performed.
In addition to these exercises, starting from 6th and 7th weeks the athletes are scheduled to the following exercise:
Increasing Height + Squat Jump: Jumps to the platforms with sequenced increasing heights are performed as many as 22 x 5 times and for every jump, right after the athlete touches the ground, one squat jump is performed.
8th Week
Sideway Jump: Sideway jumps are performed as many as 24 x 5 times. Squat Jump: Squat Jumps are performed as many as 24 x 5 times.
Jumping Different Lengths: Jumps to the different length platforms are applied as many as 24 x 5 times.
Increasing Height Jump: Jumps to the platforms with sequenced increasing heights are performed as many as 24 x 5 times.
Decreasing Height Jump: Jumps to the platforms with sequenced decreasing heights are performed as many as 24 x 5 times.
One foot to left-one foot to right jump: Jumps on left foot for 24 x 5 times and jumps on right foot for 24 x 5 times are performed.
Increasing Height + Squat Jump: Jumps to the platforms with sequenced increasing heights are performed as many as 24 x 5 times and for every jump, right after the athlete touches the ground, one squat jump is performed.
Exercise program of 8 weeks for the experimental group is shown in table 1.
Table 1. Jump movements, definitions and protocols (Nobre et al., 2017)
Jumps Definitions
Sideway Jump Jumping to the ground from a 10 cm platform with two feet towards left and right.
Squat Jump Jumping from squat position with the help of arms after touching the ground with two feet from 10 cm platform.
Increasing Height Jump Jumping from the ground to sequenced platforms of 10, 20, 30 and 40 cm. Decreasing Height Jump Jumping from the ground to sequenced platforms of 40, 30, 20 and 10 cm. One foot to left-one foot to right
jump Jumping using only one foot.
Jumping Different Lengths Jumping to and from platforms of 30, 20, 40, 10, 30 cm without touching the ground.
Increasing Height + Squat Jump Jumping to 10, 20, 30 and 40 cm platforms and then jumping in squat position after touching the ground.
Table 2. 8 weeks exercise program scheduled to the experimental group
Week Exercise Type Set
Qty
Exercise Qty
Total Jump Qty
Rest Btw Exercises 1 Sideway jump; squat jump; jumping different lengths, increased and
decreased jumps 5 14 70 2-3 min.
2 Sideway jump; squat jump; jumping different lengths, increased and
decreased jumps 5 16 80 2-3 min.
3-4 Sideway jump; squat jump; jumping different lengths, increased and
decreased jumps + one foot left, one foot right 5 18 90 2-3 min.
5 Sideway jump; squat jump; jumping different lengths, increased and
decreased jumps + one foot left, one foot right 5 20 100 2-3 min.
6-7 Sideway jump; squat jump; jumping different lengths, increased and
decreased jumps + one foot left, one foot right + squat jump 5 22 110 2-3 min. 8 Sideway jump; squat jump; jumping different lengths, increased and
decreased jumps + one foot left, one foot right 5 24 120 2-3 min.
3. Findings
Experimental group mean age is 10,33±,888 and control group mean age is 10,33±,985.
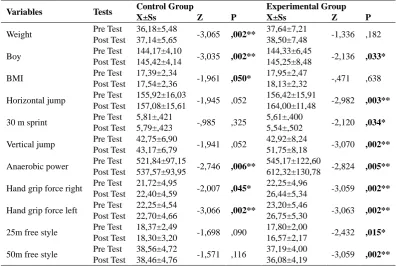
Table 3. Control and experimental group pretest and posttest comparison
Variables Tests Control Group Experimental Group
X±Ss Z P X±Ss Z P
Weight Pre Test 36,18±5,48 -3,065 ,002** 37,64±7,21 -1,336 ,182
Post Test 37,14±5,65 38,50±7,48
Boy Pre Test 144,17±4,10 -3,035 ,002** 144,33±6,45 -2,136 ,033*
Post Test 145,42±4,14 145,25±8,48
BMI Pre Test 17,39±2,34 -1,961 ,050* 17,95±2,47 -,471 ,638
Post Test 17,54±2,36 18,13±2,32
Horizontal jump Pre Test 155,92±16,03 -1,945 ,052 156,42±15,91 -2,982 ,003**
Post Test 157,08±15,61 164,00±11,48
30 m sprint Pre Test 5,81±,421 -,985 ,325 5,61±,400 -2,120 ,034*
Post Test 5,79±,423 5,54±,502
Vertical jump Pre Test 42,75±6,90 -1,941 ,052 42,92±8,24 -3,070 ,002**
Post Test 43,17±6,79 51,75±8,18
Anaerobic power Pre Test 521,84±97,15 -2,746 ,006** 545,17±122,60 -2,824 ,005**
Post Test 537,57±93,95 612,32±130,78
Hand grip force right Pre Test 21,72±4,95 -2,007 ,045* 22,25±4,96 -3,059 ,002**
Post Test 22,40±4,59 26,44±5,34
Hand grip force left Pre Test 22,25±4,54 -3,066 ,002** 23,20±5,46 -3,063 ,002**
Post Test 22,70±4,66 26,75±5,30
25m free style Pre Test 18,37±2,49 -1,698 ,090 17,80±2,00 -2,432 ,015*
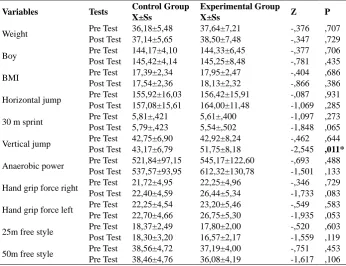
Table 4. Comparison of pretest and posttest results of control and experimental groups
Variables Tests Control Group
X±Ss
Experimental Group
X±Ss Z P
Weight Pre Test 36,18±5,48 37,64±7,21 -,376 ,707
Post Test 37,14±5,65 38,50±7,48 -,347 ,729
Boy Pre Test 144,17±4,10 144,33±6,45 -,377 ,706
Post Test 145,42±4,14 145,25±8,48 -,781 ,435
BMI Pre Test 17,39±2,34 17,95±2,47 -,404 ,686
Post Test 17,54±2,36 18,13±2,32 -,866 ,386 Horizontal jump Pre Test 155,92±16,03 156,42±15,91 -,087 ,931 Post Test 157,08±15,61 164,00±11,48 -1,069 ,285 30 m sprint Pre Test 5,81±,421 5,61±,400 -1,097 ,273 Post Test 5,79±,423 5,54±,502 -1,848 ,065 Vertical jump Pre Test 42,75±6,90 42,92±8,24 -,462 ,644 Post Test 43,17±6,79 51,75±8,18 -2,545 ,011*
Anaerobic power Pre Test 521,84±97,15 545,17±122,60 -,693 ,488 Post Test 537,57±93,95 612,32±130,78 -1,501 ,133 Hand grip force right Pre Test 21,72±4,95 22,25±4,96 -,346 ,729 Post Test 22,40±4,59 26,44±5,34 -1,733 ,083 Hand grip force left Pre Test 22,25±4,54 23,20±5,46 -,549 ,583 Pre Test 22,70±4,66 26,75±5,30 -1,935 ,053 25m free style Pre Test 18,37±2,49 17,80±2,00 -,520 ,603 Post Test 18,30±3,20 16,57±2,17 -1,559 ,119 50m free style Pre Test 38,56±4,72 37,19±4,00 -,751 ,453 Pre Test 38,46±4,76 36,08±4,19 -1,617 ,106 (p<0,05)
As can be seen in Table 4, in the pretest and posttest result comparison, except for vertical jump parameter, other parameters showed no statistically significant difference in favor of the experimental group (p>0,05).
4. Conclusion
References
Akcapinar, F. (2014). The Effect Of Plyometric Training On Balance And Soccer-Specific Of Aged 11-12 Children, Inonu University Health Sciences Institute, Doctorate Thesis
Bishop, D. C., Smith, R. J., Smith, M. F., & Rigby, H. E. (2009). Effect of plyometric training on swimming block start performance in adolescents. The Journal of Strength & Conditioning Research, 23(7), 2137-2143. https://doi.org/10.1519/JSC.0b013e3181b866d0
Bompa, T. O. (2013). Quick Force Training in sports (Plyometric for Upper Level Force Development), (Translated by: Eda Tuzuman), Sports Publisher and Bookstore, Ankara
Bozdogan, A. (2003). Physiology, mechanics and method of swimming, Ilpress Printing and Publishing, Istanbul
Bozdogan, A., & Ozuak, A. (2003). Basic swimming with the styles. Ilpress Printing and Publishing, Istanbul
Donald, A., & Myer, G. D. (2013). Plyometrics, Human Kinetics.
Gul, G. K., Konyali, M., & Gul, M. (2017). The Effect Of Plyometric Training On The Tennis Service Hits, Journal of Physical Education and Sports Studies, 9(1), 67-73.
Kish, K., Mezil, Y., Ward, W. E., Klentrou, P., & Falk, B. (2015). Effects of plyometric exercise session on markers of bone turnover in boys and young men. European journal of applied physiology, 115(10), 2115-2124. https://doi.org/10.1007/s00421-015-3191-z
Marinho, D. A., Amorim, R. A., Costa, A. M., Marques, M. C., Pérez, T. J. A., & Neiva, H. P. (2011). “Anaerobic” critical velocity and swimming performance in young swimmers.
Mentes, Ç., Turgut, M., Hasçelik, Z., & Özker, R. (1989). Pliometric, Power Acceptable Form, Turkish Journal of Sports Medicine, 24(2), 55-62.
Morpa Sports Encyclopedia (2003). Vol. 3, Istanbul.
Nobre, G. G., de Almeida, M. B., Nobre, I. G., dos Santos, F. K., Brinco, R. A., Arruda-Lima, T. R., … Moura-dos-Santos, M. A. (2017). Twelve Weeks of Plyometric Training Improves Motor Performance of 7-to 9-Year-Old Boys Who Were Overweight/Obese: A Randomized Controlled Intervention. The Journal of Strength & Conditioning Research, 31(8), 2091-2099. https://doi.org/10.1519/JSC.0000000000001684
Olcucu, B. (2012). Investigation of the effect of plyometric trainings on arm and leg strenght, the strokes speed of service, forehand and bachand and the percentages of shot accuracy, Marmara University Health Sciences Institute, Doctorate Thesis
Oztin, S., Erol, A. E., & Pulur, A. (2003). The Effect Of Pliometric And Explosive Power Trainings On The Physical And Physiological Characteristics Of 15-16 Ages Group Basketball Players, Gazi Journal of Physical Education and Sport Sciences (Gazi BESBD), VIII(1)1, 41-52.
Potdevin, F. J., Alberty, M. E., Chevutschi, A., Pelayo, P., & Sidney, M. C. (2011). Effects of a 6-week plyometric training program on performances in pubescent swimmers. The Journal of Strength & Conditioning Research, 25(1), 80-86. https://doi.org/10.1519/JSC.0b013e3181fef720
Sevim, Y. (1991). Condition Training, 1st Edition, Gazi Office and Bookstore Publications, Ankara, 35-63.
Troup, J. P. (1999). The physiology and biomechanics of competitive swimming. Clinics in Sport Medicine, 18(2).
Tuzen, B., Muniroglu, S., & Tanilkan, K. (2005). The Investigation Of Short Distance Swimmer To Compare Between 50 Meter Craftstyle Swimming And 30 Meter Sprint Test Results, Spormetre Beden Eğitimi ve Spor Bilimleri Dergisi, (3), 97-99.
Wilson, M., Adams, K. J., & Stamford, B. A. (2004). Aquatic plyometrics and the freestyle flip turn. Medicine & Science in Sports & Exercise, 36(5), 206.