Issues
ISSN: 2146-4138
available at http: www.econjournals.com
International Journal of Economics and Financial Issues, 2018, 8(3), 68-74.
Readability of Initial Public Offering Prospectus and Earnings
Performance
Rachappa Shette
1, Sudershan Kuntluru
2*
1Finance, Accounting and Control Area, Indian Institute of Management, Kozhikode - 673 570, Kerala, India,2Finance, Accounting
and Control Area, Indian Institute of Management, Kozhikode - 673 570, Kerala, India.*Email: [email protected]
ABSTRACT
The present study examines the readability of Initial Public Offering (IPO) prospectus in relation to short-term earnings performance and long-term earnings surprise. In this study, fog index is the measure of IPO prospectus readability. Cross-sectional regression models are applied on 115 IPOs
to examine the effect of readability scores on earnings performance and earnings surprise. Based on empirical analysis, we find positive correlation between Fog index and IPO-year earnings performance. In the short-run, IPO-year earnings performance of companies with difficult to read prospectus is higher than that of companies with easy to read prospectus. In the long-run, the earnings surprise for companies with difficult to read prospectus is
higher than that of companies with easy to read prospectus. Unlike the existing studies, application of readability index to IPO prospectus and linking it with short-term earnings performance and long-term earnings surprise is the contribution of the study.
Keywords: Firm Performance, Readability, Initial Public Offerings, India
JEL Classifications: L25, G32, O53
1. INTRODUCTION
The existing literature on readability focuses on annual reports (Li, 2008), quarterly reports (Lee, 2012) and earnings press releases (Henry, 2008) of profit making and loss-making firms. These studies evaluate the effect of readability on current earnings, earnings persistence and shareholders’ reaction. On the other hand, short-term earnings overperformance and long-term earnings underperformance of Initial Public Offering (IPO) companies is also well documented by Jain and Kini (1994). This short-term overperformance and long-term underperformance of IPO companies is due to Window of Opportunities Hypothesis, Agency Cost Hypothesis and Fads Hypothesis. Based on the extant literature, it is observed that no study examined the impact of readability of IPO prospectus on short-term and long-term earnings performance of IPO companies. Therefore, the present study examines the readability of IPO prospectus and its impact on earnings performance of IPO companies in India.
In relation to an IPO prospectus of an Indian company, the Supreme Court of India observed as “….Prospectus is the principal medium
through which the investors get information of the strength and weakness of the company, its creditworthiness, credence and confidence of promoters and the company’s prospects1.”
Thus, the present study on readability of IPO prospectus is important to investors, bankers, regulators, lenders, vendors and society. In this study, the readability is measured based on fog index as applied by Li (2008), Loughran and McDonald (2014a) and many others. It is argued that IPO companies with difficult to read prospectus (with higher fog index) may over perform in short-term and have higher earnings surprises in long-short-term. This could be opposite with the IPO companies with easy to read prospectus (with lower fog index).
The present study is based on 115 IPOs issued during the period 1st April 2007–31st March 2011. The sample IPO prospectus is
downloaded from the website of Securities Exchange Board of India (SEBI). The readability scores are computed with the help of Lingua: Fathom software after parsing the IPO prospectus. The
financial data is collected from Prowess data base of Centre for Monitoring Indian Economy. The IPO-year earnings performance is measured based on industry adjusted return on assets (ROA) and Industry Adjusted Return on Sales (ROS). The long-term earnings surprise is the median of annual earnings surprises of 3 years post IPO-year. The annual earnings surprise is the difference between annual industry adjusted earnings in post IPO-year and industry adjusted earnings in IPO-year.
It is hypothesised that Fog index has a positive impact on IPO-year earnings performance and on long-term earnings surprise. The hypothesis is examined based on four cross-sectional regression models. The ROA, ROS, earnings surprises in terms of ROA and ROS are considered as dependent variables. The readability measured by Fog index, size, firm age, leverage, industry dummy and intangible assets are independent variables.
The empirical results indicate the short-term earnings overperformance and long-term earnings underperformance based on industry adjusted ROA and ROS. The Fog index is positively correlated with IPO-year earnings performance and earnings surprises during post-IPO year. Thus, in short-term, these results indicate that the IPO companies with high readability index have performed better than that of IPO companies with low readability prospectus. In long-term, the results show the IPO companies with high readability index prospectus have higher earnings surprise than that of IPO companies with low readability prospectus.
The present study contributes to the existing literature in two aspects. One, it is the first study to apply the readability index to IPO prospectus. Two, it is the first paper to link the readability of IPO prospectus to short-term earnings performance and long-term earnings surprise.
2. REVIEW OF LITERATURE AND
HYPOTHESIS
The existing literature on readability of IPO prospectus is limited to a few studies. Hanley and Hoberg (2010) analyse the impact of content in U.S. IPO offer documents on offer prices based on the content analysis. The content of IPO prospectus is classified into standard content and informative content. According to this study, the information that is common in all industry IPO prospectuses is defined as standard content. While the information that is not explained in past and recent prospectus of other IPOs from the industry is defined as informative content. The study reveals that the greater the informative content in the IPO prospectus, the better the pricing accuracy and lesser under-pricing. It also reveals that informative content related to valuation models is the most significantly related to pricing accuracy.
Using textual analysis, Loughran and McDonald (2013) links uncertain text in the form S-1 language with first-day returns, offer price revisions and subsequent volatility for a sample of 1887 completed U.S. IPOs during 1997–2010. Form S-1 is the first securities exchange commission (SEC) filing in the IPO process. It finds that the percentage of uncertain, weak and negative words
in the form S-1 are much more powerful variables in explaining levels of under-pricing than many commonly used IPO control variables, such as venture capital dummy and top-tier underwriter dummy. The higher frequencies of uncertain, weak and negative words are positively and significantly linked with higher volatility in a 60-day period following the IPO offering.
Loughran and McDonald (2014) study the direct and indirect effects of SEC’s plain English rule of October 1998 on readability of the prospectus of U.S. debt filings and IPOs. The readability of prospectus is measured based on six components such as average sentence length, average word length, passive voice, legalese, personal pronouns and negative or superfluous phrases. The study finds that plain English does improve notably in all of the samples after the regulation is enacted in U.S. Thus, the existing literature on readability of IPO’s prospectus in relation to accuracy of offer price and under-pricing is based on content analysis. Therefore, there is no study on readability of IPO prospectus with the help of readability indices.
On the other hand, the long-term earnings underperformance of IPO companies is also well documented. Jain and Kini (1994) found a significant decline in the long-term earnings performance of U.S. IPO companies. Later on, similar results are documented by Mikkelson et al. (1996) in U.S., Cai and Wei (1997) in Japan, Balatbat et al. (2004) in Australia, Kim et al. (2004) in Thailand, Utamaningsih (2017) in Indonesia and Wang (2005) in China. In case of India, Ghosh (2005) finds long-term operating over performance. Later, Mayur and Kumar (2009), Mittal and Mayur (2012) and Shette et al. (2015) find significant long-term earnings underperformance of Indian IPO companies. Jain and Kini (1994), Mayur and Kumar (2009) and Mittal and Mayur (2012) observe reduction in equity retention by original entrepreneurs as a significant determinant of earnings underperformance of IPO companies in post-IPO years in U.S. and India. Teoh et al. (1998) find that U.S. IPO companies with unusually high accruals in the IPO-year experience poor adjusted stock return performance in the subsequent 3 years. Further, various research studies (like Roosenboom, et al., 2003; Kao et al., 2009; Ahmad-Zalulki et al., 2011; Chiraz and Anis, 2013; Shen et al., 2013 and Shette et al., 2015) find that there is a negative impact of IPO-year earnings management on long-term stock performance across various countries like China, India, Malaysia, Netherland and France.
Thus, the existing literature shows the continuous long-term operating underperformance of IPO companies in post IPO period across the countries and several reasons for this operating underperformance. However, no study examines the relation between readability of IPO prospectus and earnings performance of IPO companies.
2014a; Li, 2008; Jones and Shoemaker, 1994), quarterly reports (Lee, 2012) and earnings press releases (Henry, 2008).
3. METHODOLOGY
3.1. Sample
The sample IPOs are drawn from the IPOs offered during the period of 1st April 2007–31st March, 2011. There are 203 IPOs during the
study period. The samples of 115 prospectuses for the study are derived as presented in Table 1. The industry classification and year-wise classification of the sample IPOs are shown in Table 2.
3.2. Measures of Earnings Performance
The IPO-year earnings performance is measured based on ROA and Industry adjusted return on sales (ROS). The following equations are used for computation of industry adjusted ROA and ROS.
Industry adjusted ROAit=ROAit-Industry ROAt (1)
Industry adjusted ROSit=ROSit-Industry ROSt (2)
Where, i and t represent IPO company and accounting year respectively.
While determining the industry classification with respect to each IPO company, all 5073 listed companies in Bombay Stock Exchange are considered as on April 1, 2015. In the present study, we consider National Industry Classification (NIC) for identifying the similar comparable companies from the industry which is the most scientific industry classification in India. The NIC codes are used for industry classification with respect to each IPO company. As discussed in Teoh et al. (1998) and Ball and Shiv Kumar (2008), we also consider ten as minimum number of companies while identifying comparable industry companies for each IPO company. We explore comparable industry companies at five digit level of NIC classification. When minimum ten companies are not available for a particular IPO company, then we explore industry comparable companies for that IPO company at lower digits such as four, three, two and single digit of NIC classification.
3.3. Measure of Readability
As applied by Li (2008) and Franco et al. (2015), fog index is used as measure of readability of the IPO prospectus. Lingua: Fathom software is used to calculate the readability scores. The fog index is calculated as follows (Table 3):
Fog=(words per sentence+percent of complex words) × 0.4 (3)
3.4. Parsing of Prospectus Document
The sample IPO prospectus is downloaded from SEBI website in PDF format. These PDF files are converted into word document. These word files are parsed with the help of Macros in word and Kutool software. All tables, figures, pictures, header, footer, list of contents and abbreviations’ table have been removed from prospectus before using the word text for computation of readability scores.
Table 1: Selection of sample prospectus for the study
Particulars Number of IPOs
All IPO during the study period 203
Less: Financial services sector prospectus (15) Less: Follow-on-public Offers (FPO) (8)
Less: Scanned PDF files (2)
Less: Password protected PDF files (4) Less: Not available prospectus in SEBI website (30) Less: PDF to word Conversion problem (29) Final sample IPO prospectus for the study 115 IPO: Initial public offer, SEBI: Securities Exchange Board of India
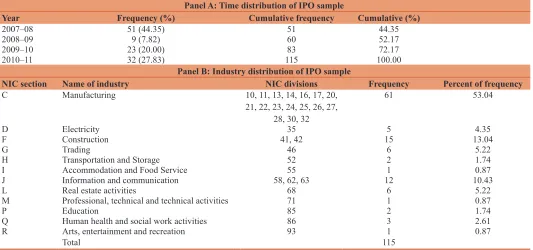
Table 2: Characteristics of sample companies conducting IPO during 1/4/2007–31/3/2011 Panel A: Time distribution of IPO sample
Year Frequency (%) Cumulative frequency Cumulative (%)
2007–08 51 (44.35) 51 44.35
2008–09 9 (7.82) 60 52.17
2009–10 23 (20.00) 83 72.17
2010–11 32 (27.83) 115 100.00
Panel B: Industry distribution of IPO sample
NIC section Name of industry NIC divisions Frequency Percent of frequency
C Manufacturing 10, 11, 13, 14, 16, 17, 20,
21, 22, 23, 24, 25, 26, 27,
28, 30, 32
61 53.04
D Electricity 35 5 4.35
F Construction 41, 42 15 13.04
G Trading 46 6 5.22
H Transportation and Storage 52 2 1.74
I Accommodation and Food Service 55 1 0.87
J Information and communication 58, 62, 63 12 10.43
L Real estate activities 68 6 5.22
M Professional, technical and technical activities 71 1 0.87
P Education 85 2 1.74
Q Human health and social work activities 86 3 2.61
R Arts, entertainment and recreation 93 1 0.87
3.5. IPO Prospectus Readability and IPO-year Earnings Performance
In this section, the relationship between readability of IPO prospectus and IPO year earnings performance is examined considering IPO-year earnings performance as dependent variable and readability along with control variables as independent variable. We expect that fog index is positively correlated with IPO-year earnings performance. The following two cross-sectional regression models are applied to examine the effect of readability scores on IPO-year earnings performance.
ROAit=∝+β1Fog Index+β2IntAssets+β3Age+β4Size+β5Leverage+
β6Industry Dummy+εit (4)
ROSit=∝+β1Fog Index+β2IntAssets+β3Age+β4Size+β5Leverage+
β6Industry Dummy+εit (5)
Where, i and t represent IPO Company and accounting year respectively.
3.6. IPO Prospectus and Earnings Surprise
In this section, the relationship between IPO prospectus readability and the long-term earnings surprises is examined. The earnings surprise is the median of annual earnings surprises of 3 years post IPO-year. The annual earnings surprise is the difference between post-IPO year annual industry adjusted earnings and IPO year industry adjusted earnings. The earnings surprise of ROA (ESROA) and ESROS are considered as dependent variables. As per Table 4, we take Fog Index as independent variable along with five control variables. We use the following two cross-sectional
regression models to examine the effect of readability scores on long-term earnings surprises.
ESROAit=∝+β1Fog Index+β2IntAssets+β3Age+β4Size+β5Levera
ge+β6Industry Dummy+εit (6)
ESROSi,t=∝+β1Fog Index+β2IntAssets+β3Age+β4Size+β5Levera
ge+β7Industry Dummy+εit (7)
Where, i and t represent IPO Company and accounting year respectively.
4. RESULTS AND ANALYSIS
Table 2 presents the IPO sample firms across the years and industry. The maximum number of IPOs is offered during the year 2007–08. This constitutes 44.35% of total sample firms. Among the industries, manufacturing industry accounts for 53.04% of sample firms.
Table 5 shows the summary of descriptive statistics of 115 IPOs. It indicates the average fog index as 16.39 with the range of 12.49–19.2. It implies that on an average, the readability index of the sample prospectus is on higher side and such documents are difficult to understand. The average age of the sample IPO companies is 16.04 years. Table 6 presents correlation matrix across all the variables. The Fog index is positively correlated with ROA and ROS.
4.1. Univariate Analysis
Table 7 presents the results of univariate analysis of readability of IPO prospectus and earnings performance of IPO-year. Based on readability index, the sample firm-years are classified into four quartiles. Quartile one consists of sample firm-years having the lowest readability index and quartile four consists of firm-years with highest readability index. The quartile-I and the quartile-IV are called as easy readability quartile and difficult readability
Table 3: Fog index description
Fog index Reading ease
≥18 Unreadable
14–18 Difficult
12–14 Ideal
10–12 Acceptable
8–10 Childish
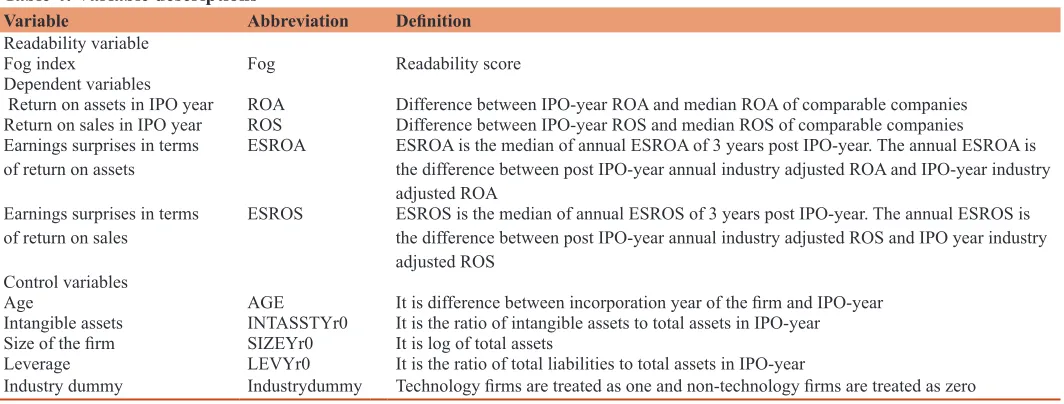
Table 4: Variable descriptions
Variable Abbreviation Definition
Readability variable
Fog index Fog Readability score
Dependent variables
Return on assets in IPO year ROA Difference between IPO-year ROA and median ROA of comparable companies
Return on sales in IPO year ROS Difference between IPO-year ROS and median ROS of comparable companies
Earnings surprises in terms
of return on assets ESROA ESROA is the median of annual ESROA of 3 years post IPO-year. The annual ESROA is the difference between post IPO-year annual industry adjusted ROA and IPO-year industry adjusted ROA
Earnings surprises in terms
of return on sales ESROS ESROS is the median of annual ESROS of 3 years post IPO-year. The annual ESROS is the difference between post IPO-year annual industry adjusted ROS and IPO year industry adjusted ROS
Control variables
Age AGE It is difference between incorporation year of the firm and IPO-year
Intangible assets INTASSTYr0 It is the ratio of intangible assets to total assets in IPO-year
Size of the firm SIZEYr0 It is log of total assets
Leverage LEVYr0 It is the ratio of total liabilities to total assets in IPO-year
Industry dummy Industrydummy Technology firms are treated as one and non-technology firms are treated as zero
quartile respectively. Mean, median and number of observations are presented to examine the relationship between readability and industry adjusted ROA and ROS. The results indicate that the median industry adjusted ROA of difficult readability quartile is 8.64 as compared to 4.02 of easy readability quartile. It is also observed that median industry adjusted ROS of difficult readability quartile is 3.83 as compared to 2.02 of easy readability quartile. Thus, it is found that in the short-run, the earnings performance of IPO companies is positively associated with readability index. This implies that, in the short-run, higher readability index results into higher earnings performance and vice-versa.
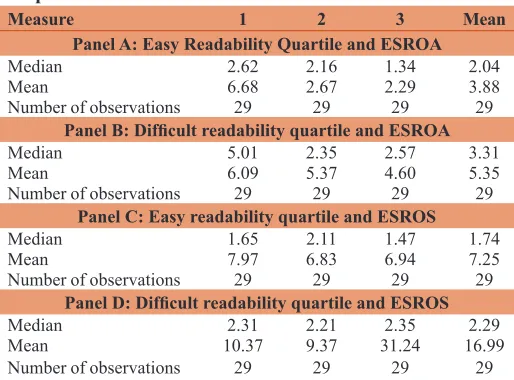
The present study also examines the impact of readability on long-term earnings surprise. Table 8 shows the results of univariate analysis of long-term earnings surprises and readability. Based on readability index, the sample firm-years are classified into four quartiles. Quartile one consists of sample firm-years having the lowest readability index and quartile four consists of firm-years with highest readability index. The quartile-I and quartile-IV are called as easy readability quartile and difficult readability quartile respectively. Mean, median and number of observations are presented to examine the relationship between readability and ESROA and ESROS. As per Table 8, the median ESROA of difficult readability quartile is 3.31 as compared to 2.04 of easy readability quartile. It is also observed that median ESROS of difficult readability quartile is 2.29 as compared to 1.74 of easy readability quartile. Thus, the empirical results indicate that in the long-run, the earnings surprise of IPO companies is positively associated with readability of IPO prospectus. In the long-run, it implies that higher readability index leads to higher earnings surprises and vice-versa.
4.2. Multivariate Analysis
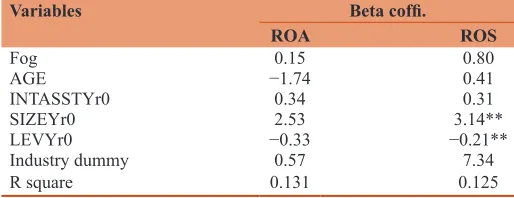
In this section, we examine the impact of readability index of prospectus on IPO-year earnings performance. Table 9 shows regression results of earnings performance as a dependent variable and readability as an independent variable along with the control variables such as size, leverage, age and intangible assets as per the model (4) and (5). Table 6 shows the positive correlation between readability index and earnings performance. Table 9 also indicates the similar relationship based on multivariate analysis. The results show the positive impact of fog index on ROA and ROS.
Table 5: Summary statistics of select 115 IPOs
Variable Average Standard deviation Minimum Maximum
Dependent variables
ROAYr0 10.53 16.74 −12.63 140.73
ROSYr0 4.85 15.72 −77.41 56.95
ESROA 4.91 5.52 0.38 46.89
ESROS 9.10 28.78 0.31 288.66
Control variables
AGE 16.04 12.55 3 93
INTASSTYr0 0.78 2.69 −5.58 20.16
SIZEYr0 8.18 1.29 5.95 12.99
LEVYr0 41.63 17.27 4.1 79.9
Industry
dummy 0.11 0.32 0 1
Readability variable
Fog index 16.39 1.25 12.49 19.2
Table 6: Spearman correlation matrix
Variable 1 2 3 4 5 6 7 8 9 10
1. ROAYr0 1
2. ROSYr0 0.4 1
3. ESROA 0.88 0.26 1
4. ESROS −0.11 −0.24 0.07 1
5. AGE −0.14 0.02 −0.15 −0.16 1
6. INTASSTYr0 0.15 0.13 0.15 −0.14 −0.14 1
7. SIZEYr0 0.03 0.15 −0.02 0.2 0.08 −0.06 1
8. LEVYr0 −0.28 −0.18 −0.25 0.07 0.05 −0.26 0.45 1
9. Inddummy 0.12 0.22 0.06 0.01 −0.02 0.17 0 −0.26 1
10.Fog index 0.06 0.08 0.09 0.1 −0.13 0.1 −0.07 −0.11 0.08 1
Table 7: Readability based on fog index and earnings surprises
Measure 1 2 3 Mean
Panel A: Easy Readability Quartile and ESROA
Median 2.62 2.16 1.34 2.04
Mean 6.68 2.67 2.29 3.88
Number of observations 29 29 29 29
Panel B: Difficult readability quartile and ESROA
Median 5.01 2.35 2.57 3.31
Mean 6.09 5.37 4.60 5.35
Number of observations 29 29 29 29
Panel C: Easy readability quartile and ESROS
Median 1.65 2.11 1.47 1.74
Mean 7.97 6.83 6.94 7.25
Number of observations 29 29 29 29
Panel D: Difficult readability quartile and ESROS
Median 2.31 2.21 2.35 2.29
Mean 10.37 9.37 31.24 16.99
Table 10 presents the results of multivariate analysis using regression models (6) and (7) as discussed in the research design section. In this, we examine the impact of readability on long-term earnings surprise of IPO companies along with control variables like age, intangible assets, size and leverage. As per Table 6, ESROA and ESROS are positively correlated with readability index. The similar results are found based on multivariate analysis. It implies that in the long-run, IPO companies with difficult to read prospectus show higher earnings surprise and vice versa.
Thus, in the short-run, IPO-year earnings performance of companies with difficult to read prospectus is higher than that of companies with easy to read prospectus. In the long-run, the earnings surprise for companies with difficult to read prospectus is higher than that of companies with easy to read prospectus.
5. CONCLUSIONS
The present study examines the readability of IPO prospectus and its impact on earnings performance of IPO companies in India. Based on empirical analysis, we find positive correlation between
Fog index and IPO-year earnings performance. Cross sectional regressions show the positive impact of Fog index on earning performance of IPO companies during IPO year. In short-run, this indicates that the IPO companies with difficult to read IPO prospectus perform better than that of IPO companies with easy to read IPO prospectus.
The cross sectional regression shows the positive impact of Fog index on long-term earnings surprise. This implies that the IPO companies with difficult to read prospectus have more variation in their future earnings and IPO companies with easy to read prospectus have less variation in their future earnings. Perhaps it is the first study to apply the readability index to IPO prospectus and link it with short-term earnings performance and long-term earnings surprise. The results are useful to investors, bankers, regulators, vendors and society.
REFERENCES
Ahmad-Zalulki, N.A., Campbell, K., Goodacre, A. (2011), Earnings
management in Malaysian IPOs: The East Asian crisis, ownership control, and post-IPO performance. The International Journal of Accounting, 46(2), 111-137.
Balatbat, M.C.A., Taylor, S.L., Walter, T.S. (2004), Corporate governance,
insider ownership and operating performance of Australian initial public offerings. Accounting and Finance, 44(3), 299-328.
Ball, R., Shivakumar, L. (2008), Earnings quality at initial public
offerings. Journal of Accounting and Economics, 45(2/3), 324-349. Cai, J., Wei, K.C.J. (1997), The investment and operating performance
of Japanese initial public offerings. Pacific Basin Finance Journal,
5(4), 389-417.
Chiraz, D., Anis, J. (2013), Earnings management and performance of
French IPO companies. Journal of Accounting and Taxation, 5(1), 1-14.
Franco, G.D., Hope, O., Vyas, D., Zhou, Y. (2015), Analyst report readability. Contemporary Accounting Research, 32(1), 1617-1640. Ghosh, S. (2005), The post offering performance of IPOs from the banking
industry. Applied Economics Letters, 12(2), 89-94.
Hanley, K.W., Hoberg, G. (2010), The information content of IPO
prospectus. The Review of Financial Studies, 23(7), 2821-2864.
Henry, E. (2008), Are investors influenced by how earnings press releases are written. Journal of Business Communication, 45(4), 363-407.
Jain, B.A., Kini, O. (1994), The post-issue operating performance of IPO companies. Journal of Finance, 49(5), 1699-1726.
Jones, M.J., Shoemaker, P.A. (1994), Accounting narratives: A review of empirical studies of content and readability. Journal of Accounting Literature, 13, 142-184.
Kao, J.L., Wu, D., Yang, Z. (2009), Regulations, earnings management,
and post IPO-performance: The Chinese evidence. Journal of Banking and Finance, 33(1), 63-76.
Kim, K.A., Kitsabunnarat, P., Nofsinger, J.R. (2004), Ownership and
operating performance in an emerging market: Evidence from Thai
IPO companies. Journal of Corporate Finance, 10(3), 355-381. Lee, Y. (2012), The effect of quarterly report readability on information
efficiency of stock prices. Contemporary Accounting Research, 29(4), 1137-1170.
Li, F. (2008), Annual report readability, current earnings, and earnings
persistence. Journal of Accounting and Economics, 45(2-3), 221-247.
Loughran, T., McDonald, B. (2014), Regulation and Financial disclosure:
The impact of plain English. Journal of Regulatory Economics, 45, 94-113.
Table 8: Fog index and IPO-year earnings performance
Measure ROA ROS
Easy Difficult Easy Difficult
Median 4.02 8.64 2.02 3.83
Mean 8.63 10.32 2.77 4.16
Number of observations 29 29 29 29
Table 9: Regression analysis of short term earnings performance on readability of IPO
prospectus. (Dependent variable: Return on assets (ROA) and return on sales (ROS)
Variables Beta coffi.
ROA ROS
Fog 0.15 0.80
AGE −1.74 0.41
INTASSTYr0 0.34 0.31
SIZEYr0 2.53 3.14**
LEVYr0 −0.33 −0.21**
Industry dummy 0.57 7.34
R square 0.131 0.125
**P<0.05; *P<0.10 refer statistical significance at 5% and 10% respectively
Table 10: Regression analysis of long term earnings performance on readability of IPO
prospectus. (Dependent variable: Earnings surprises measured as ESROA and ESROS)
Variables Beta coffi.
ESROA ESROS
Fog 0.22 1.98
AGE −0.58 −3.97*
INTASSTYr0 0.13 −0.43
SIZEYr0 0.54 5.00**
LEVYr0 −0.09*** −0.04
Industrydummy −0.54 0.05
R square 0.102 0.08
Loughran, T., McDonald, B. (2013), IPO first-day returns, offer price
revisions, volatility, and form S-1 language. Journal of Financial
Economics, 109, 307-326.
Loughran, T., McDonald, B. (2014a), Measuring readability in financial
disclosures. Journal of Finance, 69(4), 1643-1671.
Loughran, T., McDonald, B. (2014b), Regulation and financial disclosure:
The impact of plain English. Journal of Regulatory Economics, 45, 94-113.
Mayur, M., Kumar, M. (2009), Ownership and performance in an
emerging market: Evidence from Indian IPO’s. The Icfai Journal of Applied Finance, 15(7), 5-23.
Mikkelson, W.H., Partch, M.M., Shah, K. (1996), Ownership and operating performance of companies that go public. Financial
Economics, 44(3), 281-307.
Mittal, S., Mayur, M. (2012), Ownership change and deterioration of performance in post IPO period: A panel data analysis of Indian firms.
The IUP Journal of Corporate Governance, 11(2), 24-37.
Roosenboom, P., Goot, T.V.D., Mertens, G. (2003), Earnings management
and initial public offerings: Evidence from the Netherlands. The International Journal of Accounting, 38(3), 243-266.
Shen, Z., Coakley, J., Instefjord, N. (2013), Earnings management
and IPO anomalies in China. Review of Quantitative Finance and Accounting, 42(1), 69-93.
Shette, R., Kuntluru, S., Korivi, S.R. (2016), Opportunistic earnings
management during initial public offerings: Evidence from India. Review of Accounting and Finance, 15(3), 352-371.
Teoh, S.H., Welch, I., Wong, T.J. (1998), Earnings management and the long-run market performance of initial public of offerings. The Journal of Finance, 53(6), 1935-1974.
Utamaningsih, A. (2017), The influence of underpricing to IPO aftermarket performance: Comparison between fixed price and book
building system on Indonesian stock exchange. International Journal of Economics and Financial Issues, 7(4), 157-161.
Wang, C. (2005), Ownership and operating performance of Chinese IPO’s.