JIEM, 2015 – 8(5): 1746-1768 – Online ISSN: 2014-0953 – Print ISSN: 2014-8423 http://dx.doi.org/10.3926/jiem.1784
Performance Evaluation on Aquatic Product Cold-Chain Logistics
Wenbing Wu
1, Yanwei Deng
1, Mingyu Zhang
1*, Yihua Zhang
21
School of Economics and Management, Beijing Jiaotong University, Beijing 100044, P.R. (China)
2
Department of Economics, University of California, Santa Cruz, CA 95064 (U.S.A.)
wenbingwu@263.net, dengyanwei@126.com, mingyuzhang@263.net, yihuazhang@yeah.net
Received: November 2015 Accepted: December 2015
Abstract:
Purpose:
The requirements for high quality and diversification aquatic products are increasing
with the improvement of Chinese living standard. However, the distribution between the place
of production and the place of consumption are uneven, which results in large cold-chain
logistics demand for aquatic products. At present, the low-level development of cold chain
logistics has a bad impact on the circulation of aquatic products in China. So it is very urgent to
develop cold-chain logistics in China.
Findings:
We find out within a reasonable temperature range, lower temperature brings higher
profit level. Also, performance improvement methods are proposed and the simulation of
performance evaluation system is developed.
Practical implications:
Our findings can help to improve the level of aquatic product
cold-chain logistics in China.
Originality/value:
The paper proposes the SISP (Subjects, Indexes, Standards, and Phases of
performance evaluation) model and ACSSN model (Aquatic product, Customer, Supply Chain,
Society, and Node enterprises of supply chain) for aquatic products cold-chain logistics
performance evaluation.
Keywords:
aquatic products, cold-chain logistics, performance evaluation, performance improvement
1. Introduction
Until 2012, the output of Chinese aquatic production has ranked first in the world for 23 years. The volume per capita amounted to 43.63 kg. However, the production of aquatic products shows obvious regional characteristics in China. This leads to the differences in consumption habits and consumption preferences at difference region. Data from questionnaire shows that the expenditure proportion for aquatic products in the household food consumption are respectively 24%, 17% and 13% in Shanghai, Beijing and Xian (Sun, Wang & Zhang, 2015). Aquatic product, as a high-protein and high-nutrition food, is very popular and the consumption increases quickly. Because of the vast territory of China, the requirement for diversity and high quality aquatic products will results in multitudinous and long distance logistics. As a highly perishable product, aquatic products need the whole-chain support of cold-chain. But cold-chain logistics in China is still in its infancy. Its efficiency is low, its loss rate is high, and its product quality safety can’t be ensured. At the same time, the high logistics costs leads to high sales price of aquatic products. Therefore, how to promote Chinese aquatic products cold-chain logistics has become an important issue faced by the firms in China.
The rest of the paper is organized as follows. First, literature related to this research is reviewed. Then, we state the performance evaluation system for aquatic products cold-chain logistics. In Section 4, an empirical research is conducted by using the operational data of an aquatic products enterprise in China. In Section 5, a system dynamics model is built to verify the effect of maintaining a lower logistics temperature for performance level.
In this paper we propose SISP (Subjects, Indexes, Standards, and Phases of performance evaluation) model and ACSSN model (Aquatic product, Customer, Supply Chain, Society, and Node enterprises of supply chain) for aquatic products cold-chain logistics performance evaluation. We find out within a reasonable temperature range, lower temperature brings higher profit level. Also, performance improvement methods are proposed and the simulation of performance evaluation system is developed.
2. Literature Review
The first line of literature related to this study is on cold-chain logistics. Dabbene, Gay and Sacco (2008) developed a hybrid model to optimize the fresh food supply chain under uncertainty, to balance logistics costs and indicators affecting food quality such as maturity, microbiological control, temperature and others. Zanoni and Zavella (2012) studied the relationship between the temperatures setting, the effect of temperature on products quality, energy consumption and corresponding costs. Van Donselaar and Broekmeulen (2012) pointed out that retailers are keen to reduce the number of expired perishable products because the waste of expired perishable goods not only means the materials loss but also bring an increase in the supply chain transportation costs, labor costs and waste of social resources.
The second line of literature related to this study is on logistics and supply chain performance evaluation. Fawcett and Cooper (1998) conducted a longitudinal empirical research on more than 100 world's top logistics companies and found out that an excellent performance evaluation system is essential to achieve high performance. Wong (2008) considered benchmarking as a powerful management tool that can help organizations to establish best performance standards within the industry and promote the organization for continuous improvement. Garcia, Marchetta and Camargo (2012) proposed a logistics benchmarking framework for the wine industry. Jacxsens, Luning, Marcelis and van Boekel (2011) established a set of integrated tools for food safety management system: performance diagnosis, selection, and performance improvement.
cold-chain performance evaluation indexes is quite difficult because it is a typical multi-input and multi-output system. Jacxsens, Uyttendaele and Devlieghere (2010) developed a set of food safety performance management diagnostic system for strict and specific evaluation, which can yield better performance for the assumption. Joshi, Banwet and Shankar (2011) selected the costs, quality and safety, service levels, traceability, return on assets, innovation and customer relations as the evaluation indexes using Delphi-AHP-TOPSIS method, and constructed a cold-chain performance evaluation system based on benchmarking framework.
Summarizing above, we found that there are few special studies on the aquatic products cold-chain logistics performance evaluation in existed literature, and the results of these studies are relatively fragmented. Therefore, according to the characteristics and goals of aquatic products cold-chain logistics, we propose innovatively the SISP (Subjects, Indexes, Standards, Phases of performance evaluation) model for aquatic products cold-chain logistics performance evaluation system and ACSSN (Aquatic products, Customer, Supply chain, Society, Node enterprises of supply chain) model of performance evaluation indexes based on traditional performance evaluation system. Then we use “Fuzzy Comprehensive Evaluation Method” to evaluate the operation performance of an enterprise engaged in aquatic products in China, put forward the improvement measure of keeping lower logistics temperature and develop a system dynamics model to simulate the performance. Different from the existing researches, this paper constructs a complete framework for aquatic product cold chain logistics performance evaluation. It highlights the characteristics and the aim of aquatic product cold chain logistics, and has more realistic guidance significance for the development of aquatic product cold chain logistics in China.
3. Performance Evaluation System for Aquatic Products Cold-Chain Logistics
3.1. The Characteristics of Aquatic Products Cold-Chain Logistics
3.1.1. High Requirements for Logistics Temperature
3.1.2. High Requirements for Supply Chain Coordination
Different technical specifications of cold-chain logistics equipments, temperature fluctuations and time lags at different logistics links, and isolated information generated from subjective or objective factors should be coordinated closely between upstream and downstream enterprises. In addition, numerous logistics links and subjects, and lower degree of organization increase the difficulty of coordination.
3.1.3. High Comprehensive Cost of Logistics
The high infrastructure costs of cold-chain logistics, incurred by stiff price and specificity of facilities, the large energy consumption for low temperature, and the high quality loss cost increase the comprehensive costs of logistics. This is a major issue for the development of aquatic products cold-chain logistics and aquatic products consumption in China.
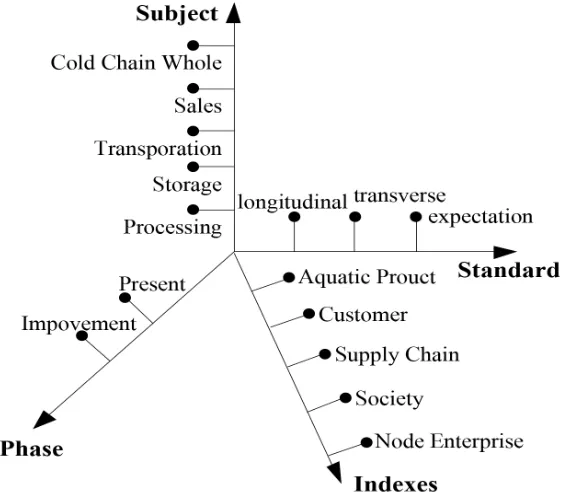
3.2. SISP Performance Evaluation Model
Figure 1. The SISP performance evaluation model
3.2.1. Evaluation Subject
It is well known that supply chain management emphasizes the optimal overall performance of the supply chain. However, aquatic products cold-chain logistics is a special chain and evaluating the aquatic products cold-chain logistics only from the overall perspective will lead to the following issues: First, the supply chain is actually a virtual organization which consists of independent entities. Each of node enterprises has its own strategic objectives and concerns. Aquatic products cold-chain logistics overall performance cannot fully reflect the demand of each node enterprise. Second, the performance is the sum of the processes and results and the overall performance cannot emphasize on the performance execution detail and coordination efficiency of each link. So it is difficult to find the causes of performance increase or decrease, and unable to develop highly targeted performance improvements methods. Third, the overall performance cannot reflect the individual enterprise’s performance and the contribution for the overall competitiveness enhancement.
3.2.2. Evaluation Indexes
The design of performance evaluation indexes is the first thing in performance evaluation. The indexes are the most direct carrier to achieve the objective of aquatic products cold-chain logistics. Aquatic products cold-chain logistics needs to meet the benefit demands of the participants, including aquatic products itself, customers, supply chain, society, and cold-chain logistics node enterprises. We select evaluation indexes based on the 5 aspects.
3.2.3. Evaluation Standards
Setting performance standards can deliver an organization’s strategic intent. Thus, choosing exactly what kind of performance standards has great impact on the implementation of the performance evaluation. Here we think that the nature of the performance evaluation is actually a comparison process, i.e., the actual performance is compared with some performance standards. The comparison process is available from the following three perspectives: longitudinal comparison, transverse comparison and expected comparison. Longitudinal comparison is to compare the performance of enterprise’s own historical performance. Transverse comparison is to compare with the similar enterprises. The available comparison standards can be the benchmarking performance or average performance of an industry. If there is no clear performance criteria, sorting transverse between evaluation objects is also a choice. Expected comparison contrasts the actual performance with the expected performance. The standards can be customer’s expectation performance, performance plans, and national or industry standards.
3.2.4. Evaluation Phase
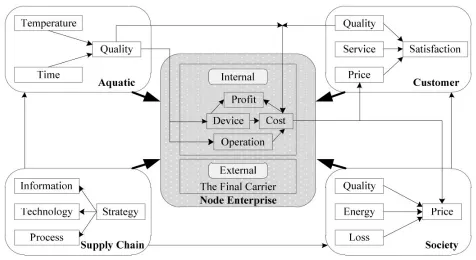
3.3. ACSSN Model for Performance Evaluation Indexes
It is well known that there are Key Performance Indicators, Balanced Score Card and other methods for the design of performance evaluation indexes. These methods have a positive effect on the evaluation of individual enterprise, but limitations for evaluation of the organizations across corporate boundaries such as aquatic products cold-chain logistics. The Supply Chain Operation Reference Model (SCOR) is specifically designed for supply chain management including the supply chain performance evaluation, but it is lack of adaptability to aquatic products cold-chain logistics performance evaluation because it is based on manufacturing industry supply chain. There are many researches about logistics performance evaluation, but the evaluation indexes system and framework model recognized by the industry has not taken shape. In order to deliver the objectives of aquatic products cold-chain logistics clearly and reflect its specificity, we propose an aquatic products cold-chain logistics performance evaluation ACSSN model, which is shown in Figure 2.
Figure 2. The ACSSN model
3.3.1. Aquatic Products Indicators
For aquatic products, the most critical indicator is the quality. According to the “3T” principle, the quality of aquatic products depends on circulation time, temperature and tolerance of the product itself. Because the tolerance is determined by the biological characteristics of aquatic products, it is an uncontrollable factor in cold-chain logistics. We only consider the influence of circulation time and temperature on the aquatic products cold-chain logistics. The circulation time and temperature are determined by the equipment and operational level of node enterprises in the cold-chain logistics, also affects the operating costs of node enterprises in the cold-chain logistics. Moreover, the quality of aquatic products determines customer satisfaction and reflects the appeal of public. So, the quality indexes are important in the evaluation on aquatic products cold-chain logistics.
3.3.2. Customer Indicators
Since the downstream enterprises are customers of the upstream ones in a supply chain, customers here mean the downstream enterprises. The target of aquatic products cold-chain logistics is to achieve customer’s satisfaction. Customers’ satisfaction depends on their expectation for the product or service as well as their actual experience of the product or service. A customer is satisfactory when the actual experience meets his expectations. The satisfaction will be very strong when the actual experience exceeds their expectations and the customers may purchase again. If the actual experience is below their expectations, customers are unsatisfied and lost. Of course, customers’ satisfaction ultimately depends on the better customer value provided by the company than its competitors. For cold-chain logistics, aquatic products’ quality, sale price, and service in purchasing (such as order fulfillment) are important factors in creating customer value.
3.3.3. Supply Chain Indicators
be called "chain" indeed. In aquatic products cold-chain logistics, only close collaboration can ensure that the products are under optimum temperature environment in the entire logistics process and cut all unnecessary retention time, and ultimately guarantee the quality safety of aquatic products. Also, collaboration benefits to the reduction of logistics loss and reduce energy consumption. The supply chain indicators mainly refer to the supply chain collaboration indicators, including four aspects: strategic collaboration, process collaboration, information collaboration and technology collaboration.
3.3.4. Social Indicators
From the level of the whole society, shorter time as far as possible of aquatic products circulating from water to dinner table, the quality stability in the logistics, fewer logistics links, lower loss in entire logistics process, better logistics efficiency, lower energy consumption in the logistics process, and lower comprehensive logistics costs, etc., are the focus of the public. The ultimate purpose of public concerning aquatic products cold-chain logistics is to improve terminal consumer satisfaction and improve people's livelihood.
3.3.5. Node Enterprises of Supply Chain Indicators
Internally, the quality and cost are the focus of node enterprises. The quality affects the product price and income. Equipment investment, utilization efficiency (asset management), and logistics operations are critical factors in the costs. Then, revenue and final costs determine the profits. Externally, the node enterprises are the ultimate bearer and coordinator of the different subjects. Because of the "Trade-off" law, which means a contradiction between costs and quality, the node enterprises, as the final implementation subjects of the aquatic products cold-chain logistics, must bear this relationship, and play the role as the ultimate bearers and coordinators of supply chain participants. However, there are certain causality and consistency between many subjects' expectations and goals, which can alleviate the degree of conflicts in a certain extent. For example, node enterprises’ behaviors to improve logistics efficiency, reduce logistics costs, cut total logistics loss down, guarantee product quality, and improve customer satisfaction, not only help to increase profits and enhance competitiveness, but also consistent with the public's value orientation.
3.4. Calculation Method for Performance Evaluation
reflects both objectivity and the decision maker’s preferences, but the determination of paired comparison matrix has certain arbitrariness. Entropy method is a purely quantitative weight assigning approach. So, this paper uses the entropy method to correct weights derived from ANP.
Fuzzy comprehensive evaluation method uses fuzzy math to make an overall assessment of things or objects constrained by variety of factors, it can better resolve ambiguous and hard-to-quantify problems. This paper first uses ANP and entropy method to determine the evaluation index weights, and then use the fuzzy comprehensive evaluation method to evaluate the performance of the empirical enterprise from 2008 to 2012. The steps of calculation method are as follows.
3.4.1. Calculating Weight by ANP Method
Use ANP method to calculate the weights which will be introduced it in Section 4.
3.4.2. Calculating Weight by Entropy Method
Let the proportion of index j and evaluation object i be , where m is the number of
the evaluation objects. Let the entropy of index j be ,
k
= 1/ln
m
. Then, theentropy weight of index j is .
3.4.3. Calculating the Combined Weight
Let
j be the weight gotten by ANP, then is the combined weight.3.4.4. Fuzzy Comprehensive Evaluation
First, we determine the factor-set and appraisal-set. Assuming that there are m evaluation indexes, we mark
U
= {
u1
,
u2
, …,
um
} as the factor-set of the evaluation objects. The
appraisal-set is a appraisal-set consists of all the possible values of evaluation indexes, and it is represented byV
= {
v1
,
v2
, …,
vn
}. Second, we establish the membership grade of each element in factor-set to
the element in the appraisal-set. The representation of an evaluation object in indexui
can beconstitute a fuzzy evaluation matrix , where
ri
= (
i
= 1, 2, ...,
m
;
j
= 1, 2, …,
n
) is
the membership grade of the index
ui
againstvj
. Third, letA
= (
a1
,
a2
, …,
ai
,
am
) be the weight
vector of the evaluation indexes. Selecting proper operator to composite weight vector A andmatrix R, we can get
B = A ○ R
= (
b1
,
b2
, …,
bn
). Fourth, assign the elements in appraisal-set a
special score, we can get
V '
= {
v'1
,
v
'
2, …,
v
'
n}. Multipling vector B with
V'
to get thecomprehensive evaluation scores of each evaluation object. The object with highest comprehensive score performs the best.
4. Empirical Research
4.1 Overview of the Empirical Object
Shandong Oriental Ocean Sci-Tech Co., Ltd. in Yantai, Shandong is a national high-tech enterprise operating aquaculture, refrigerated processing and storage, scientific research promotion and international trade. Its frozen food processing plant is hailed as " the most distinctive food processing plants in Asia," and it is now the benchmark enterprise in agriculture products processing industry in China. For commercial confidentiality reasons, we can only get the aquatic products cold-chain processing data. Then we evaluate the performance of its cold-chain logistics by using the actual data of aquatic products cold-chain from 2008 to 2012. The data are shown in Table 1.
4.2. Construction of Evaluation Indexes
Level 1 Level 2 Level 3 No Years
2008 2009 2010 2011 2012
Aquatic Product
Time Average processing time (days) X11 28 23 16 19 12
Temperature Temperature compliance rate (%) X12 92 92.80 92.50 92 92.80
Quality
Raw materials pass rate (%) X13 96 98 100 99 100
Batch detection rate (%) X14 90 92.5 96 98 100
Batch qualified rate (%) X15 99.70 99.20 99.50 99.60 99.40
Customer
Order Fulfillment
Timely delivery rate (%) X21 98.40 99.20 97.50 98.80 99.40
Order fulfillment rate (%) X22 99.30 99.80 99.40 99.60 99.20
Customer order lead time (days) X23 45 38 55 40 67
Customer Service
Customer satisfaction rate (%) X24 97.70 96.80 98.20 97.40 95.60
Customer feedback process rate (%) X25 98.4 93.8 99 97.6 99.7
Customer churn rate (%) X26 2.3 0 1.6 0.7 0.9
Supply Chain
Strategic Degree of strategic trust X31 0.6 0.8 0.7 0.8 0.9
Information Information sharing ratio (%) X32 92 93 100 97 100
Information sharing accuracy (%) X33 100 98.6 100 99.3 100
Process Process convergence smoothness X34 0.6 0.7 0.9 0.8 0.9
Technology Technical Compatibility X35 0.6 0.6 0.7 0.8 0.8
Society Energy Energy cost per unit (Yuan) X41 564.1 617.9 699.4 645.9 664.1
Price Change The factory purchase price rate (%) X42 130 128 143 137 135
Node Enterprise
Cost
Equipment depreciation cost rate (%) X51 1.04 1.60 1.31 1.15 1.15
Labor cost rate (%) X52 5.15 8.89 7.54 8.54 16.58
Cost raisingper 20% yield raising (%) X53 1.90 2.62 2.32 2.38 4.08
Asset Management
Equipment utilization (%) X54 81.30 81 81.60 80.80 81.90
Return on investment (%) X55 2.16 5.33 0.78 3.50 10.40
Turnover (%) X56 80.78 56.21 68.05 81.04 83.41
4.3. Calculation of Performance Evaluation
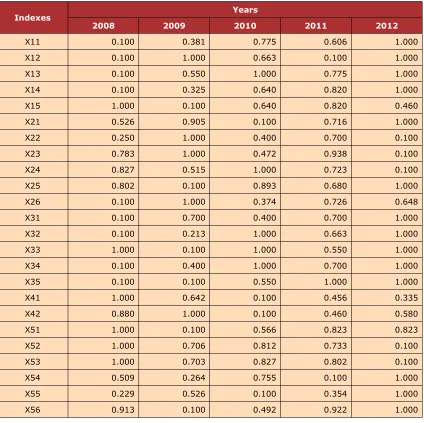
4.3.1. Data Normalization
The form of raw evaluation data listed in Table 1 cannot meet the requirements of relevant evaluation methods. Therefore, we need to normalize the raw data.
For efficiency-type indexes
For cost-type indexes
The data after normalizing are shown in Table 2.
Indexes Years
2008 2009 2010 2011 2012
X11 0.100 0.381 0.775 0.606 1.000
X12 0.100 1.000 0.663 0.100 1.000
X13 0.100 0.550 1.000 0.775 1.000
X14 0.100 0.325 0.640 0.820 1.000
X15 1.000 0.100 0.640 0.820 0.460
X21 0.526 0.905 0.100 0.716 1.000
X22 0.250 1.000 0.400 0.700 0.100
X23 0.783 1.000 0.472 0.938 0.100
X24 0.827 0.515 1.000 0.723 0.100
X25 0.802 0.100 0.893 0.680 1.000
X26 0.100 1.000 0.374 0.726 0.648
X31 0.100 0.700 0.400 0.700 1.000
X32 0.100 0.213 1.000 0.663 1.000
X33 1.000 0.100 1.000 0.550 1.000
X34 0.100 0.400 1.000 0.700 1.000
X35 0.100 0.100 0.550 1.000 1.000
X41 1.000 0.642 0.100 0.456 0.335
X42 0.880 1.000 0.100 0.460 0.580
X51 1.000 0.100 0.566 0.823 0.823
X52 1.000 0.706 0.812 0.733 0.100
X53 1.000 0.703 0.827 0.802 0.100
X54 0.509 0.264 0.755 0.100 1.000
X55 0.229 0.526 0.100 0.354 1.000
X56 0.913 0.100 0.492 0.922 1.000
4.3.2. Determining the Evaluation Index Weights
1) Using ANP to Calculate Weights
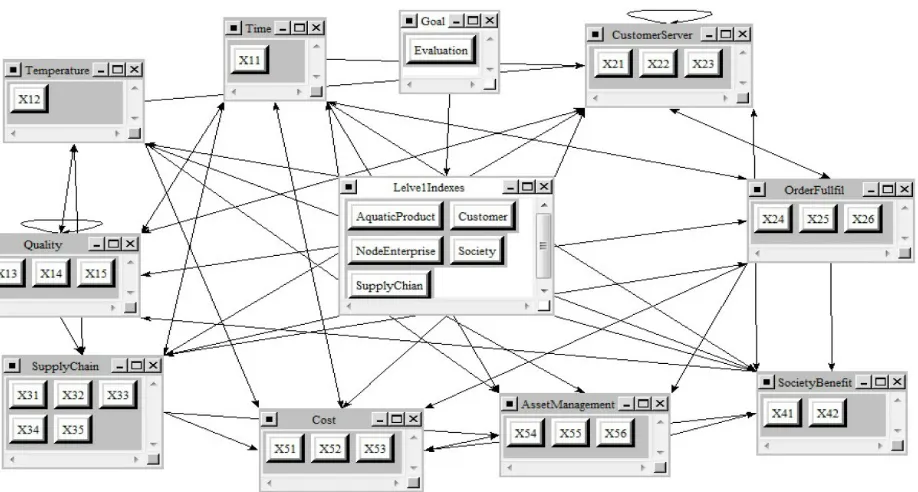
ANP method (Analytic Network Process), which is based on the AHP (Analytic Hierarchy Process), takes into account the interaction between the various factors or adjacent level, uses "super-matrix" to conduct comprehensive analysis of various interacting factors, and gets the mixed weights. Since the calculation of "super-matrix" in ANP method is extremely time-consuming, it must be completed by using computer software. The author uses Super Decisions software.
We construct the network model in Super Decisions, which is depicted in Figure 3. Each element-group in Figure 3 represents the level2 indexes shown in Table 1. The elements in each element-group represent the level3 indexes which are related with level2 indexes. The connection lines represent the relationships between different elements. The internal connection lines in some element groups such as quality,
Figure 3. The ANP model of evaluation indexes
2) Using Entropy Method to Revise the Weights
According to the method described in Section 3.5, after being corrected by entropy method, we get the final combination weight, which is shown in Table 3.
Index ANP Entropy Final Index ANP Entropy Final
X11 0.079 0.039 0.075 X32 0.033 0.054 0.043
X12 0.092 0.068 0.152 X33 0.023 0.036 0.020
X13 0.051 0.035 0.044 X34 0.016 0.041 0.016
X14 0.011 0.042 0.011 X35 0.008 0.070 0.014
X15 0.144 0.036 0.127 X41 0.008 0.043 0.008
X21 0.067 0.035 0.057 X42 0.084 0.038 0.077
X22 0.041 0.051 0.051 X51 0.069 0.033 0.056
X23 0.063 0.037 0.056 X52 0.017 0.031 0.013
X24 0.022 0.034 0.018 X53 0.046 0.031 0.035
X25 0.024 0.032 0.019 X54 0.028 0.047 0.032
X26 0.017 0.039 0.016 X55 0.018 0.054 0.024
X31 0.015 0.037 0.014 X56 0.024 0.037 0.021
Table 3. Weights of evaluation indexes
4.3.3. Fuzzy Comprehensive Evaluation
1) Determine the factor-set and appraisal-set of evaluation objects. Establish factor-set in accordance with the evaluation indexes shown in Table 1. We denote it by
U
= {
u1
,
u2
, …,
u24
}.
The appraisal-set is divided into five grades according to the performance level: excellent,good, fair, poor, and very poor, and we denote it by
V
= {
v1
,
v2
,
v3
,
v4
,
v5
}.
2) Determine the membership grade functions. Uses (1,0.75,0.5,0.25,0) to present excellent,
good, fair, poor, and very poor in the appraisal-set. We denote it by
V
= (1, 0.75, 0.5, 0.25, 0).
Select the normal membership grade function ,
(
a
= 1, 0.75, 0.5, 0.25, 0) as the
membership grade function of each index to appraisal-set. Here, the
σ
is the standard deviationing appraisal-set values.3) Construct fuzzy judgment matrix. According to the membership grade equation, calculate the membership grade of each index value in Table 2 to excellent, good, fair, poor, and very
poor. Make the normalization processing in accordance with , and
construct fuzzy judgment matrix for five years (denoted by R1…R5). Due to the space
4) Conduct the multivariate fuzzy evaluation. We denoted the weight vector from Table 3 by
A
= (0.075, 0.152, 0.044, …, 0.035, 0.032, 0.024, 0.021), select M
( . ,+)operator to carry compositional calculation for weight vector A and five fuzzy judgment matrix, we getB1 = A ○ R1
= (0.226, 0.204, 0.161, 0.214, 0.196),
B2
=
A ○ R2
= (0.249, 0.219, 0.180, 0.199,
0.153),
B3 = A ○ R3
= (0.192, 0.286, 0.258, 0.169, 0.095),
B4
=
A ○ R4
= (0.201, 0.307, 0.242, 0.154,
0.097),
B5 = A ○ R5
= (0.343, 0.272, 0.165, 0.129, 0.091).
5) Calculate comprehensive evaluation scores of five years. Assign the fuzzy appraisal-set,
V
´
= (10, 8, 6, 4, 2), multiple vector B with
V´
, and get the comprehensive evaluation scores of five years:G1 = B1V´
T= 6.101,
G2 = B2V´
T= 6.424,
G3 = B3V´
T= 6.622,
G4 = B4 V´
T= 6.721,
G5= B5V´
T= 7.296.
From the above, we can see that the performance in 2012 is the best (7.296), performance in 2008 is the worst (6.101). This implies that the performance of the enterprise has been continuously improved.
5. Performance Improvement Measures Simulation
As stated above, the original purpose of performance evaluation is to improve the performance. Based on the evaluation process and results stated in the previous section, we propose a performance improvement measure and a model to simulate its performance.
The foregoing "3T" principle shows that the circulation temperature and circulation time are the decisive factors of aquatic products quality. As we know, the lower circulation temperature can keep the quality of aquatic products for a longer period. Thus, the temperature is the most fundamental factor to ensure the quality of aquatic products.
It is well known that the lower the temperature is, the better is the product quality and the higher is the aquatic products cold-chain logistics performance level. However, maintaining lower temperature increases the costs and decreases the profits. The nature of the enterprises is to pursues the profits. Hence we need to conduct a simulation experiment to show that lowing logistics temperature is really able to benefit the enterprise.
model, take frozen cod for example, to study the impact of maintaining lower temperature environment against the profit of the enterprise.
5.1. System Dynamics Model
5.1.1. System Flow Diagram
We use Vensim software to build the system dynamics model, which includes four state variables: the inventory costs, the cumulative loss of quality, the retailer’s inventory, and the sale volume, and four rate variables: stock cost rate, quality loss rate, order rate and selling rate. The retailer’s inventory is jointly decided by the positive feedback loop of order and negative feedback loop of sales, and induce the retailer to stock inventory at the desired level; the inventory costs is decided by the positive feedback loop, the retailer inventory level, and the storage time; the accumulated quality loss is decided by the two positive feedback loops inventory temperature and inventory time. The profit is determined by the positive feedback of sales and the negative feedback of various types of costs. The system flow diagram reflects the relation between the variables in the model, represents also the structure form in detail, and is an important step for system dynamics modeling using Vensim. The flow diagram is shown in Figure 4.
5.1.2. Model Equations
1) State Equations
Retailer Stocks = INTEG (Order Rate - Sales Rate, 0)
Sales Amount = INTEG (Sales Rate, 0)
Stocks Cost = INTEG (Stock Cost Rate, 0)
Cumulative Quality Loss = INTEG (Quality Loss Rate, 0)
2) Rate Equations
Order Rate = DELAY3 (Retailer Order, Transportation Delay)
Sales Rate = IF THEN ELSE (Retailer Stocks> Average Sales Amount, Average Sales Amount + RANDOM NORMAL (-2, 2, 0, 2, 1), 0)
Stock Cost Rate = Stock Cost per day*Retailer Stocks
Quality Loss Rate = Quality Loss Table function (Temperature)*Retailer Stock
3) Some auxiliary equation
Profit = Sales Revenue - Stocks Costs -Quality Loss Costs - Procurement Costs
Sales revenue = Sales Price*Sales Amount
Quality Loss Costs =Cumulative Quality Loss*Sales Price*Price Loss Coefficient
Procurement Costs = (Retailer Stocks + Sales Amount)*Procurement Price
Retailer order = Max (0, (Expectation Stocks - Retailer Stocks) / Stocks Adjustment Time + Average sales Amount)
5.1.3. Parameters Setting
1) Quality loss table function
This model does not consider the loss of quality generated in the upstream of cod cold-chain logistics (the purchase price varies from different quality). For simplicity, we represent the profit decrease by multiplying total quality loss and price loss coefficient in the simulation period.
2) Temperature-energy consumption relationship table function
Although the energy consumption varies from different refrigeration equipment used by sales companies, the system power consumption is definitely increasing as the temperature decreases, and power consumption will increase significantly in order to obtain a lower temperature after reaching a certain temperature. Here the approximative power consumption coefficient ratio at each temperature is adopted from Lu and Wang (2012), which is shown in Table 4.
Temperature (℃) -10 -18 -25 -34 -40
Energy Consumption Ratio 0.84 1 1.17 1.55 1.97
Table 4. Energy consumption ratio of refrigeration equipment under different temperature
3) Some auxiliary variables and constant values
Procurement
Price Sales Price CoefficientPrice Loss Average Sales per Day Transportation Delay Coverage TimeStocks
140Yuan/Kg 200Yuan/Kg 0.2 10Kg/Day 2Day 20Day
Table 5. The variable and constant value of model
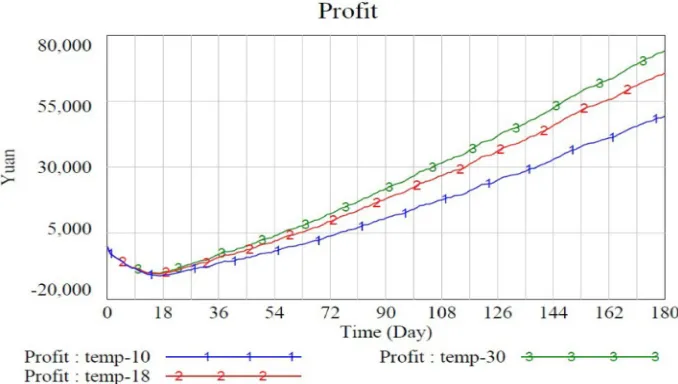
5.2. Model Simulation
decrease of quality loss cost is greater than the increase of inventory cost. This lead a higher profit level at -30℃ than it at -10℃.
Figure 5. The influence of different temperature against profit
6. Conclusions
The low-level cold-chain logistics performance is one of the important reasons leading to that aquatic products consumption and supply do not match in China. Through the analysis and research of this paper, the conclusions are as follows:
(1) Based on the analysis of the particularity of the aquatic products cold-chain logistics, combined with the traditional performance evaluation system, we first propose the SISP model of performance evaluation system and ACSSN model of evaluation indexes. Then we apply a fuzzy comprehensive evaluation method to evaluate operational performance of an aquatic products enterprise in China and propose an improvement measure of reducing the logistics temperature. Also we construct a system dynamics model to simulate its performance.
(3) The performance improvement is an essential part of performance evaluation. Maintaining low temperature environment is one of the most important ways to improve the performance level of the aquatic products cold chain logistics. But in order to get high profits, it is necessary to balance low temperature and cost. Through the simulation of system dynamics, we find that the profit increases as the temperature decreases under the reasonable temperature range. That is, the performance improvement measure of decreasing temperature can really improve the performance level of aquatic products cold chain logistics.
Acknowledgements
This paper is the research finding sponsored by National Science and Technology Support Projects (2012BAD38B08, 2014BAL07B01).
References
Aramyan, L.H., Oude Lansink, A.G.J.M., van der Vorst, J.G.A.J, & van Kooten, O. (2007). Performance measurement in agri-food supply chains: A case study. Supply Chain Management, 12(4), 304-315. http://dx.doi.org/10.1108/13598540710759826
Dabbene, F., Gay, P., & Sacco, N. (2008). Optimisation of Fresh-food Supply Chains in Uncertain Environments, Part I: Background and Methodology. BIOSYSTEMS ENGINEERING, 99(3), 360-371. http://dx.doi.org/10.1016/j.biosystemseng.2007.11.012
Bowersox, D.J. (1996). Logistical Management: The Integrated Supply Chain Process. McGraw-Hill.
Fawcett, S.E., & Cooper, M.B. (1998). Logistics Performance Measurement and Customer Success. Industrial Marketing Management, 27(4), 341-357.
http://dx.doi.org/10.1016/S0019-8501(97)00078-3
Garcia, F.A., Marchetta, M.G., & Camargo, M. (2012). A framework for measuring logistics performance in the wine industry. International Journal of Production Economics, 135(1), 284-298. http://dx.doi.org/10.1016/j.ijpe.2011.08.003
Jacxsens, L., Luning, P.A., Marcelis, W.J., & van Boekel, T. (2011). Tools for the performance assessment and improvement of food safety management systems. Trends in Food Science & Technology, 22(11), S80-S89. http://dx.doi.org/10.1016/j.tifs.2011.02.008
Joshi, R., Banwet, D.K., & Shankar, R. (2011). A Delphi-AHP-TOPSIS based Benchmarking Framework for Performance. Expert Systems with Applications, 38(8), 10170-10182.
http://dx.doi.org/10.1016/j.eswa.2011.02.072
Lu Y.Z., & Wang D. (2012). Energy-saving Analysis of CO2 Low Temperature Freeze and Cold Storage System. Refrigeration and Air-conditioning, 10(5), 23-27.
Sun, C., Wang, J., & Zhang, H. (2015). Comparative analysis of residents consumption level and consumption characteristics for aquatic products in Chinese big city. Chinese Agricultural Science Bulletin, 31(8), 86-92.
van Donselaar. K.H., & Broekmeulen, R.A. (2012). Approximations for the Relative Outdating of Perishable Products by Combining Stochastic Modeling, Simulation and Regression Modeling. International Journal of Production Economics, 140(2), 660-669.
http://dx.doi.org/10.1016/j.ijpe.2012.02.023
Wong, W.P. (2008). A Review on Benchmarking of Supply Chain Performance Measures. Benchmarking: An International Journal, 15(1), 25-51.
http://dx.doi.org/10.1108/14635770810854335
Zanoni, S., & Zavanella, L. (2012). Chilled or Frozen? Decision Strategies for Sustainable Food Supply Chains. International Journal of Production Economics, 140(2), 731-736.
http://dx.doi.org/10.1016/j.ijpe.2011.04.028
Journal of Industrial Engineering and Management, 2015 (www.jiem.org)
Article's contents are provided on an Attribution-Non Commercial 3.0 Creative commons license. Readers are allowed to copy, distribute and communicate article's contents, provided the author's and Journal of Industrial Engineering and Management's names are included.