doi:10.3926/jiem.2011.v4n2.p387-402 JIEM, 2011 – 4(2): 387-402 – Online ISSN: 2013-0953 Print ISSN: 2013-8423
Enhancing quality of vocational training outcome to satisfy
the labor market demands in Kuwait by using Quality
Function Deployment method (QFD)
Riyadh Mohammed Ali Hamza
Gulf University (BAHRAIN)
[email protected]
Received August 2010 Accepted January 2011
Abstract:
Purpose: The purpose of this paper is to develop a system to enhance the quality
of vocational training programs in Kuwait state by using the concept of Quality
Function Deployment (QFD).
Approach: The approach starts by investigating the private sector of the labor
market. The interviewing of a sample group of the private sector companies was
done to know their expectation of the performance of vocational training
outcomes. Then, QFD was applied to find the technical requirements, which will
help in satisfying the market’s expectations to design a new program that leads to
enhancement of the quality of the outcome of the Vocational Training. The house
of quality technique allows prioritizing the technical descriptors based on the
technical difficulty, target value, absolute weight, and relative weight.
doi:10.3926/jiem.2011.v4n2.p387-402 JIEM, 2011 – 4(2): 387-402 – Online ISSN: 2013-0953 Print ISSN: 2013-8423
which has a relative weight of 146 points. The third priority is the parameter
“Using IT Skills to Complete Activities” because of it has a relative weight is 132
points followed by the parameter “Time Management Activities” which has a
relative weight is 112 points.
Research limitation: The research limitation is in the changing of the current
curriculum program.
Practical implications: The practical implication is to modify the students’
vocational training curriculum, by adapting new technologies and application
sequences of activities and solution strategies within the time limit.
Value: The value of this paper is to explain how a studying curriculum can be
modified in order to satisfy the market requirements.
Keywords: quality function deployment, QFD, voice of customer, VOC, vocational
training outcomes, labor market demand
1 Introduction
This paper provides a scheme to enhance the quality of vocational training outcome to satisfy the labor market demands in Kuwait State by using Quality Function Deployment (QFD) Method for program development. Noonan and et al. (2007) highlights the twenty-first century workforce requirements in light of three new challenges: (1) the need for an increase in the quality and quantity of skilled workers; (2) the need for employees who are lifelong learners and have transferable skills; and (3) the need for flexible, adaptable career technical education systems.
doi:10.3926/jiem.2011.v4n2.p387-402 JIEM, 2011 – 4(2): 387-402 – Online ISSN: 2013-0953 Print ISSN: 2013-8423 technology. Seyfried (1998) Study shows that Vocational Training organizations began movements for the assurance of quality in vocational training from the beginning of the 1990s in Europe. Sector Skill Development Agency (SSDA) (2007) defines Occupational Standards of performance that people are expected to achieve in their work and the knowledge and skills they need to perform effectively. Occupational Standards set out measurable performance outcomes to which an individual is expected to work in a given occupation. This paper is to develop a system to enhance the quality of vocational training programs in Kuwait state by using the concept of Quality Function Deployment (QFD).
2 Quality Function Deployment review
doi:10.3926/jiem.2011.v4n2.p387-402 JIEM, 2011 – 4(2): 387-402 – Online ISSN: 2013-0953 Print ISSN: 2013-8423
3 The methodology
3.1 Overview of the outcome of the vocational training in Kuwait
The first step is to have a solid feedback and a measure to know the present status of the labor market. How many of the local vocational training outcomes are there in the private sector of the labor market? What is the percentage of that outcome among the total workers of the market? Manpower Government Reconstructing Program (MGRP) record shows (see table 1) a record of the percentage of the vocational Kuwaiti outcomes in local market demand of private sector in Kuwait State. The next step is to scan the market to evaluate how strong the reception of the private sector of the labor market on the outcomes of the local vocational training. These steps and others can be achieved by the following:
Surveys and questionnaires
Hamza and Alrowaih (2010) made Surveys and Questionnaires. The questionnaires were distributed to the graduated students of the past three years. The first questionnaire was distributed to 40 graduated students for the period (2006-2009) from public vocational training authority in Kuwait. These surveys and questionnaires concentrate on the following aspects:
1. The waiting time to be accepted to work for a company.
2. The missing skills needed to be competed at the workplace.
3. Number of companies refuses the graduate employment application.
4. Reasons of refusal.
5. The relation between the current job and the subject trained for.
Interviews
doi:10.3926/jiem.2011.v4n2.p387-402 JIEM, 2011 – 4(2): 387-402 – Online ISSN: 2013-0953 Print ISSN: 2013-8423 Set of surveys and interviews
Set of surveys and interviews also were distributed among the private labor market companies to evaluate the productivity of the workers from the vocational training providers in Kuwait State.
Table 1. “Percentage of the vocational outcomes in the private sector in Kuwait state”. Source: Manpower Government Reconstructing Program (MGRP) record, State of Kuwait.
3.2 Requirements and skills needed by the private labor market
Sets of surveys were designed and distributed into the labor market covering the main three size categories of companies. Large companies those have more than 250 employees, middle size companies those have less than 200 employees and small size companies which have less than 50 employees. The study covers the services sector, industrial sector, constructional sector, as well as technology
Occupations
Percentage
Total
KW Voc. Outcome Other Source Outcome
Count % Count %
Technician 94 1.1% 8127 98.9% 8221
Carpenter 0 0% 4426 100.0% 4426
Electrician 27 .6% 4165 99.4% 4192
Metal Technician 0 0% 3098 100.0% 3098
Mechanics 40 2.0% 1971 98.0% 2011
Constructional Vehicle Operators 0 0% 1704 100.0% 1704
Painter 0 0% 1540 100.0% 1540
Welder 4 .3% 1498 99.7% 1502
A/C Technician 3 .2% 1433 99.8% 1436
Accountant 14 1.0% 1375 99.0% 1389
Concrete Frame work 0 0% 1236 100.0% 1236
Technician Assistant 30 3.0% 973 97.0% 1003
Supervisor 109 13.0% 728 87.0% 837
Mechanic 20 2.7% 715 97.3% 735
Plumber 2 .3% 696 99.7% 698
Decoration 0 0% 634 100.0% 634
Super Attendance 10 1.6% 600 98.4% 610
Mechanic assistance 2 .3% 572 99.7% 574
Inventory 8 1.5% 532 98.5% 540
Arc Welder 0 0% 495 100.0% 495
Maintenance 16 5.9% 256 94.1% 272
Electrical Assistances 2 .7% 265 99.3% 267
Equipment Operator 1 .4% 264 99.6% 265
Sale Representative 13 5.0% 249 95.0% 262
Engineering Drawing 2 .8% 257 99.2% 259
Gas Welding 0 0% 258 100.0% 258
Project Manager 5 2.1% 235 97.9% 240
Drafter 0 0% 225 100.0% 225
Computer Programmer 4 1.8% 217 98.2% 221
Receptionist 71 37.8% 117 62.2% 188
doi:10.3926/jiem.2011.v4n2.p387-402 JIEM, 2011 – 4(2): 387-402 – Online ISSN: 2013-0953 Print ISSN: 2013-8423 sectors. The focus on this stage is to get direct answers to specify skills required from vocational training providers. The survey was assessed using a 5-point Likert scale (5pt = Very important, 4pts = important, 3pts Average, 2pts not important, 1pts sure not important) and includes 50 companies, nearly 40 skills were specified and then it were reduced to Top Ten Important skills (TTIS) based on the highest important ten scores means of the answers.
4 Results and discussions
4.1 Market analysis and survey results
The survey questionnaires for the labor market demand shows the top ten important skills of most demanded, which were verified and inserted into the HOQ matrix. The calculation parameters prioritized the technical descriptors to be deployed into a training program to help each of the top ten skills to be achieved.
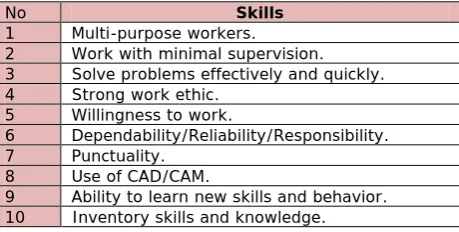
4.2 Top Ten Important Skills (TTIS)
Based on the highest values received for labor market survey of each skill, the most demanded top ten important skills by the private sector in State of Kuwait is shown in (table 2):
No Skills
1 Multi-purpose workers.
2 Work with minimal supervision. 3 Solve problems effectively and quickly. 4 Strong work ethic.
5 Willingness to work.
6 Dependability/Reliability/Responsibility. 7 Punctuality.
8 Use of CAD/CAM.
9 Ability to learn new skills and behavior. 10 Inventory skills and knowledge.
Table 2. “Top Ten Important Skills most demanded for the private sector of labor market in Kuwait state”.
4.3 House Of Quality (HOQ) analysis (applying (QFD) on labor market
priorities.)
doi:10.3926/jiem.2011.v4n2.p387-402 JIEM, 2011 – 4(2): 387-402 – Online ISSN: 2013-0953 Print ISSN: 2013-8423 the labor market. The top vertical columns represent the technical approaches to reach the requirements often called (HOWs). The middle part of the house of quality represents the relations between the VOC and the HOWs. The top triangle often called the roof of the house of quality represents the relations between the (HOWs). Also, the HOQ provides more parameters to be measured from different perspective, such as the level of difficulties, customer importance, importance rates, and relevant weight.
4.4 Determining the Voice Of Customer (VOC)
To begin a QFD process, the voice of the customer was identified and prioritized by the survey report and placed on the horizontal part of the HOQ shown in (figure 1).
Besterfield et al. (2003) show The equations are used to determine important calculations in quality function deployment house:
Scale-UP-Factor = (The Target Value) ÷ (Customer Rating) (1)
Absolute weight = (Importance to Customer) × (Scale-UP-Factor) (2)
Relative weight = bj = i n
i ij
d
R
∑
=1
(3)
Where
b = row vector of relative weights for technical descriptors (j=1,….,m)
di = column vector of absolute weights for the customer requirements (i=1,…n)
Rij= weight assigned to the relationship matrix
Equations 1, 2 and 3. Source: Besterfield, D. H., Besterfield, C., Besterfield, G. H. and Besterfield, M. (2003).
A sample of these calculations, the Inventory skills and knowledge Demand row is:
doi:10.3926/jiem.2011.v4n2.p387-402 JIEM, 2011 – 4(2): 387-402 – Online ISSN: 2013-0953 Print ISSN: 2013-8423 descriptors, Managing tasks and meeting deadlines, Team activities, and inventory activities.
• The relation strength of the inventory skills and knowledge demand and the approach managing tasks and meeting deadlines is one point in a scale of five. Team activities approach and Inventory activities to deploy this demand got 5 points in a scale of five for the relation strength. The following parameters show the rating of this demand:
Customer importance = 1 (This parameter is set by the customer)
Scale-UP-Factor = (Target value ÷ Customer Comparative)
= (2÷2) = 1
Absolute weight = (Customer importance × Scale-up)
= (1×1) =1
4.5 The technical descriptors to deploy the skills into a program (HOWs)
The vertical columns of the House Of Quality (HOQ) presents the approaches to be deployed to satisfy the customer needs. Which parameter that have more an approach receives from the correlation matrix, will have to be more considered weight in the prioritization stage.
Technical descriptors parameters;
Organizational Difficulties: This parameter is to be set by the organization experts based on the organizations’ abilities to deploy a technical descriptor.
• Technical competitive assessment: This parameter shows the actual and the current level of a technical descriptor of the organization.
• Target benchmark: This parameter shows the target for the organization to reach for a specific technical descriptor.
doi:10.3926/jiem.2011.v4n2.p387-402 JIEM, 2011 – 4(2): 387-402 – Online ISSN: 2013-0953 Print ISSN: 2013-8423 with Minimal Supervision) parameter and (Willingness to Work) parameter in weak relationship weighting .The following parameters show its priorities:
Absolute weight = ((1×5) + (1×5)) = 10
Relevant weight = ((1×20) + (1×13)) = 33
4.6 The roof of the House Of Quality (HOQ)
The roof of the house of quality (HOQ) defines the relationships between the technical descriptors (HOWs) strength and how they are related to each other.
Based on the strength of the relations, priorities to deploy these approaches can be clarified. The approaches of (HOWs) can be classified as Primary and Secondary. The primary approaches are those encouraged to be used for more than one of the voice of customer’s demands and they are general in nature, while the secondary approaches can be used to enrich the deployment of the skills needed to satisfy the customer needs and they are specific in nature.
The relationships between the technical descriptors (HOWs)
Measuring the relation between the approaches (HOWs) is a very important stage to prioritize the approaches to be deployed in a program. The priority would be for the approaches that have stronger relationships, first followed by the weaker ones.
The technical descriptors priorities
The house of quality technique allows prioritizing the technical descriptors based on the parameters technical difficulty, target value, absolute weight, and relative weight. The QFD team identifies technical descriptors most needed to fulfill customer requirements and need improvement. Higher absolute and relative rating identity areas these engineering efforts need to be concentrated, so:
doi:10.3926/jiem.2011.v4n2.p387-402 JIEM, 2011 – 4(2): 387-402 – Online ISSN: 2013-0953 Print ISSN: 2013-8423 • The second priority is (Simulation Activities) parameter because of its
relative weight is 152 points followed by (Managing Tasks and Meeting Deadlines) parameter which relative weight is 146 points. These two technical descriptors meet at the roof of the (HOQ) and form the second priority.
doi:10.3926/jiem.2011.v4n2.p387-402 JIEM, 2011 – 4(2): 387-402 – Online ISSN: 2013-0953 Print ISSN: 2013-8423 • The third priority is (Using IT Skills to Complete Activities) because of its relative weight is 132 points followed by (Time Management Activities) parameter which relative weight is 112 points. These two technical descriptors meet at the roof of the HOQ and form the third priority.
4.7 Organizational difficulty
The organizational difficulty parameter in the HOQ is to measure the difficulty of each technical descriptor to be deployed in the program. The level of difficulties is based on the evaluation of the QFD team with correlations for the demands in the matrix section. Setting difficulty rate helps identifying the ability to implement certain quality improvement.
Deployment difficulties
Deployment difficulties are a parameter to be set by the organizations’ experts. Depending on the ability of an organization a program can be designed and targets can be set. The range of the deployment difficulties in this paper is ranked from one to five, where one is easy and five is very difficult.
• The deployment of the approach of (Team projects into the demand Inventory skills) was ranked easy, because it gets only one point in a scale of five.
• The deployment of the approach of (Problem based scenarios and case studies into the demand Solve problems effectively and quickly) was ranked need more effort because it received 2 point out of five.
• The deployment of the approach of (Practicing how to define the roles within a team to satisfy the demand Punctuality Skills) was ranked need more effort because it received two point out of five.
• The deployment of the approaches of (exercising a range of strategies to solve problems to satisfy the demand Solve problems effectively and quickly) was ranked easy because it received one point out of five.
doi:10.3926/jiem.2011.v4n2.p387-402 JIEM, 2011 – 4(2): 387-402 – Online ISSN: 2013-0953 Print ISSN: 2013-8423 • The deployment of the approach of (practice to be willing in
learning-applying new technology skills to satisfy the demand Dependability /Reliability /Responsibility and the demand Multi-purpose workers and the demand Ability to learn new skills and behaviors) was ranked need more effort because it received 2 points out of five.
• The deployment of the approach of (Managing tasks and meeting deadlines to satisfy the demands of Inventory skills, Work with minimal supervision, and solve problems effectively and quickly, and Punctuality, and Ability to learn new skills and behaviors) was ranked difficult because it received 3 points out of five.
• The deployment of the approach of (Practice to be open to new
opportunities to learn to satisfy the demand Willingness to work) was ranked need more effort, because it received 2 points out of five.
• The deployment of the approach of (Understanding the need to learn new skills to satisfy the demands Multi-purpose workers and the demand of Ability to learn new skills and behaviors) was ranked need more effort, because it received two points in a scale of five.
• The deployment of the approach of (Problem solving activities to satisfy the demand of Solve problems effectively and quickly) was ranked need more effort, because it received two points out of five.
• The deployment of the approach of (Team activities to satisfy the demand of Teamwork Skills) was ranked easy, because it gets only one point in a scale of five.
• The deployment of the approach of (practicing responsibility roles to satisfy the demand of Strong Work Ethics) was ranked need more effort, because it received two points out of five.
doi:10.3926/jiem.2011.v4n2.p387-402 JIEM, 2011 – 4(2): 387-402 – Online ISSN: 2013-0953 Print ISSN: 2013-8423 • The deployment of the approach of (Holistic approaches to learning to
satisfy the demand of Ability to learn new skills and behaviors) was ranked easy, because it received one points out of five.
• The deployment of the approach of (Decision making activities to satisfy the demand of Work with minimal supervision received) was ranked easy, because it gets only one point in a scale of five.
• The deployment of the approach of (Simulation activities to satisfy the demand of Work with minimal supervision and the demand of CAD/CAM and the demand of Willingness to work) was ranked little difficult, because it received three points out of five.
• The deployment of the approach of (Time management activities to satisfy the demand of Work with minimal supervision and the demand of Solve problems effectively and quickly) was ranked need was more effort, because it received two points out of five.
• The deployment of the approach of (using IT skills to complete activities to satisfy the demand of Solve problems effectively and quickly) was ranked easy because it received one point out of five.
• The deployment of the approach of (Discussions making activities in the demand of work with minimal supervision) was ranked little difficult, because it received three points out of five.
• The deployment of the approach of (Practicing Administrative Monitoring to satisfy the demand of Strong Work Ethics) was ranked need more effort, because it received two points out of five.
5 Conclusion
doi:10.3926/jiem.2011.v4n2.p387-402 JIEM, 2011 – 4(2): 387-402 – Online ISSN: 2013-0953 Print ISSN: 2013-8423 Finding detailed skills required for future manpower for the labor market can reduces the potential gap between vocational training outcome and employers expectations. This paper has several important contributions:
1. It suggests a useful solution to the design of an academic framework, where all the expectations of the private sector can be satisfied.
2. It presents a methodology for analyzing the voice of customer (VOC) expectations, as a clear identification of customer expectations is an important factor in customer satisfaction.
3. It opens the door for future research in the area of vocational training and education to solve ongoing problems.
6 Further work
Further work is to extend the study of using the QFD method in all the programs these submitted by field of Vocational Training to compare between the Vocational Training Providers that provide the most manpower for the private sector of the labor market in Kuwait. Also, a suggested further work is to apply the QFD to enhance the quality of the performance of the instructors/trainers from the student’s perspective.
References
Besterfield, D. H., Besterfield, C., Besterfield, G. H., & Besterfield, M. (2003). Total quality management. New Jersey: Prentice Hall, Inc.
Franceschini, F., & Terzag, M., (1998). An Application of Quality Function Deployment to Industrial Training Courses. International journal of Quality & Reliability Management, 15(7), 753-768.
doi:10.1108/02656719810226924
Gonzalez, M.E., Quesada, G., Gourdin, K., & Hartley, M. (2008). Designing a supply chain management academic curriculum using QFD and benchmarking. USA Quality Assurance in Education, 16 (1), 36-60.
doi:10.3926/jiem.2011.v4n2.p387-402 JIEM, 2011 – 4(2): 387-402 – Online ISSN: 2013-0953 Print ISSN: 2013-8423 Hamza, R. M. A. , & Alrowaih, A. S. (2010). Enhancing Quality of Vocational
Outcome to satisfy the labor market demands in Kuwait by using Quality Function Deployment Method. M. Sc. thesis In Industrial Engineering & Management, College of Engineering, Gulf University.
Hoeckel, K., & Field, S. (2008). Learning for Jobs OECD Reviews of Vocational Education and Training. Retrieved February 10th, 2010 from http://www.oecd.org
Maguad, B. A. (2009). Using Quality Function Deployment to evaluate government services from the customer’s perspective. ASBBS Annual Conference: Las Vegas 16 (1). Retrieved from www.asbbs.org/files/2009/PDF/M/MaguadB.pdf
Manpower Government Reconstructing Program (MGRP) record, State of Kuwait. Retrieved January 2nd 2010 from http://www.mgrp.org.kw/UIEN/default.aspx
Mazur, G. E. (1994). QFD for Small Business. A Shortcut through the Maza of Matrices. Transactions from the Sixth Symposium on Quality Function Deployment Novi, Michigan. Retrieved from http://www.mazur.net/works/sme_qfd.pdf
Noonan, K., Bloom, R., Aschwanden, J., Bersin, A., Chan, Y., Fisher D., Green, R. E., Lopez, D., Nuñez, J., Williams, J., & Estep, A.(2007). Career Technical Education Framework for California Public Schools Edited by Ed O’Malley of CDE Press. Retrieved April 15th, 2010, from
http://www.cde.ca.gov/ci/ct/sf/documents/cteframework.pdf
Seyfried, E. (1998). Evaluation of Quality Aspects in Vocational Training Programs. Synthesis Report. Berlin: CEDEFOP. Retrieved from
www.cedefop.europa.eu/etv/Upload/Information.../15_en_seyfried.pdf
doi:10.3926/jiem.2011.v4n2.p387-402 JIEM, 2011 – 4(2): 387-402 – Online ISSN: 2013-0953 Print ISSN: 2013-8423
Journal of Industrial Engineering and Management, 2011 (www.jiem.org)
Article's contents are provided on a Attribution-Non Commercial 3.0 Creative commons license. Readers are allowed to copy, distribute and communicate article's contents, provided the author's and Journal of Industrial Engineering and Management's names are included. It must not be used for commercial purposes. To see the complete