JIEM, 2010 – 3(2): 353-369 – Online ISSN: 2013-0953
Print ISSN: 2013-8423
Greening elements in the distribution networks
Tihomir Opetuk
1, Ivan Zolo
1, Goran Dukic
2 1Koncar Distribution and Special transformers Inc. (CROATIA);
2
University of Zagreb, Faculty of Mechanical Engineering (CROATIA)
Received February 2010
Accepted October 2010
Abstract: Due to climate change and the increase in environmental awareness in the
world, the concept of Green Supply Chain Management appeared. The concept is aimed at
the reduction of several elements: energy, materials, the pollution and the waste in
production and logistics processes. Power networks are a part of a supply chain of
production and distribution of electrical energy, and similar principles of greening could be
applied. Currently, the losses within the distribution networks in the whole world are
between 3.7 to 26.7 % and they primarily occur due to the losses in the conductors and the
losses within distribution transformers. After an overview of the losses in the power
networks and related CO
2emission, some solution of how to reduce the above mentioned
losses are given. Such improvements, apart from the significant economic repercussions, in
the same time represent non-negligible greening element in the area of electrical energy
distribution.
Keywords: greening, power networks, CO2 emission
1 Introduction
JIEM, 2010 – 3(2): 353-369 – Online ISSN: 2013-0953
Print ISSN: 2013-8423
Ephraums, 1990). At the same time these emissions are also a limiting factor for the economical growth of some countries, especially those which are going through the transition process (Psomopoulos, Skoula, Karras, Chatzimpiros, & Chionidis, 2010; Contribution of Working Group III to the Third Assessment Report of the Intergovernmental Panel of Climate Change; Liu, 2007). One of the reasons for that is the Kyoto protocol, adopted in December 1997 at The Third Conference of Parties (COP-3) in Kyoto, at which the industrial world agreed to reduce the emissions of greenhouse gases approximately 6 to 8 % below 1990 levels by 2008–2012 (Contribution of Working Group III to the Third Assessment Report of the Intergovernmental Panel of Climate Change).
In the meantime, also due to the climate change and the increase in environmental awareness all over the world, the concept of Green Supply Chain Management appeared. It is often defined as integrating environmental thinking into supply chain management (Srivastara, 2007). Within that concept many greening elements aimed at the reduction of materials, energy, waste, pollution and emissions, or promoting the usage of recyclable materials and renewable energy sources are introduced in various segments of supply chains (Opetuk, Dukic, & Radic, 2009). Power networks are a part of the supply chain of production and distribution of electrical energy, and the principles of greening supply chains could also be applied. In the next chapter, an overview of the losses in the power networks of the EU and Croatia has been given, followed by a proposition of some possible technological improvements to reduce the losses, which represent at the same time the implementation of some important greening elements in this field.
2 Losses in power networks
JIEM, 2010 – 3(2): 353-369 – Online ISSN: 2013-0953
Print ISSN: 2013-8423
worldwide electricity savings potential is estimated to be to be at least 200 TWh (Belmans et al., 2005).
Figure 1 shows the loss components in the European power networks which consist of transmission and distribution networks. Losses in transformers account for 45 % of total losses, with 25 % are attributed to distribution transformers. Authors of this paper will present the ways how to reduce losses in that part of the network.
Figure 1. “Power transmission and distribution loss components in European Networks”. Source: Psomopoulos, Skoula, Karras, Chatzimpiros & Chionidis (2010).
2.1 Losses in Croatian power networks
According to the annual reports of the Croatian Electricity Company (HEP Group), the losses in the Croatian power networks are shown in Table 1.
Year
2002 2003 2004 2005 2006 2007 2008 The amount of power transport
in transmission network [GWh] 14831 15527 16095 16706.9 17178 17626 17996 Power losses in transmission
network [%] 4.51 4.25 3.65 3.35 3.17 3.10 2.69 Power losses in transmission
network [GWh] 669 660 586.7 560.4 544 547 484 The amount of power transport
in distribution networks [GWh] 14022 14737 15328.7 15942.4 16423.3 16810.7 16958.3 Power losses in distribution
networks [%] 10.03 12.78 10.68 9.85 8.31 9.83 7.21 Power losses in distribution
networks [GWh] 1406 1883 1637 1570 1365 1652 1223 Total transport power losses [%] 14.54 17.03 14.33 13.20 11.48 12.93 9.90 Total transport power losses
[GWh] 2075 2543 2224 2130 1909 2199 1707
JIEM, 2010 – 3(2): 353-369 – Online ISSN: 2013-0953
Print ISSN: 2013-8423
Authors of this paper estimate that the losses in distribution transformers are 330.77 GWh for 2008, using calculation tool in (Irrek, Topalis, Targosz, Rialhe, & Endesa 2008). That means that the power losses in distribution transformers make approximately 19.38 % of the total transport power losses, or 27.04 % of the losses within the transfer energy in distribution networks.
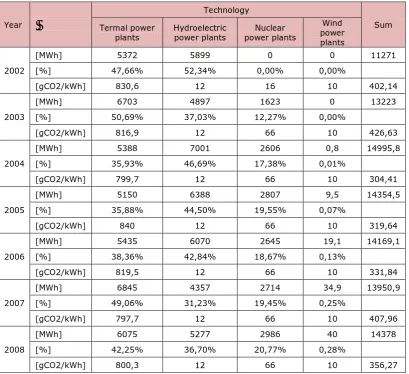
2.2 CO2 emission in Croatian energy production
The Croatian energy production is mainly based on 2 main types of power plants: thermal power plants and hydroelectric power plants, with 1601 MW installed power in thermal power plants and 2071.26 MW in hydroelectric power plants. Additionally, 348 MW (50 % of the total installed power) is in The Krsko Nuclear Power Plant which is a joint venture with Slovenia (Croatian Electric Power System). However, recently some small amount of energy is produced in wind power plants.
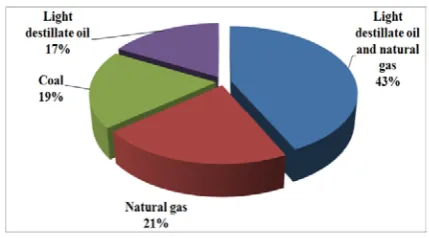
Fig. 2 shows the structure of fuel used in the thermal power plants. The amount of CO2 emission per kWh varies from year to year (from 304.41 gCO2/kWh to 426.63
gCO2/kWh), primarily due to the amount of energy generated in hydroelectric
power plant, as shown in Table 2. In 2008 emission was 356.27 gCO2/kWh, similar
to average emission of 361.65 gCO2/kWh for total produced energy in analyzed 7
years.
JIEM, 2010 – 3(2): 353-369 – Online ISSN: 2013-0953
Print ISSN: 2013-8423
Year
Technology
Sum Termal power
plants Hydroelectric power plants power plants Nuclear
Wind power plants
2002
[MWh] 5372 5899 0 0 11271
[%] 47,66% 52,34% 0,00% 0,00%
[gCO2/kWh] 830,6 12 16 10 402,14
2003
[MWh] 6703 4897 1623 0 13223
[%] 50,69% 37,03% 12,27% 0,00%
[gCO2/kWh] 816,9 12 66 10 426,63
2004
[MWh] 5388 7001 2606 0,8 14995,8
[%] 35,93% 46,69% 17,38% 0,01%
[gCO2/kWh] 799,7 12 66 10 304,41
2005
[MWh] 5150 6388 2807 9,5 14354,5
[%] 35,88% 44,50% 19,55% 0,07%
[gCO2/kWh] 840 12 66 10 319,64
2006
[MWh] 5435 6070 2645 19,1 14169,1
[%] 38,36% 42,84% 18,67% 0,13%
[gCO2/kWh] 819,5 12 66 10 331,84
2007
[MWh] 6845 4357 2714 34,9 13950,9
[%] 49,06% 31,23% 19,45% 0,25%
[gCO2/kWh] 797,7 12 66 10 407,96
2008
[MWh] 6075 5277 2986 40 14378
[%] 42,25% 36,70% 20,77% 0,28%
[gCO2/kWh] 800,3 12 66 10 356,27
Table 2. “CO2 emission in Croatian energy production”. Source: HEP d.d. annual reports;
Sovacool (2008)
3 Losses in transformers
There are two main components of the transformer losses: no-load losses and load losses. The third component is cooling loss, caused by power consumption of fan, therefore occurring only in transformers with fan cooling. The higher no-load and load losses, the more cooling is needed, which consequently creates higher cooling losses (Belmans et al., 2005).
3.1 No-load losses
No-load losses (P0), sometimes called core losses or iron losses are present
JIEM, 2010 – 3(2): 353-369 – Online ISSN: 2013-0953
Print ISSN: 2013-8423
with P0 = 2600 W are 22.8 MWh (2600 W x 8760 hrs). Over the period of 30 years,
it means energy loss of 684 MWh or total emission of 274 tones of CO2 (0.4 kg
CO2/kWh). These losses are mainly caused by hysteresis and eddy current in the
core, due to successively reversed magnetization (Belmans et al., 2005).
Eddy current losses are caused by varying magnetic fields inducing eddy currents in the laminations and thus generating heat. They usually account for 30 to 50 % of total no-load losses (Polish Cooper Promotion Center and European Copper Institute).
The amount of losses caused by eddy current is equal to:
m
t
fB
m
d
t
B
f
P
e m e m 22 2 2
)
(
65
,
1
σ
ρ
=
=
Equation 1. “The amount of losses caused by eddy current”. Source: Karsai, Kerényi, & Kiss (1987)
where:
o Pe is the eddy-current loss in W
o F is the frequency in Hz
o Bm is the peak value of the flux density in T
o t is the thickness of the individual steel lamination sheets in m
o ρ is the specific resistance of the sheet material in Ωm
o d is its density in kg m-3 and
o m is mass of the iron core in kg
JIEM, 2010 – 3(2): 353-369 – Online ISSN: 2013-0953
Print ISSN: 2013-8423
The amount of hysteresis losses is equal to:
,
m
fB
P
h=
σ
h mnEquation 2. “Amount of hysteresis losses”. Source: Karsai, Kerényi, & Kiss (1987)
where:
o Ph is the hysteresis loss in W
o f is the frequency in Hz
o Bm is the peak value of flux density in T
o n is the Steinmetz exponent
o m is the mass of the iron core in kg and
o the values of σh vary in the range of 3x10⁻³ to 20x10-3
About 1 % of total no-load losses are marginal stray and dielectric losses which occur in the transformer core (Polish Cooper Promotion Center and European Copper Institute).
3.2 Load losses
Load losses, sometimes called short circuit losses or copper losses, are caused by the resistive losses in the windings and leads. Load losses vary according to the transformer loading with the square of the load current (Belmans et al., 2005). They consist of two components: ohmic heat loss and conductor eddy current losses.
Ohmic heat loss or copper loss occurs in the transformer windings and is
caused by the resistance of the conductor. It varies with the square of the load current and is proportional to the resistance of the winding.
Conductor eddy current losses occur due to magnetic fields caused by
JIEM, 2010 – 3(2): 353-369 – Online ISSN: 2013-0953
Print ISSN: 2013-8423
3.3 Extra losses
These losses are caused by non-linear loads, such as power electronic devices, computers, UPS systems, TV sets. These devices cause harmonic currents on the network. They increase both load and no-load losses due to increased skin effect, eddy current and hysteresis losses. The most important and the biggest of these losses are the ones caused by eddy current losses in the winding. The transformer that is heavily loaded with harmonic currents can have a shorter life span and it can be damaged (Polish Cooper Promotion Center and European Copper Institute). Losses due to harmonics
Minimum losses occur when the rolling direction coincides with that of the flux lines. If these two directions differ then the increase of magnetizing power is very significant. Additional losses occur when the magnetic field is forced to pass from a larger cross-section through a more restricted area.
Losses resulting from the deviation of magnetic field from the direction of rolling (Karsai, Kerényi, & Kiss, 1987; Moses, 2003)
Additional losses occur due to inaccurately fitted joints, where the magnetic field becomes compressed towards the smaller air gap. Along the path following the larger air gap, the utilization of material is reduced. Air gaps at joints reduce the effective core permeability and causes localized variable flux distribution, which in turn increases the losses according to the gap length.
The passage of the magnetic field through the narrow interstices between the holes arranged behind one another is restricted and it causes additional losses in the core. Bolt holes cause additional losses of 1 to 3 % of the nominal value in regions around holes. These losses depend on holes diameter relative to sheet width.
JIEM, 2010 – 3(2): 353-369 – Online ISSN: 2013-0953
Print ISSN: 2013-8423
The various processing and mounting methods used in transformer factories lead to additional losses and growth of no-load losses. Here are some of the losses resulting from manufacturing.
Losses due to mechanical processing of sheets
During these processes, the sheets suffer deformations near cut or punched edges. Consequently, mechanical stresses arise in the material, which cause the magnetic permeability of the affected section to drop. These deformations cause the divertion of flux lines and the increase in losses. The fineness of processing determines the width of the strip where deformation is brought about by cutting or punching tools. The finer the processing, the narrower is the strip within which the magnetic properties are affected. The width of sheets influences the additional losses incurred by mechanical processing. The deformation strip affects by a lower percentage the losses in wider sheets than in the narrower ones.
Losses due to cutting and punching
During transport and reloading, because of careless handling, the sheets may be bent through radii below 300 mm.
Losses due to transport and reloading
Injured sheet insulation within the core increases the losses caused by eddy currents.
Losses due to defective insulation
4 Solutions for reducing losses in transformers production
New technologies and improved processes in production of transformers could greatly reduce power losses and the unnecessary CO2 emission in the electricity distribution. Having in mind the positive green effect on total supply chain of electrical energy, they could be presented as the greening elements in transformers production as well.
JIEM, 2010 – 3(2): 353-369 – Online ISSN: 2013-0953
Print ISSN: 2013-8423
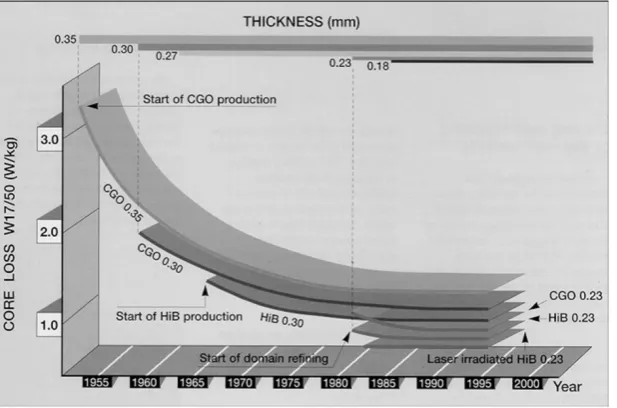
to application of gradually improved better grades of non-oriented steel, cutting technology and decreasing laminations thickness. During the last fifty years the improving technology of the transformer sheets rolling, with techniques to refine the domains of the iron crystals, proper cut, fabrication and assembling techniques reduced unit losses from 3 W/kg to less than 1 W/kg in traditional technologies (Irrek, Topalis, Targosz, Rialhe & Endesa, 2008).
Figure 3. “Core loss evolution”. Source: De Keulenaer (2002)
Development in the core loss reduction during the last 50 years is illustrated in Figure 3. There are no amorphous cores on the chart. Their losses amount, approximately, to 0.25 W/kg.
Reducing the no-load losses is mainly done by enlarging the core and by changing the steel type of the core, but it has impact on the weight and size of the transformer. An Amorphous transformer core is 50 % bigger (Belmans et al., 2005).
JIEM, 2010 – 3(2): 353-369 – Online ISSN: 2013-0953
Print ISSN: 2013-8423
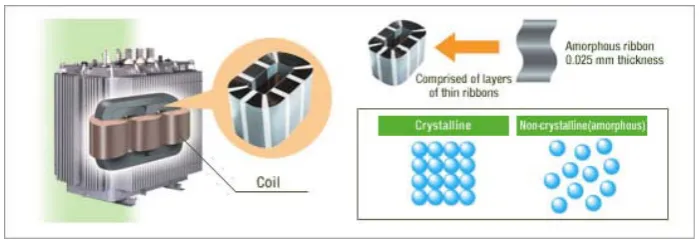
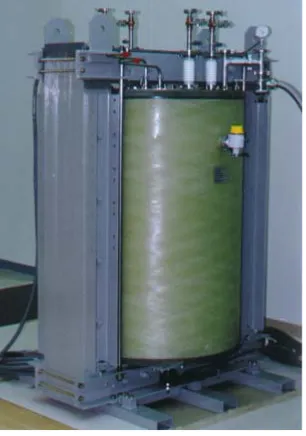
4.1 Amorphous cores
A relatively new technology which is widely used in Japan and in a smaller scale in North America uses amorphous cores, as illustrated in Figure 4. Using amorphous metal core, no-load losses can be reduced by additional 70 to 80 % compared to the best silicon steel reaching levels of 0.065 W/kg (Irrek, Topalis, Targosz, Rialhe, & Endesa 2008). Amorphous alloys do not have a crystal structure unlike ordinary alloys and amorphous metal cores are suitable for power networks with high frequency harmonics, which occur due to dramatic increase in the use of power electronics and lead to increased transformer core losses, especially in distribution transformers that use conventional steel core materials. It has low loss performance under higher frequencies (Targosz & Topalis, 2008). Comparison of amorphous versus conventional cores is given in the Table 3.
Figure 4. “Amorphous core transformer”. Source: Amorphous Core Transformers
JIEM, 2010 – 3(2): 353-369 – Online ISSN: 2013-0953
Print ISSN: 2013-8423
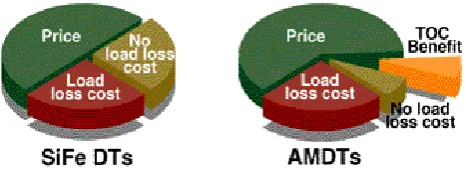
Figure 5. “Advantages of amorphous transformers”. Source: Targosz & Topalis (2008)
Loss (W) Amorphous Metal Silicon Steel
Hysteresis 99 155
Eddy Current 33 311
Total Core loss 132 466
Coil Loss 966 1084
Loading Level (%) 55 58
Total transformer Loss 1098 1550
Table 3. “Comparison of loss of amorphous versus conventional cores”. Source: Targosz, & Topalis (2008)
4.2 Superconducting transformers
JIEM, 2010 – 3(2): 353-369 – Online ISSN: 2013-0953
Print ISSN: 2013-8423
Figure 6, along with some design parameters and pros and cons given in Tables 4 and 5 (Irrek, Topalis, Targosz, Rialhe & Endesa 2008; Targosz, & Topalis, 2008).
Figure 6. “Fuji/SEC/Kyushu University HTS transformer unit”. Source: HTS transformer development in Japan
Capacity 500 kVA
Frequency 60 Hz
Voltage (primary/secondary) 6600 V/ 3300 V Current (primary/secondary) 76 A / 152 A Core
Height/width Cross sectional area Magnetic induction
Silicon steel plate 1580 mm / 1100 mm 986 cm2
1.7 T
Winding diameter (primary / secondary) 465, 553 / 509, 597
Winding height 748 mm
Secondary load 500 kVA inductive coil
Table 4. “HTS Transformer design parameters”. Source: HTS transformer development in Japan
PROS CONS
Oil free, (liquid nitrogen) 20 % lower weight
50 % lower load losses compared to Ak level, operational efficiency 99.3
% - 99.5 %
Slightly smaller volume
Short circuit reactance 50% of conventional 25% overloading without accelerated ageing Lower lifecycle cost
150 % - 200 % of the price of traditional transformer Additional maintenance cost Installation site (extra requirements)
JIEM, 2010 – 3(2): 353-369 – Online ISSN: 2013-0953
Print ISSN: 2013-8423
4.3 Hexagonal core design
The usage of the hexagonal core designs, as illustrated in Figure 7, can also decrease total losses of transformer. Compared with conventional designs, by using the hexagonal core designs, no-load losses can be reduced by up to 50 %, total operating costs can be reduced by up to 50 % as well, the weight can be reduced by up to 30 5, the volume can be reduced by up to 40 %.
Figure 7. “Design of hexagonal transformer”. Source: Hexaformer
5 Conclusion
This paper presents preliminary research on the topic of how to reduce losses within the electrical distribution network. If Croatia decides to use more efficient transformers, distribution transformers in class A0 and Ak (according to EN
50464-1:2007) and power transformers, whose losses are lower by 10 % (losses can be reduced by up to 20 %), losses in the distribution network could be reduced by 77.22 GWh, or to the value of 253.54 GWh. Furthermore, losses can be also reduced if the analysis included transformers which belong to the transmission network. As can be seen from the given data of CO2/kWh emission for 2008 year,
CO2 emissions could be reduced for 27511.17 tones. Apart from the reduction of
the emissions, the usage of high efficiency transformers would also enable the development of production. This is so because, according to Kyoto Protocol, each country has agreed to reduce CO2 emissions, which, in turn, could slow the
JIEM, 2010 – 3(2): 353-369 – Online ISSN: 2013-0953
Print ISSN: 2013-8423
is a 20-40 years. It follows that the decades will be needed to reach a specified reduction.
The above mentioned methods are greening elements in the production of transformers, and as such can be used as the guidelines for the reduction of power losses, which would result in reduction of CO2 emissions in distribution networks.
Many initiatives and projects aimed at the reduction of emissions have been undertaken all over the world. Therefore, this paper indicates the possible application of these techniques in Croatia. According to a study by Leonardo Energy Transformers, investment for high efficiency transformers can be repaid in a period of 1-7 years depending on the price of electricity (Opetuk, Dukic & Radic, 2009). Furthermore, as mentioned earlier, this is a preliminary study on this subject and further research should include an economic analysis of the cost effectiveness of the usage of more efficient transformers in Croatia.
References
Amorphous Core Transformers. Retrieved March 15, 2010, from
Belmans, R., Declercq, J., De Keulenaer, H., Furuya, K., Karmarkar, M., Martinez, M., McDermott, M. & Pinkiewicz, I (2005, February). The Potential for Global Energy Savings from High Efficiency Distribution Transformers. Leonardo Energy Transformers.
De Keulenaer, H. (2002, August). Energy saving opportunities for transformers, Energy efficient motors & transformers. Workshop, Navan.
Energy institute Hrvoje Požar (2007). Croatian Electric Power System. Retrieved
March 20, 2010, from
HEP d.d. annual reports (2002-2008). Retrieved March 22, 2010, from
HEP ODS d.o.o. annual reports (2002-2008). Retrieved March 22, 2010, from
JIEM, 2010 – 3(2): 353-369 – Online ISSN: 2013-0953
Print ISSN: 2013-8423
HEP OPS d.o.o. annual reports (2002-2008). Retrieved March 22, 2010, from
Hexaformer. Retrieved March 10th, 2010, from
Houghton, J. T., Jenkins G. J., & Ephraums J. J. (1990). Climate change, the IPCC scientific assessment. UK: Cambridge University Press.
HTS transformer development in Japan, Retrieved March 10, 2010, from
IPCC Climate change 2001: mitigation (2001). Contribution of Working Group III to the Third Assessment Report of the Intergovernmental Panel of Climate Change. UK: Cambridge University Press.
Irrek W. Topalis, F.,Targosz, R. Rialhe. A., & Endesa J. F. (2008, June). Policies and Measures Fostering Energy-Efficient Distribution Transformers. Report from the EU-IEE project Strategies for development and diffusion of Energy Efficient Distribution Transformers-SEEDT. Retrieved March 17, 2010, from
Karsai, K., Kerényi, D., & Kiss, L. (1987). Large Power Transformers. UK: Elsevier Publishing Company.
Liu, C. C. (2007, June). An extended method for key factors in reducing CO2 emissions. Applied Mathematics and Computation, 189(1), 440–451.
Moses, A.J. (2003, January). Prediction of core losses of three phase transformers from estimation of the components contibuting to the building factor. Journal of Magnetism and Magnetic Materials, 254, 615-617.
Opetuk, T., Dukic, G., & Radic, I. (2009, June). Green SCM: Overview of concept and practical examples. Proceedings of MOTSP 2009, Sibenik, Croatia, 300-306.
JIEM, 2010 – 3(2): 353-369 – Online ISSN: 2013-0953
Print ISSN: 2013-8423
diffusion of Energy Efficient Distribution Transformers-SEEDT. Retrieved March 17, 2010, from
Psomopoulos, C. S., Skoula, I., Karras C., Chatzimpiros A., & Chionidis, M. (2010, January). Electricity savings and CO2 emissions reduction in buildings sector: How important the network losses are in the calculation?. Energy, 35(1), 485-490.
Sovacool B. K. (2008, August). Valuing the greenhouse gas emissions from nuclear power: A critical survey. Energy Policy, 36 (8), 2950-2963.
Srivastara S. K., (2007, February). Green Supply-Chain Management: A State-of-The-Art Literature Review. International Journal of Management Reviews, 9(1), 53-80.
Targosz, R., & Topalis, F. (2008, July). Analysis of existing situation of energy efficient transformers – technical and non-technical solutions. Report from the EU-IEE project Strategies for development and diffusion of Energy Efficient Distribution Transformers-SEEDT. Retrieved March 17, 2010, from
©© Journal of Industrial Engineering and Management, 2010
Article's contents are provided on a Attribution-Non Commercial 3.0 Creative commons license. Readers are allowed to copy, distribute and communicate article's contents, provided the author's and Journal of Industrial Engineering and Management's names are included. It must not be used for commercial purposes. To see the complete