Issues
ISSN: 2146-4138
available at http: www.econjournals.com
International Journal of Economics and Financial Issues, 2016, 6(S1) PB-1.
Special Issue for “Theory and Practice of Organizational and Economic Problems of Territorial Development and the Effectiveness of Social and Economic Systems”
Issues
ISSN: 2146-4138
available at http: www.econjournals.com
International Journal of Economics and Financial Issues, 2016, 6(S1) 107-113.
Special Issue for “Theory and Practice of Organizational and Economic Problems of Territorial Development and the Effectiveness of Social and Economic Systems”
On the Impact of Innovations on the Social Structure
Sergey Dmitriev
1, Valentina Kalinicheva
2, Elena Shadoba
3, Olesya Nikonets
4, Dina Pogonysheva
5*,
Elena Shvarova
61Plekhanov Russian University of Economics (Bryansk Branch), Bryansk, Russian Federation, 2Plekhanov Russian University
of Economics (Bryansk Branch), Bryansk, Russian Federation, 3Moscow Psycho-social University in Bryansk, Bryansk, Russian
Federation, 4Bryansk State University Named after Academician I.G. Petrovsky, Bryansk, Russian Federation, 5Bryansk State
University Named after Academician I.G. Petrovsky, Bryansk, Russian Federation, 6Bryansk State Engineering and Technological
University, Bryansk, Russian Federation. *Email: [email protected]
ABSTRACT
The paper investigates the problem, which does not attract much attention of economics and sociology researchers, concerning the impact of revolutionary technological and other innovations on the transformation of the social structure of modern states. The innovations, which are considered by most researchers as a driver for economic growth, cause significant changes. Some of these changes are negative. One of these negative consequences of innovative development is the middle class reduction in the social structure. The USA statistics over the last 50 years are a reliable source of information for this statement formulation. At the same time, not only developed countries but also developing ones face this trend. As the example, the paper presents the experience of such country as Ghana. Also the paper discusses the problem concerning the growth of unemployment as a result of the implementation of technological innovations into production. As shown below, contrary to expectations the fourth industrial revolution will create fewer jobs than they were in the past and will also have an impact on the social structure.
Keywords: Innovation, Economic Growth, Inequality, Middle Class, Social Structure, The Fourth Industrial Revolution JEL Classifications: O1, O40, L00
1. INTRODUCTION
In the scientific literature and in the mass consciousness
innovations are almost exclusively connected with those improvements which they make in daily life and economic entities’ activity. Much less attention is paid to the negative consequences of innovations, which, for example, cause job cuts and, consequently, structural unemployment. Even fewer publications are devoted to totally unheralded consequence of the implementation of innovations, namely, to the middle class reduction in the social structure of modern developed countries. In this regard, the fourth industrial revolution, which is right in front of your eyes, does not instill optimism because, as the paper shows below, the mentioned trend would continue in the future.
As it was noted above, not so many publications are devoted to the problem concerning the middle class reduction as a result of the implementation of innovations, and also to economic growth. But this problem demands special attention. Our previous paper (Dmitriev et al., 2016) has already analyzed this range of problems. That is why this paper is in some specified sense the continuance and development of the previously mentioned ideas.
In addition to this paper, the problems of the middle class dynamics in modern society are analyzed in the following references (Schwab, 2016, Thomson, 2016, The Middle Class Compression in the USA and the Answer to this Fact: Much Socialism).
It should be noted that almost all these publications do not connect the middle class reduction with the innovative development. This paper is an attempt to fill this gap.
1.1. Inequality through History
Speaking “through history,” we, first of all, mean the period after the Second World War. As the Oxfam recent study says, that inequality over the last years has reached its maximal level, significantly preceding the previous levels. Although, it is still inferior to the wealth of the Roman emperor Augustus (equivalent to 4.6 trillion US dollars, that at that time was equal to one-fifth of the wealth of the Roman Empire) and the legendary King of Timbuktu Mansa Musa, having ruled from 1280 to 1337, who, as an American news magazine Time says, was “Richer than anyone else could describe” (Figure 1).
If the largest economics of the world (the USA) would be considered, inequality in that country would also increase: For example, during the Obama era the number of recipients of food stamps has increased from 27 million to almost 50 million. As the Department of Agriculture estimates supervising. “The Federal Supplemental Nutritional Assistance Program” (SNAP), every 5 US dollars of expenses from the amounts of these benefits in cash turn into 9.2 US dollars at the level of the global economy. Food stamps’ money is debited with the purchase of foodstuffs. Retailers and sellers give pay employees and suppliers who, in turn, continue to spend these sums of money in shops, make utility payments, and so on. Such government recycled funds increase the amount of consumer expenditures, the share of which in the structure of the US economics is about 70%. Budget expenditures for the SNAP correspond to about 60 billion US dollars per year (the median monthly amount of board wages is about $ 120 per person).
Increasing social expenditures during the Barack Obama era are multifaceted: They are not only food stamps but also health insurance for the poor, unemployment pays, social housing, tax deductions for the poor. Figure 2 shows that in 2010 66.1% of the USA federal budget expenditures were welfare benefits (during the Ronald Reagan era - 46%).
Increasing social expenditures means the reduction of able-bodied citizens, first of all, of income taxpayer in the social structure of the USA. In order to be considered as poor and not pay income tax, American household with 4 members (two able-bodied persons and two children) must have income less than 45 thousand
US dollars per year. The following graph shows that 41% of American households either do not pay income tax or have the negative balance (for example, families with many children whom the state pays in addition). Let’s note that during the Ronald Reagan era this figure was 18% (Figure 3).
Moreover, the income disparity between families with growing children and incomplete families and the median value increases. There are no prizes for guessing that the disparity is in disfavor of the former. The family income polarization also leads to the middle class erosion in the coming years (Growing Income Gap among US Families Suggests Increasing Economic Insecurity). The study shows the growth in incomes, first of all, in those families with parents who have higher education. At the same time, geographical inequality in education has also increased over the last 30 years (Wealely).
It is especially sad that the middle class, being the basis of the previous USA economic stability, rapidly decreases. So, from
Figure 2: Total USA government expenditures for the period from
1952 to 2011 and forecasting to 2017 (The Middle Class Compression in the USA and the Answer to this Fact: Much Socialism)
Figure 1: Wealth of richest 62 people of the world (from Forbes) and
the wealth of bottom 50% (9)
Figure 3: Number of income taxpayers in the USA in the period from
1970 to 2010 its value has changed from 50.3% to 42.2% of households (Figure 4).
As the recent Cornell-Stanford study shows, in 2010 the number of poor households in the USA has doubled in comparison with 1970. Thus, such sectors of economy, which suffer a blow, face greater income inequality. The middle class reduction is especially observable (High-income Americans more Segregated than Ever). At the same time, the Illinois State University study shows that rural areas of the USA are richer than they are normally expected to be, especially in Midwestern regions (Rural America more prosperous than expected).
Let’s pay our attention that the middle class structure has also changed over the same period of time: So, German economist Olaf Gersemann in his book “Cowboy Capitalism” notes that in 1972 the bulk of income in households (on average) accrue to the husband salary. “In the 1970s, families with working parents were rare. Today, they are ordinary,” - He writes (the share of families where a woman works, from 1982 to 2002 has increased from 60% to 72%, to 2010 it has increased up to 74%). Namely, in fact, if we take income per worker in the family, the level of middle-class wages (according to the purchase power parity) even from 1982 to 2002 has decreased by at least 15% (Gersemann, 2006).
Thus, median family holdings of the middle class debt have increased to 70.7 thousand US dollars (in 1989 the debt was 25.3 thousand US dollars.). If to consider the “additional charges,” than the current number of the middle class representatives should be also revised to the downside (Figure 5).
Means of the typical household in the USA have increased to 57 thousand US dollars in 2010 as compared to 73 thousand US dollars in 1983. If the status of all households in the USA grows the same, the average level would increase to 119 thousand US dollars. The elite (1% Americans) have achieved the average growth of its wealth to 16.4 million US dollar as compared to 9.6 million US dollars in 1983. This growth was much caused by the systematic income transfer from the poor to the rich. The Nobel laureate Joseph Stiglitz in his book “The Price of Inequality” (Johnson and Fritjof, 2016) has shown this transfer in detail.
It is a paradox, but growing inequality makes the wealthiest and the poorest part of the population more conservative. Kelly’s (University of Tennessee, Knoxville) and Enns’s (Cornell University) papers, based on the study of the outcomes of surveys of the hundreds of thousands of respondents from 1952 to 2006, were published in the October edition of the American Journal of Political Science in 2010. The outcomes of their analysis are frustrating, both the richest and the poorest respondents have revealed decreasing support of such state-run programs as charity and welfare payments to the poor. Thus, the authors of the study make a conclusion that inequality is a self-sustaining phenomenon (UT Professor finds Economic Inequality is Self-reinforcing).
Baten and Mumme from Eberhard Karls University in Tübingen, giving the countries of Africa and Latin America as the examples (Karl, 2014), claim that if this trend would exist in the future, than
there would be increasing risk of Civil War. Their conclusion is greatly reasonable. The fourth industrial revolution has given rise to much disappointment than created new opportunities that has caused the further social stratification (Blanke and Kaspersen, 2016).
Thus, it is not surprising that the “Communist Manifesto” of Marx is one of the most widely read books in Ivy League universities, and in 6 states this book is the most popular in university libraries (Ingraham, 2016).
1.2. Income Distribution Inequality over the Last Years in both Developed and Developing Countries
Once again the problem of inequality became one of the most discussed mostly thanks to Piketty’s research with his famous r > g (Pink, 2001). At the recent Economic Forum in Davos there were a lot of reports, which have analyzed the problem of inequality in economic, gender, racial and other aspects, presented. We do not mention the analysis of the causes of this phenomenon (we have already done it [Dmitriev et al., 2016]), we repeat that increased incomes caused by economic growth are highly skewed. As the work outcomes of researchers from the National Bureau of Economic Research, inequality in the distribution of wealth in the USA is close to its record levels, because over the last 30 years the share of household income related to 0.1% of the richest segments of the people, has increased from 7% to 22% (Saez and Zuchman, 2014), almost reaching the values recorded before the great war (Figure 6).
Figure 4: Percent of households with incomes lower the
median, % (37)
Figure 5: Median US family holdings of debt for the period from 1989
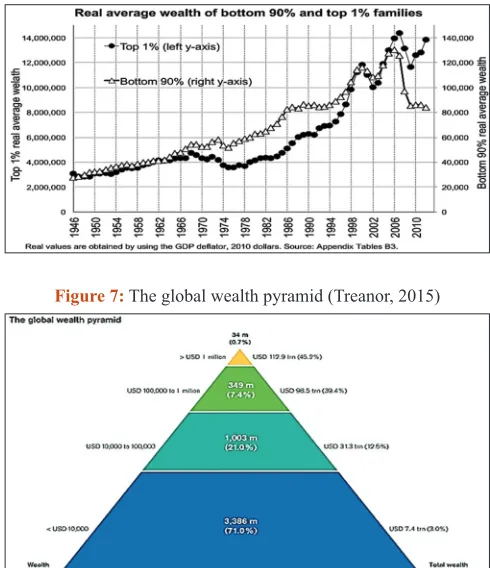
In turn, the fraction of income of bottom 90% has been steadily decreasing in consequence of the influence of a combination of accruing debts, the depreciation in consequence of the global crisis of financial assets, which they have, and the low growth of real wages. The average wealth of mentioned bottom 90% in 2012 was 80,000 US dollars, the same as in 1986, while the average wealth of top 1% from 1980 to 2012 has increased more than 3 times.
Not only the United States face this inequality but also other countries of the Group of 20. So, for example, in 1980 in Australia the share of top 1% households accrued to 4.8% of national income and in 2010 this share accrued to more than 9%. Over the period when Australia chaired the Group of 20 (from 2013 to 2014.) the total wealth of countries of the Group of 20 has increased by 17 trillion US dollars. At the same time, the share of top 1% households accrued to 6.2 trillion US dollars, namely, 36% of the total growth (Monaghan, 2014).
At the last year’s Economic Forum in Davos, researchers from the Oxfam International confederation have made the report presenting that 85 wealthiest people around the globe have the same wealth as 50% (namely, 3.5 billion people) of the poorest ones. The comparison becomes even more impressive when you consider that in 2010 the number of the wealthiest people, having the same wealth, was 388 people.
Scientists from the Oxfam International confederation have made a conclusion that the current trend will lead to the fact that in 2016 top 1% households will have more than 50% of the global wealth (Pilkington, 2015).
Figure 7 shows so-called “The global wealth pyramid” made according the outcomes of the Oxfam International study.
Having such resources, the richest part of the people has the fullest opportunity to preserve the current status quo by using its achievements for changing “the rules of the game” for its own benefit, for example, by using government relations. As the Nobel laureate of 2015 in economics Angus Deaton says, these achievements should not be proud of (Deaton, 2013). Deaton, by the way, notes a paradox of inequality: “Inequality is often a consequence of the progress. All people right away cannot be rich., In its turn, inequality can influence the progress” (Deaton).
Moreover, the slow growth of the middle class incomes that keeps down pick-up in buying interest is a negative symptom. The data of experts from the Credit Suisse Research Institute prove this fact (Pilkington, 2015).
Not only developed countries are characterized by the above-mentioned tendency to income inequality. An example of African countries is the proof for the thesis (excluding South Africa). On one hand, the skyscrapers of Accra and the capitals of Ghana show the maturity of construction industry, and American entrepreneurs, studying stock exchange quotations over a cup of tea, are members of its financial center. On the other hand, according to The Pew Research Centre sources, only 6% Africans can be referred to the middle class (in Africa they are individuals
who earn from 10 US dollars to 20 US dollars per day, while 74% people lives on only 74 cents per day), and their number grows in modest manner. The EIU Canback consulting company researches (a partner of The Economist quality magazine) have caught only the modest growth rate of the “middle class”) from 4.4% to 6.2% over the period from 2004 to 2014, the growth of “the upper middle class” (from 20 US dollars to 50 US dollars per day) over the same period was only 0.9% (from 1.4% to 2.3%) (Few and far between).
The Figure 8 shows the growth of inequality in the income distribution between African countries and within countries.
Over the period from 1993 to 2008 in Africa the consumption has in general increased by 15% (namely, by 0.92% per year), but this growth was highly skewed among African countries. The Gini index has increased from 52 to 56% and income difference between the countries of Africa has increased from 27% to 40%
Figure 6: Average wealth of bottom 90% (the right vertical scale) and
top 1% families (the left vertical scale) (Saez and Zuchman, 2014)
Figure 7: The global wealth pyramid (Treanor, 2015)
Figure 8: Increasing inequality in Africa over the period from 1993 to
over the same period. As a result, Africa has the highest level of regional income inequality (Lakner, 2016).
At the last, ten richest Africans have the same wealth (62 billion US dollars), as well as the poorest half of the people of the whole African continent (Figure 9).
The most remarkable is the fact that the modest growth of the middle class was coming against the background of annual economic growth by 5% which almost twice faster the population growth (few and far between).
The Figure 10 shows that the countries with high level of income differentiation refer to the most innovative countries.
The suggestion that the United States, Switzerland and other countries, which take the lead of the index, take this place as a result of its economic prosperity (Murphy, 2016), as well as the conclusion of the author quoted, which is the paper head, is quite logical.
1.3. Impact of Technological Innovations on the Social Structure
The paper introduction has mentioned the negative consequences of innovations, and one of them is unemployment. Indeed, the
displacement of human labor by automated systems is appreciated by all people except those, who were members of this human labor, as there were new jobs with considerable time delay created and, as a rule, in other industries. That, in its turn, requires time and other resources expenditures for retraining, relocation, and so on, that also enhances the negative consequences of innovative development.
Detroit, the center of the automotive industry of the USA and Silicon Valley is the example. In 1990 in Detroit the total market capitalization of three largest companies was 36 billion US dollars, operating revenue was 250 billion US dollars, and the number of employees was 1.2 million people. In 2014, the market capitalization of three largest companies in Silicon Valley was 1.09 trillion US dollars, operating revenue was 247 billion US dollars, but the number of their workers was almost 10 times less - 137 000 people (Manyika and Chui, 2014).
According to ‘The Future of Jobs” report, which was prepared by specialists of the World Economic Forum, the survey outcomes have showed that the fourth industrial revolution leads to the fact that only over the period from 2015 to 2020 about 7.1 million jobs disappear (The Future of Jobs, 2016).
The works of Frey and Osborne have considered the relationship between innovations and unemployment in detail (Benedikt and Osborne).
It should be also noted that the fourth industrial revolution
creates fewer new jobs in new sectors than the previous three industrial revolutions. According to the research of the Oxford Martin Programme on Technology and Employment, only 0.5% US economics workers are employed in sectors which have not even exist at the turn of the 20th and 21st centuries. This is
much lower the level by almost 8% new jobs created in new sectors during the 80s of the 20th century, as well as 4.5% new
jobs created during the 1990s. This proves that information and revolutionary technological innovations increase productivity, displacing workmen, and in a lesser degree create new jobs (Schwab, 2016). All previous industrial revolutions have created the similar problems concerning technological changes. However, it is difficult to find effective solutions for preserving the middle class during the fourth industrial revolution (Thomson, 2016).
Moreover, it should be remembered that, speaking about the outcomes of innovations, the distribution of income should be considered. All people are pleasured by using mobile phones, but the shareholders of Apple, Samsung and Nokia are real beneficiaries. Most of people remain poor, and the present trend proves the fact that technological innovations enhance the society stratification (Hawking, 2015).
As a result, the beneficiaries of the Fourth Industrial Revolution are those who invest there their intellectual or physical capital, They are innovators, investors and shareholders, that explains the increasing gap between those, who rely on their labor, and those, who have their own capital. This fact disabuses those, who hope
Figure 9: Number of individuals who are much wealthier than the
poorest part of the people (Lakner)
that their children will live better than they did, of the notion (Schwab, 2016).
In our opinion, the middle class reduction of and the whole social structure change of developed countries are connected with the fact that the dominant paradigm of labor becomes the model when the company and the employee are connected by a series of transaction rather than stable relationships (Bussemer, 2016, Pink, 2001). Radical innovations, emergence of on-demand and human cloud economics greatly accelerate this trend.
Besides, this leads to the fact that in these cases there are almost no traditional relationships between an employer and employee, and therefore, there are some difficulties with the normative regulation of labor relationships and making statistical observations (Piketty, 2014). As a result, the middle class will be reduced by a “statistical” method.
By the way, the statistics problems with fixing the consequences of the introduction of revolutionary innovations over the last years become the subject which demands special attention. If the increasingly global aspect of the problems will be taken into account, then the use of proven economic indicators, such as the gross domestic product (GDP) is placed in question (Costanza et al., Why GDP is so difficult to measure).
Finally, nowadays a profession, which the middle class practices, does not mean a lifestyle (education, medical and pension maintenance, householding), which the middle class leads. In the USA and the United Kingdom education is a king of luxury because of its cost. Modern market economics, with its slogan claiming that “to the victor go the spoils” is lowly available to representatives of the middle class, causing social tensions and other problems (Schwab, 2016).
Of course, as the paper has shown, the trend seems to be frustrating. We believe this is not because of the fact that economics, as Sahlins (Sahlins, 1999) said, is “dismal science.” The problem is that the social change is always delayed in relation to technological changes, and in the near future this gap will not decrease.
2. DISCUSSION OF THE RESEARCH
OUTCOMES AND CONCLUSION
Thus, the research has made a conclusion that different rates of economic growth caused by development disparity of innovations, access to good education and so on have brought about income inequality between countries and social strata within countries. Accelerating of innovative development and the fourth industrial revolution feed specified inequality. One of the negative outcomes of radical technological and other innovations is the structural change of society, in particular, the reduction of the middle class share in this structure. As exactly the middle class is considered to be the basis for social stability, sustained development and, at the last, economic growth, this social structure transformation will carry far-reaching negative consequences.
However, the scope of this paper has not allow to analyze income disparity within the middle class, which is not close-knit. The further researches will consider this issue.
REFERENCES
Benedikt, F.C., Osborne, M. With Contributions from Citi Research. Technology at Work The Future of Innovation and Employment. Oxford Martin School and Citi. Available from: http://www. oxfordmartin.ox.ac.uk/downloads/reports/Citi_GPS_Technology_ Work.pdf.
Blanke, J., Kaspersen, A. (2016), Why equity matters more than you might think. Available from: http://www.weforum.org/ agenda/2016/02/why-equality-matters-more-than-you-might-think?utm_content=bufferff413&utm_medium=social&utm_ source=facebook.com&utm_campaign=buffer.
Bussemer, T., Christian, K., Henning, M. (2016), Social Democratic Values in the Digital Society. Challenges of the Fourth Industrial Revolution. Social Europe Occasional Papers, 10.
Costanza, R., Kubiszewski, I., Giovannini, E., Lovins, H., McGlade, J., Pickett, K.E., Ragnarsdóttir, K., Roberts, D., De Vogli, R., Wilkinson, R. (2014), Time to leave GDP behind. Available from: http://www.nature.com/polopoly_fs/1.14499!/menu/main/ topColumns/topLeftColumn/pdf/505283a.pdf.
Deaton, A. (2013), Unwinding inequality. Harvard Business Review. Available from: https://www.hbr.org/2013/12/unwinding-inequality. Deaton, A. What this Book is about. Available from: https://www.press.
princeton.edu/chapters/i10054.pdf.
Dmitriev, S., Drigo, M., Kalinicheva, V., Shadoba, E., Ozherelieva, M., Matyushkina, I. (2016), Innovation, economic growth and inequality. International Review of Management and Marketing, 6(S1), 316-321. Few and far between. Available from: http://www.economist.com/news/ middle-east-and-africa/21676774-africans-are-mainly-rich-or-poor-not-middle-class-should-worry?frsc=dg%7Cd.
Gersemann, O. (2006), Cowboy Capitalism: European Myths and American Reality. Moscow: IRISEN. p270.
Growing Income Gap Among US Families Suggests Increasing Economic Insecurity. Available from: http://www.phys.org/news/2008-12-income-gap-families-economic-insecurity.html.
Hawking, S. (2015), Technology seems to drive inequality. Available from: https://www.weforum.org/agenda/2015/10/stephen-hawking-technology-seems-to-drive-ever-increasing-inequality/.
High-income Americans More Segregated Than Ever. Available from: http://www.phys.org/news/2013-10-high-income-americans-segregated.html.
Ingraham, C. (2016), What Ivy League Students Are Reading That You Aren’t. Available from: https://www.washingtonpost.com/news/ wonk/wp/2016/02/03/what-ivy-league-students-are-reading-that-you-arent/.
Johnson, E.M., Fritjof, C. (2016), Why economists don’t know how to think about growth. An interview with Fritjof Capra. Available from: http://www.evonomics.com/why-economists-dont-know-how-to-think-about-growth/?utm_ source=Evonomics+Newsletter&utm_campaign=73d69299d0-F e b r u a r y _ 7 _ 2 0 1 6 & u t m _ m e d i u m = e m a i l & u t m _ term=0_6135d6253e-73d69299d0-317265733.
Karl, E. (2014), Rich-poor gap and the risk of civil war. Available from: http://www.phys.org/news/2014-06-rich-poor-gap-civil-war.html. [Last accessed on 2016 Feb 08].
weforum.org/agenda/2016/02/is-inequality-in-africa-rising?utm_ content=buffer0bad1&utm_medium=social&utm_source=facebook. com&utm_campaign=buffer.
Manyik, J., Chui, M. (2014), Digital Era Brings Hyperscale Challenges. The Financial Times.
Monaghan, A. (2014), US wealth inequality - Top 0.1% worth as much as the bottom 90%. http://www.theguardian.com/business/2014/nov/13/ us-wealth-inequality-top-01-worth-as-much-as-the-bottom-90. Murphy, T. (2016), It’s not possible to innovate people out of poverty.
Available from: http://www.humanosphere.org/basics/2016/01/not-possible-innovate-people-poverty/.
O’Connor, S. (2015), The human cloud: A new world of work, The Financial Times.
Piketty, T. (2014), Capital in the Twenty-First Century. London: The Belknap Press of Harvard University Press.
Pilkington, E.L., editor. (2015), New Oxfam report says half of global wealth held by the 1%. Available from: http://www.theguardian. com/business/2015/jan/19/global-wealth-oxfam-inequality-davos-economic-summit-switzerland.
Pink, D. (2001), Free Agent Nation - The Future of Working for Yourself. New York: Grand Central Publishing.
Rural America More Prosperous than Expected. Available from: http:// www.phys.org/news/2009-12-rural-america-prosperous.html. Saez, E., Zuchman, G. (2014), Wealth inequality in the United States
since 1913: Evidence from capitalized income tax data. National Bureau of Economic Research Working Paper, № 20625. Available from: http://www.nber.org/papers/w20625.
Sahlins, M. (1999), Stone Age economics. Moscow: UHPH.
Schwab, K. (2016), The Fourth Industrial Revolution. Kindle Edition. Davos, Switzerland: World Economic Forum.
The Future of Jobs. (2016), Employment, Skills and Workforce Strategy for the Fourth Industrial Revolution. Davos, Switzerland: World Economic Forum.
The Middle Class Compression in the USA and the Answer to this Fact: Much Socialism. Available from: http://www.ttolk.ru/?p=13033. Thomson, S. (2016), The digital revolution could destroy the middle
class, warns Joe Biden. Available from: http://www.weforum. org/agenda/2016/01/the-digital-revolution-could-destroy-the-middle-class-warns-joe-biden?utm_content=buffer1e4bd&utm_ medium=social&utm_source=facebook.com&utm_campaign=buffer. Treanor, J. (2015), Half of world’s wealth now in hands of 1% of
population - Report. Available from: http://www.theguardian. com/money/2015/oct/13/half-world-wealth-in-hands-population-inequality-report?CMP=fb_gu.
UT Professor Finds Economic Inequality is Self-reinforcing. Available from: http://www.phys.org/news/2010-10-ut-professor-economic-inequality-self-reinforcing.html.
Weale, S. Geographical inequality in education has grown over 30 years, study finds. Available from: http://www.theguardian.com/ education/2016/jan/12/geographical-inequality-education-growing-study-finds.