Kumar et al. World Journal of Pharmaceutical and Life Sciences
FORMULATION AND IN-VITRO EVALUATION OF CEFIXIME TRIHYDRATE
SUSTAINED RELEASE MATRIX TABLETS
Dr. G. Pratap Kumar*, L. Rajya Lakshmi and T. Murali Krishna
Principal and Professor, MRR College of Pharmacy, Near DSP Office, Madhira Road, Nandigama-521185, Krishna District, Andhra Pradesh.
Article Received on 19/05/2018 Article Revised on 09/06/2018 Article Accepted on 30/06/2018
Chemical Structure
N S
H2N
NH
N O
OH
O
O
N O
H H S
OH O
Molecular Formula: C16H15N5O7S2
Molecular Weight: 453
Description: A white to light yellow crystalline powder.
Solubility: Practically insoluble in water, in ether, in ethyl acetate and in hexane. Slightly soluble in alcohol, in acetone and in glycerol and freely soluble in methyl alcohol, soluble in propylene glycol, very slightly soluble in 70% sorbitol and in octanol.
Anti-bacterial Spectrum: Highly active against S.
pneumoniae and S. pyorgens, H. influenzae and many Enterobacteriaceae; uncomplicated cervical/urethral gonorrhea due to N. gonorrhoeae.
Mode of action: Cefixime trihydrate inhibit mucopeptide synthesis in the bacterial cell wall, rendering it defective and osmotically unstable. These drugs are usually bactericidal, depending on the dose, tissue concentrations, organism susceptibility, and the rate at which organisms are multiplying. They are more effective against rapidly growing organisms while forming cell walls.
OBJECTIVE OF WORK
The main aim of present investigation is to formulate and evaluate sustained release matrix tablets of Cefixime trihydrate using various polymers in different ratios in order to improve patient compliance.
The objectives of the research work undertaken as follows:
1. Calibration curve for the estimation of Cefixime trihydrate.
2. Pre-formulation studies.
3. Formulation of sustained release Cefixime trihydrate matrix tablets prepared by using various polymers in different ratios.
4. Physical evaluations of matrix tablets. 5. Dissolution rate studies of matrix tablets.
PLAN OF WORK
To achieve this objective the following plan of work was envisaged
1. Preformulation studies (i). Solubility studies,
(ii). Drug excipients compatibility studies
2. Micromeritical studies
Angle of repose, Bulk density, Tapped density and Percentage compressibility.
3. Formulations of matrix tablets
i. Formulations of matrix tablets by HPMC K4M ii. Formulations of matrix tablets by Xanthan gum iii. Formulations of matrix tablets by HPMC K100 iv. Formulations of matrix tablets by Eudragit-RL
World Journal of Pharmaceutical and Life Sciences
WJPLS
www.wjpls.org SJIF Impact Factor: 5.088
*Corresponding Author: Dr. G. Pratap Kumar
Principal and Professor, MRR College of Pharmacy, Near DSP Office, Madhira Road, Nandigama -521185, Krishna District, Andhra Pradesh. Email ID: [email protected], [email protected],
DRUG PROFILE
Cefixime Trihydrate Systemic (IUPAC) name
v. Formulations of matrix tablets by HPMC K4M and Xanthan gum
vi. Formulations of matrix tablets by HPMC K4M and Ethyl cellulose (18cps).
4. Physico-chemical evaluation of Cefixime trihydrate matrix tablets:
5. Weight variation, Friability, Hardness and invitro dissolution studies.
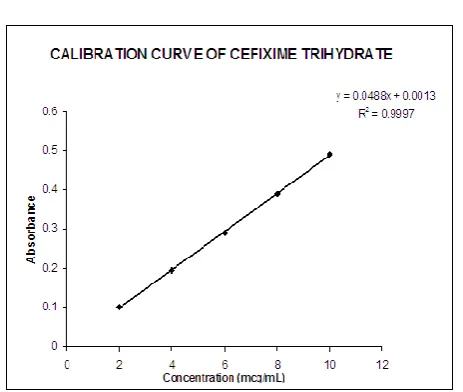
Standard Calibration Curve of Cefixime Trihydrate
Standard calibration curve of Cefixime trihydrate in 7.2 Phosphate buffer at 288 nm by plotting absorbance against concentration and it follows Beer’s law. The results were tabulated below.
Calibration curve of Cefixime trihydrate
Concentration (mcg/mL) Absorbance
2 0.102
4 0.194
6 0.291
8 0.391
10 0.491
Drug-excipients compatibility studies by observing physical appearance
The pure drug and along with formulation excipients were subjected to compatibility studies and studies were carried out by mixing definite proportions of drug and excipients and kept on glass vials which are stored in Desiccator for one month.
Table 1: Drug-Excipients compatibility studies.
Excipient Ratio Description
Initial Final
API 1:0 White to light yellow powder White to light yellow powder API + Eudragit-RL 1:1 White to light yellow powder White to light yellow powder API + HPMC K100 1:1 White to light yellow powder White to light yellow powder API + HPMC K4M 1:1 White to light yellow powder White to light yellow powder API + Xanthan gum 1:1 White to light yellow powder White to light yellow powder API + Talc 1:1 White to light yellow powder White to light yellow powder API+ Microcrystalline cellulose 1: 1 White to light yellow powder White to light yellow powder API + Magnesium Stearate 1:1 White to light yellow powder White to light yellow powder
Table 2: Pre-compression parameters.
Powder blend
Angle of Repose (°)
Loose bulk density (g/cc)
Tapped density (g/cc)
Compressibility index (%)
Hausner ratio
F1 26 0.525 0.65 19.22 1.18
F2 27.5 0.528 0.645 18.1 1.22
F3 25 0.530 0.648 18.2 1.22
F4 29 0.571 0.660 15.58 1.16
F5 27.3 0.540 0.652 17.17 1.20
F6 31 0.482 0.582 17.18 1.21
F7 30 0.512 0.614 16.61 1.19
F8 31.5 0.554 0.685 19.12 1.23
F9 29 0.531 0.662 19.78 1.24
F10 28 0.516 0.651 20.73 1.26
F11 26.6 0.527 0.66 20.15 1.25
F12 26 0.533 0.651 18.12 1.22
F13 29 0.543 0.649 16.33 1.19
F14 27.9 0.541 0.652 17.02 1.20
F15 26 0.531 0.642 17.28 1.21
F16 28 0.523 0.637 17.81 1.21
F18 29.1 0.532 0.645 17.51 1.21
F19 32.5 0.51 0.623 18.13 1.22
F20 28 0.498 0.601 17.13 1.20
F21 27 0.518 0.63 17.77 1.21
F22 30 0.525 0.628 16.40 1.19
F23 26.6 0.542 0.682 20.52 1.25
Table 3: Post-compression parameters.
Formulations Average Weight (mg)
Friability (%)
Uniformity of dosage units (%)
Hardness (Kg/cm2)
Thickness (mm)
F1 401 0.18 101.2 6 3.2
F2 403 0.39 101.5 5 3.2
F3 400 0.15 100.5 6 3.3
F4 399 0.76 99.5 4.5 3.1
F5 405 0.23 99.8 5.5 3.3
F6 402 0.11 100.1 5.5 3.0
F7 400 0.36 103.2 5.5 3.1
F8 398 0.39 102.2 5 3.2
F9 400 0.45 101.4 5.5 3.2
F10 404 0.18 100.3 6.5 3.2
F11 401 0.26 99.9 5 3.3
F12 403 0.19 99.7 6 3.3
F13 402 0.55 100.5 5 3.2
F14 399 0.34 100.1 5.5 3.1
F15 400 0.21 99.8 6 3.1
F16 402 0.15 101.5 6.5 3.2
F17 400 0.40 100 5.5 3.2
F18 399 0.17 99.5 6 3.2
F19 405 0.24 98.7 6 3.3
F20 802 0.21 100.9 5.5 6.4
F21 801 0.32 98.9 6 6.5
F22 800 0.15 100.9 6.5 6.5
F23 803 0.29 102.1 6 6.5
DRUG RELEASE PROFILES OF F1, F2, F3, F4, F5
0
10
20
30
40
50
60
70
80
90
100
0
1
2
3
4
5
6
7
8
9 10 11 12
Time (hrs)
%
d
r
u
g
r
e
le
a
s
e
d
F1
F2
F3
F4
DRUG RELEASE PROFILES OF F6, F7, F8, F9
0 10 20 30 40 50 60 70 80 90 100
0 1 2 3 4 5 6 7 8 9 10 11 12
Time (hrs)
%
d
r
u
g
r
e
le
a
se
d
F6
F7
F8
F9
DRUG RELEASE PROFILES OF F10 & F11
0 10 20 30 40 50 60 70 80 90 100
0 1 2 3 4 5 6 7 8 9 10 11 12
Time (hrs)
%
d
r
u
g
r
e
le
a
se
d
F10
F11
DRUG RELEASE PROFILES OF F12, F13, F14, F15, F16, F17
0 10 20 30 40 50 60 70 80 90 100
0 1 2 3 4 5 6 7 8 9 10 11 12
Time (hrs)
%
d
r
u
g
r
e
le
a
se
d F12
F13
F14
F15
F16
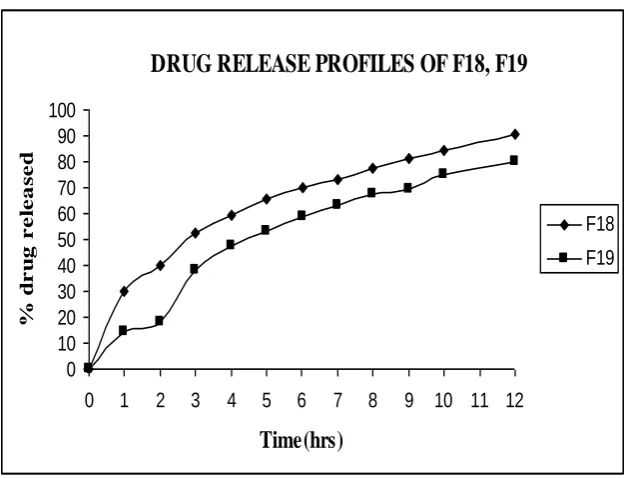
DRUG RELEASE PROFILES OF F18, F19
0 10 20 30 40 50 60 70 80 90 100
0 1 2 3 4 5 6 7 8 9 10 11 12
Time(hrs)
%
d
r
u
g
r
e
le
a
s
e
d
F18 F19
Table 4: Zero Order, first order, Higuchi & Peppas (n) values of all formulations.
Formula Zero order First order Higuchi plot Peppas plot
K0 Ro2 K1 R12 KH R2 n R2
F1 9.015 0.9357 0.696 0.846 34.11 0.981 1.6 0.885
F2 6.207 0.871 0.464 0.959 5.6 0.253 1.47 0.968
F3 6.897 0.777 0.436 0.976 33.42 0.886 1.39 0.904
F4 6.134 0.944 0.159 0.99 28.52 0.99 1.02 0.984
F5 6.06 0.968 0.116 0.994 27.94 0.997 1.08 0.963
F6 12.59 0.785 0.572 0.946 48.71 0.86 1.6 0.895
F7 11.48 0.934 0.591 0.902 45.76 0.976 1.16 0.9734
F8 5.473 0.885 0.152 0.988 25.91 0.962 0.8 0.9494
F9 6.306 0.997 0.113 0.953 28.08 0.959 1.17 0.9946
F10 6.213 0.896 0.164 0.992 29.34 0.97 0.97 0.946
F11 8.086 0.945 0.254 0.978 37.52 0.987 1.48 0.972
F12 5.053 0.979 0.084 0.997 23.12 0.978 1.04 0.990
F13 5.259 0.995 0.080 0.978 23.55 0.968 1.12 0.990
F14 7.644 0.928 0.178 0.984 35.43 0.967 1.95 0.968
F15 7.471 0.993 0.181 0.938 33.69 0.979 1.45 0.989
F16 9.194 0.943 0.316 0.964 40.77 0.9704 1.12 0.946
F17 12.67 0.892 0.397 0.984 48.50 0.93 1.48 0.784
F18 5.23 0.934 0.170 0.992 24.43 0.989 0.83 0.9921
F19 5.99 0.911 0.133 0.987 28.09 0.969 1.004 0.9471
F20 7.90 0.973 0.102 0.963 36.26 0.993 1.407 0.992
F21 6.30 0.917 0.068 0.993 29.52 0.976 0.974 0.958
F22 6.87 0.945 0.081 0.9885 31.89 0.987 0.997 0.968
F23 7.09 0.938 0.087 0.990 33.02 0.985 0.998 0.967
RESULTS AND DISCUSSION
The present investigation was undertaken to formulate Cefixime trihydrate sustained release matrix Tablets for the treatment of respiratory tract infections, urinary tract infections and otitis media. All the experimental batches have been exposed to various evaluations like Angle of Repose, Bulk density, compressibility index, and Average weight, Thickness, Hardness, Friability, Assay, and In-vitro Dissolution.
The primary applications for rate controlling polymers are for decreasing dissolution rate and extend the release of water-soluble drug. Successful drug design with polymers depends largely on understanding the physical, chemical and physiological factors to promote bioavailability.
1. Formulations F1, F2, F3, F4, F5, were made by using increasing concentrations of HPMC K4M with 200mg of Cefixime trihydrate. The details of the formulae were given in Table no: 7.The formula mixtures were evaluated for tests such as bulk density, tapped density, compressibility index and Hausner ratio. The results were shown in the Table no: 17. The compressed Tablets were tested for weight variation, thickness, hardness, friability, and uniformity of dosage units. Drug release profiles of formulations F1, F2, F3, F4 and F5 were conducted for about 12hrs.
2. Formulations F6, F7, F8, F9, were made by using increasing concentrations of Xanthan Gum with 200mg of Cefixime trihydrate. The details of the formulae were given in Table no: 8, the formula mixtures were evaluated for tests such as bulk density, tapped density, compressibility index and Hausner ratio.
3. The compressed Tablets were tested for weight variation, thickness, hardness, friability, and uniformity of dosage units The results were shown in the Table no:18.The Drug release profiles of formulations F6, F7, F8, F9 were conducted for about 12hrs.
4. Formulations F10, F11 was made by using different concentrations of HPMC K100 with 200mg of Cefixime trihydrate. The details of the formulae were given in Table no: 9.The formula mixtures were evaluated for tests such as bulk density, tapped density, compressibility index and Hausner ratio. The compressed Tablets were tested for weight variation, thickness, hardness, friability, and uniformity of dosage units. The Drug release profiles of formulations F1, F2, F3, F4, and F5 were conducted for about 12hrs.
5. Formulations F12, F13 F14, F15, F16, F17 was made by using different concentrations of Eudragit-RL and sodium starch glycolate with 200mg of Cefixime trihydrate. The details of the formulae were given in Table no: 10. The formula mixtures were evaluated for tests such as bulk density, tapped density, compressibility index and Hausner ratio. The compressed Tablets were tested for weight variation, thickness, hardness, friability, and uniformity of dosage units. The Drug release profiles of formulations F1, F2, F3, F4, and F5 were conducted for about 12hrs.
BIBLIOGRAPHY
1. Lachman L. and Lieberman H.A., Pharmaceutical Dosage Forms, In; Tablets, Vol. 2, Marcel Dekker, Inc., New York.
2. Leon Lachman et.al; The Theory and Practice of Industrial Pharmacy, 3rd edition, Page. No: 293- 345.
3. Remington: The science and practice of pharmacy, 20th edition volume1, Page. No: 858-863.
4. D.M. Brahmankar, Biopharmaceutics and pharmacokinetics, 1995; Page. No: 17-19.
5. M.E.Aulton, Pharmaceutics - The science of dosage form design, 2nd edition, Page No: 360-461.
6. Leon Shargel and Andrew, B.C.Y.U., Applied Biopharmaceutics and Pharmacokinetics, 1999; 4. 7. Bharmankar, D.M. and Sunil B. Jaiswal.,
Biopharmaceutics and Pharmacokinetics, 2004; 1,296.
8. The Merck Index, 13th edition, 2001; 6909.
9. James Swarbrick and James C. Boylan,
Encyclopedia of pharmaceutical technology, 2nd edition, volume-1, Page. No: 642- 647.
10. Batra, Shirolkar V.S. and Deshpande A.D., Indian J. Pharma. Educ. Res, Oct-Dec., 2008; 42(4): 373-378. 11. Raymond C Rowe, Paul J Sheskey and Siaane Owen, Handbook of Pharmaceutical Excipients, 132, 188, 213, 214, 449, 701 and 764.
12. Stupak. E.I. and Bates, J. pharm. Sci., 1972; 4: 61. 13. B.K. Sharma, Instrumental methods of chemical
analysis, 26th edition-2007; S-283-314.
14. Leonards, J. R., Clin. Pharmacol. Ther, 1963, Page. No: 4.
15. Md.Mizanur rahman mogal., Md.Safiqul islam., Monzural Amin Roni., Ishtiaq Ahmed., Muhummad Rashedulislam and Habibur rahman, IJPER, 2008. 16. Hiremath.S.N, Patil.S.D, Swamy.P.V, and MD.
Younus Ali, IJPER, 2009.
17. M.A.Roni, G.Kibria, R.Jalil, Indian Journal of Pharmaceutical Sciences, 2009, Page.No:252. 18. R.V.Keny, S.A.Mankame, C.F.Lourenco, Indian
Journal of Pharmaceutical Sciences, 2009; 295. 19. K.P.R.Chowdary, M.N.Murali Krishna, and
B.Madhava rao, Indian Journal of Pharmaceutical Excipients, 2007; 84.