Open Access
Technical advance
The macular mapping test: a reliability study
Hannah Bartlett*, Leon N Davies and Frank Eperjesi
Address: Ophthalmic and Physiological Optics Research Group, Aston University, Birmingham, UK
Email: Hannah Bartlett* - [email protected]; Leon N Davies - [email protected]; Frank Eperjesi - [email protected] * Corresponding author
Abstract
Background: Age-related macular degeneration (ARMD) is the leading cause of visual disability in people over 60 years of age in the developed world. The success of treatment deteriorates with increased latency of diagnosis. The purpose of this study was to determine the reliability of the macular mapping test (MMT), and to investigate its potential as a screening tool.
Methods: The study population comprised of 31 healthy eyes of 31 participants. To assess reliability, four macular mapping test (MMT) measurements were taken in two sessions separated by one hour by two practitioners, with reversal of order in the second session. MMT readings were also taken from 17 age-related maculopathy (ARM), and 12 AMD affected eyes.
Results: For the normal cohort, average MMT scores ranged from 85.5 to 100.0 MMT points. Scores ranged from 79.0 to 99.0 for the ARM group and from 9.0 to 92.0 for the AMD group. MMT scores were reliable to within ± 7.0 points. The difference between AMD affected eyes and controls (z = 3.761, p = < 0.001) was significant. The difference between ARM affected eyes and controls was not significant (z = -0.216, p = 0.829).
Conclusion: The reliability data shows that a change of 14 points or more is required to indicate a clinically significant change. This value is required for use of the MMT as an outcome measure in clinical trials. Although there was no difference between MMT scores from ARM affected eyes and controls, the MMT has the advantage over the Amsler grid in that it uses a letter target, has a peripheral fixation aid, and it provides a numerical score. This score could be beneficial in office and home monitoring of AMD progression, as well as an outcome measure in clinical research.
Background
Age-related macular degeneration (AMD) is the advanced from of age-related macular disease (ARMD) and is the leading cause of visual disability in patients over the age of 60 years in the developed World [1]. In the United States, the demographic right shift is expected to cause an increase in the number of people affected by this condi-tion from 1.75 million to almost 3 million by 2020 [2].
Exudative AMD and/or geographic atrophy (GA) can result in the severe visual loss, and their prevalence in the US population over 40 years of age has been estimated at 1.47% [95% confidence interval (CI), 1.38% – 1.55%] [2]. The likelihood of visual deterioration in those with exudative AMD may be reduced with laser photocoagula-tion and photodynamic therapy [3-6], but the success rate deteriorates with increasing latency of diagnosis as lesions extend towards the foveal avascular zone. Consequently, early diagnosis is crucial, and at risk patients are often Published: 10 August 2005
BMC Ophthalmology 2005, 5:18 doi:10.1186/1471-2415-5-18
Received: 18 March 2005 Accepted: 10 August 2005
This article is available from: http://www.biomedcentral.com/1471-2415/5/18
© 2005 Bartlett et al; licensee BioMed Central Ltd.
advised to use an Amsler grid at home for detection of scotomas and metamorphopsia [7-9].
The Amsler grid has been used in clinical practice since the 1940s [10] for detecting and monitoring retinal condi-tions such as age-related macular disease [11-13]. It has been shown, however, that a report of distortion of the Amsler grid can come from perceived lines filling-in across scotomas, or equally from non-scotomatous retinal impairments; the clinician has no way of knowing which. Seventy-seven percent of standard and 87 % of threshold scotomas that are 6° or less in diameter are not detected by Amsler grid testing [10]. The poor performance of the Amsler grid may be related to the inability to maintain fix-ation while testing the peripheral visual field [14], crowd-ing effects caused by peripheral presentation of multiple lines [15], inability to assess factors such as quality of examination performance, and low compliance to per-form the Amsler grid at home [14]. Despite the shortcom-ings of this test, the Amsler has been used as a measure of visual change in a randomised controlled trial (RCT) investigating the effect of nutritional supplementation in atrophic AMD [16].
The MMT was designed primarily for quick assessment of residual vision in patients with maculopathies. However, the peripheral fixation aid, along with the use of letter tar-gets may make it a useful tool for monitoring progression of macular disease. The objective of this study was to assess reliability (repeatability and reproducibility), and to assess the effect of ARMD on MMT scores.
The results of this study will allow the use of the MMT as an outcome measure in clinical research, and may also be of interest to those who evaluate scotomas for the purpose of eccentric viewing training.
Methods
Design and setting
This was a reliability study designed to investigate the reproducibility and repeatability of the MMT. Data was also collected from ARMD affected eyes to assess the impact of the disease on MMT score. The study was carried out in the Neurosciences Research Institute at Aston Uni-versity, Birmingham, UK, in a clinical research setting.
Subjects
Thirty-one normally sighted participants were recruited from staff, students, and patients of the Division of Optometry, Aston University, Birmingham, UK. This research adhered to the tenets of the Declaration of Hel-sinki. All participants gave informed consent to take part in the study, which was approved by the Institutional Human Ethics Committee. These participants varied in age from 23 to 77 years (mean ± SD, 50.3 ± 19.0 years).
Visual acuity (VA) ranged from -0.20 to 0.0 (0.00 ± 0.07 logMAR).
Exclusion criteria were: best-corrected logMAR VA of worse than 0.1 logMAR (VA was measured under standard testing conditions using a logMAR chart, retro illuminated to a luminance of 130 cdm-2 [17] and each letter seen was
scored as 0.02 log units, with guessing encouraged); reti-nal disease detected using a direct ophthalmoscope; glau-coma; lenticular opacities greater than grade 1 on the LOCS I grading scale [18]; prescribed medication associ-ated with changes in retinal function.
The ARMD affected eyes were classified according to the International Classification and Grading System for Age-related Maculopathy (ARM) and Age-Age-related Macular Degeneration (AMD) [19]. ARM refers to large soft drusen and pigmentary abnormalities of the retinal pigment epi-thelium (RPE) and the retina, whereas AMD refers to later stages of the disease such as GA, choroidal neovasculariza-tion, pigment epithelium detachment, and fibrous scaring of the macula [19]. Digital fundus photographs were taken using the Topcon non-mydriatic TRC-NW5S retinal camera (Topcon House, Bone Lane. Kennet Side, New-bury, Berkshire RG14 2PX, UK). Eyes were not dilated and one investigator classified all photographs.
The MMT was carried out on 17 ARM affected eyes of 17 participants aged from 55 to 82 (69.4 ± 7.7 years) and 12 AMD affected eyes of 12 participants aged from 65 to 78 (71.8 ± 4.3 years). VA ranged from -0.08 to 0.2 (0.04 ± 0.09 logMAR) for the ARM group, and from 0.2 to 0.76 (0.50 ± 0.21) for the AMD group. The eyes included did not have lenticular opacities greater than grade 1 on the LOCS I grading scale [18], and were not affected by any other ocular condition. The MMT scores from these groups were compared with those from 16 normal partic-ipants aged > 50 years, aged from 51 to 77 (67.1 ± 8.9 years).
Materials
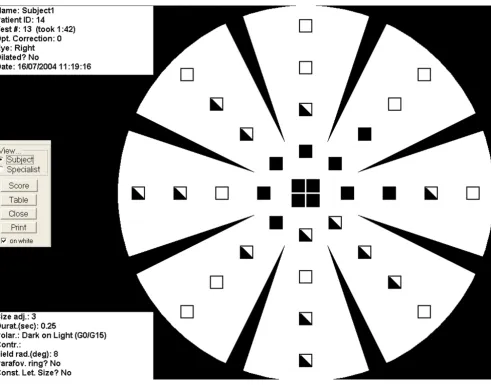
The MMT is a software program used in conjunction with a desktop or laptop computer, designed specifically to map visual defects due to macular disease. The test screen displays a characteristic background pattern throughout the test, which resembled a 'wagon wheel'. Eight spokes point inwards, but do not reach the centre of the circular display area. This pattern provides the patient with suffi-cient peripheral landmarks to indicate the location of the centre of the circular display area [20], even if the centre is not directly visible to the patient (fig. 1).
vertical proportion of the monitor, and to set the monitor to maximum contrast and brightness. The diameter of the wagon wheel on the screen allows the system to suggest a correct viewing distance, such that the wagon wheel has the correct angular extent of 18° diameter. The viewing distance for our system was 76.2 cm.
The targets comprise of the Sloan letters [21] with a change in the width-to-height ratio from 5 × 5 to 4 × 5 for better legibility. Serifs are also added to the D to reduce the probability of confusion with O. Letter sizes vary according to eccentricity, starting at 5 pixels high, and increments of 5 pixels to 45 each. Thirty-two standard locations ensure that the letters do not 'collide' with the
spokes of the wagon wheel. There are an additional four central locations.
Procedure
All participants were seated comfortably, with their head supported using a chin rest, and the eye not being tested occluded. In order to ensure control of direction of gaze, each participant was asked, 'Do you have a sense of where the centre of the wagon wheel is?'. All participants responded positively, and were then instructed to direct their eye to the centre and to keep it there as still as possi-ble. Participants with AMD were also advised that the cen-tre of the wagon wheel may seem to disappear. As the background illuminance was low (6 lux), and our Subject view of the MMT results
Figure 1
participants did not have lens opacities greater than grade one of the LOCS I scale, we were not concerned about glare, and therefore selected the black letters on a white background presentation mode. The following explana-tion of the test was given to every participant; 'Black letters will appear one at a time anywhere on the white wagon wheel. It is important that you do not move your eye to try and look at them. When you see a letter, say the name of it out loud. If you are not sure what the letter is, have a guess'.
The same testing room was used for each test with back-ground lighting switched off. When both eyes matched the inclusion criteria, the right eye was tested, and when only one eye was suitable for inclusion, this eye was tested. The prescription providing best-corrected visual acuity at the test distance was placed into a trial frame, with the eye not being tested occluded. Full aperture trial lenses were used.
When each participant was ready the examiner pressed the mouse button and a letter appeared in an unpredictable location in the visual field, remaining visible for 234 msec. The participant told the examiner which letter they perceived and the examiner entered this response into the computer for scoring. This prompts display of the next let-ter, and so on. There are three categories of response; 1) target not detected, 2) target detected, but not recognized (including incorrect responses), 3) target correctly recog-nized. The final score is calculated using the following sys-tem; target not detected = 0, target detected but not recognized = 1, target detected = 2. The score is displayed at the end of the test and the participant is able to view a 'map' of the areas seen and unseen.
Data were collected by two optometrists, HB and LD, dur-ing two sessions separated by one hour from the same subjects. A trial run was completed for each subject by HB in the first session and LD in the second session to encour-age test familiarity and reduce learning effects. In session 1 the first experimental test was carried out by HB, and the second by LD, and in session two this order was reversed The study was designed to assess reproducibility (HB1-LD1, LD2-HB2), and repeatability (HB1-HB2, LD1-LD2),
Data analysis employed the independent-samples t-test for comparing ages and the chi-squared test to compare proportion of males by group. The MMT scores are non-continuous data, and so we used nonparametric statistical tests in our analysis. The Mann-Whitney U test was used to compare MMT scores between groups. When assessing the effect of ARMD on MMT score, power analysis shows that the group sizes were sufficient to have an 80% chance of detecting a difference in means of 5 MMT points at the
5% level of significance using the independent samples t-test.
Difference in MMT score between HB1 and HB2 compared with the mean (n = 31 eyes)
Figure 2
Difference in MMT score between HB1 and HB2 compared with the mean (n = 31 eyes). The mean bias is represented by the solid line and the 95 % confidence limits are repre-sented by the dotted lines.
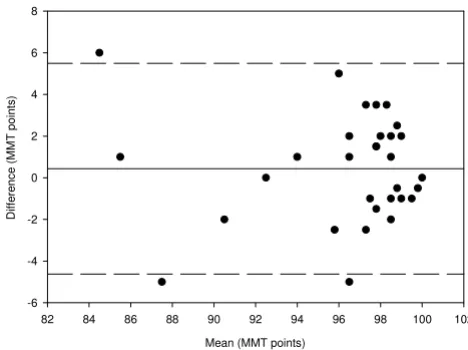
Difference in MMT score between HB1 and LD1 compared with the mean (n = 31 eyes)
Figure 3
Difference in MMT score between HB1 and LD1 compared with the mean (n = 31 eyes). The mean bias is represented by the solid line and the 95 % confidence limits are repre-sented by the dotted lines.
Average MMT score (MMT points)
80 82 84 86 88 90 92 94 96 98 100 102
Di
ffe
re
nce
in
M
M
T
sco
re
(M
M
T
po
in
ts)
-15 -10 -5 0 5 10 15
Average MMT score (MMT points)
80 85 90 95 100
D
iff
er
en
ce
in
MM
T
sco
re
(MM
T
po
in
ts
)
Results
Reliability
Average MMT scores ranged from 85.5 to 100.0 MMT points. Reproducibility was determined by comparing HB1-LD1 and LD2-HB2, and repeatability was deter-mined by comparing HB1-HB2 and LD1-LD2. The differ-ences between data sets for two of the comparisons (HB1-HB2 and HB1-LD1) were normally distributed and these
were used for analysis. See figures 2 to 5 for a graphical representation of test-retest data of the HB2, HB1-LD1, LD1-LD2, and LD2-HB2 comparisons respectively.
Accurate analysis of test-retest data can be achieved using the coefficient of repeatability [22,23]. This gives the 95% confidence limits for the amount of difference between two sets of results. It is calculated as 1.96 multiplied by the standard deviation of the mean differences between the two sets of data. The coefficient of repeatability is ± 6.70 for the HB1-HB2 comparison, ± 7.24 for the HB1-LD1 comparison, ± 7.4 for the LD1-LD2 comparison, and ± 4.3 for the LD2-HB2 comparison.
A comparison between HB1 and LD2 has also been made. The coefficient of repeatability is ± 4.9 and the data is shown in figure 6.
Effect of ARM
Of the ARM participants, 12 had soft distinct drusen, three had soft distinct drusen with hyperpigmentation of the RPE, and two had soft indistinct drusen. The ARM group and the subset of nomals were matched for age (t = -0.783; p = 0.439) and gender [χ2 (1) = 0.501, p = 0.579]. Scores
ranged from 85.5 to 100.0 for the subset of normals and from 79.0 to 99.0 for the ARM group. The mean MMT score was 94.5 points (94.6 ± 4.8) for the over 50 normal group and 95.0 points (94.9 ± 4.7) for the ARM group, and there was no significant difference between the Difference in Macular Mapping Test (MMT) value between
LD1 and LD2, compared with the mean (N = 30 eyes)
Figure 4
Difference in Macular Mapping Test (MMT) value between LD1 and LD2, compared with the mean (N = 30 eyes). The mean bias is represented by the solid line, and the 95% confi-dence limits are known by the dashed lines.
Difference in Macular Mapping Test (MMT) value between LD2 and HB2, compared with the mean (N = 30 eyes)
Figure 5
Difference in Macular Mapping Test (MMT) value between LD2 and HB2, compared with the mean (N = 30 eyes). The mean bias is represented by the solid line, and the 95% confi-dence limits are known by the dashed lines.
Mean (MMT) points
80 85 90 95 100 105
Di
ffer
en
ce
(M
M
T
po
in
ts
)
-15 -10 -5 0 5 10 15
Mean (MMT points)
70 75 80 85 90 95 100 105
Di
ffer
en
ce
(M
M
T
po
in
ts
)
-15 -10 -5 0 5 10 15
Difference in Macular Mapping Test (MMT) value between HB1 and LD2, compared with the mean (N = 30 eyes)
Figure 6
Difference in Macular Mapping Test (MMT) value between HB1 and LD2, compared with the mean (N = 30 eyes). The mean bias is represented by the solid line, and the 95% confi-dence limits are known by the dashed lines.
Mean (MMT points)
82 84 86 88 90 92 94 96 98 100 102
Di
ffe
re
nc
e
(MM
T
poin
ts
)
groups (z = -0.216, p = 0.829). Power analysis shows that the group sizes were sufficient to have an 80% chance of detecting a difference in means of 5 MMT points at the 5% level of significance using the unpaired t-test.
Effect of AMD
All AMD participants had GA, characterised by any sharply delineated roughly round or oval area of hypopig-mentation or depighypopig-mentation, or apparent absence of the RPE, in which choroidal vessels were more visible than in surrounding areas. The size of the lesion was at least 1/8 disc diameters in size. The AMD group and the subset of normals were matched for age (t = -1.613, p = 0.119) and gender [χ2 (1) = 0.619, p = 0.821). Scores ranged from 9.0
to 92.0 for the AMD group. The mean MMT score was 62.0 points (61.9 ± 23.8) for the AMD group. The differ-ence in scores between the over 50 and the AMD group is statistically significant (z = 3.761, p < 0.001).
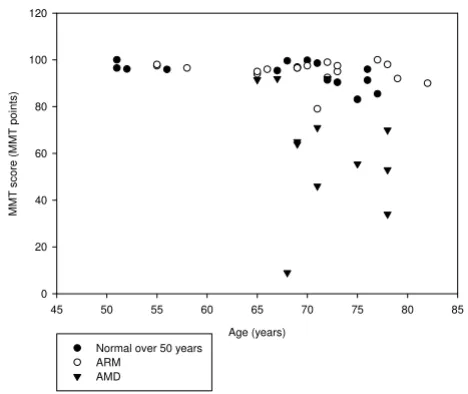
Figure 7 shows the effect of age on MMT score for the nor-mal, ARM and AMD groups.
Discussion
The primary objective of this study was to determine the reliability of the MMT. The developers of the MMT assessed its reliability by performing the test twice on 20 eyes. The conditions were made harder between the first and second run by decreasing the size of the letters by 5 pixels, and 92 % of all tested locations in the participants behaved within expectation. It was concluded that the test
procedure reflects the functional topography with reason-able accuracy and reliability [24]. Our reliability data has been used to determine the decrease in MMT score that is needed to indicate a clinical change between tests. The MMT scores are repeatable to within ± 7.0 points, indicat-ing that the MMT score has to change by more than 14 points for the change to be clinically significant. This value could be useful if MMT score was being used as an outcome measure for monitoring progression of ARMD, or for monitoring the effect of an intervention, e.g. a nutri-tional supplement.
A limitation of this study design is that the order of the assessor in each of the two sessions was not randomly assigned. This would have permitted assessment of the variance components, assessor, order, and session. How-ever, a comparison has been made between HB1 and LD2, and the coefficient of repeatability was smaller than for other comparisons. This, therefore, does not affect the reliability conclusions draw.
Comparisons between ARM-affected eyes and age- and gender-matched controls yielded no significant differ-ence, although this part of the study was powered to detect a difference between groups. There was significant reduction in MMT score between AMD-affected eyes and age- and gender-matched controls. Our results show that the MMT is not suitable for screening of ARM.
Conclusion
Although the reliability data indicates variability, the MMT has the advantage over, for example, the Amsler grid that it uses a letter target, has a peripheral fixation aid, and it provides a numerical score. The score could be benefi-cial in clinic and home monitoring of AMD progression, as well as provide an outcome measure in clinical research.
Competing interests
The author(s) declare that they have no competing interests.
Authors' contributions
HB participated in the design of the study, the acquisition, analysis, and interpretation of the data, and drafting of the final manuscript. LD participated in the design of the study, aquisitiion of data, and the final drafting of the manuscript. FE participated in the design of the study and the final drafting of the manuscript. All authors read and approved the final manuscript.
Acknowledgements
Hannah Bartlett is funded by the College of Optometrists, UK. This work was presented as a paper at the American Academy of Optometry meeting, Tampa, 2004.
First MMT scores taken from normal (over 50 years), ARM and AMD participants plotted against age
Figure 7
First MMT scores taken from normal (over 50 years), ARM and AMD participants plotted against age.
Age (years)
45 50 55 60 65 70 75 80 85
MMT
sco
re
(MMT
po
in
ts
)
0 20 40 60 80 100 120
Normal over 50 years ARM
Publish with BioMed Central and every scientist can read your work free of charge
"BioMed Central will be the most significant development for disseminating the results of biomedical researc h in our lifetime."
Sir Paul Nurse, Cancer Research UK
Your research papers will be:
available free of charge to the entire biomedical community
peer reviewed and published immediately upon acceptance
cited in PubMed and archived on PubMed Central
yours — you keep the copyright
Submit your manuscript here:
http://www.biomedcentral.com/info/publishing_adv.asp
BioMedcentral
References
1. Klein R, Klein BE, Jensen SC, Meuer SM: The five-year incidence and progression of age-related maculopathy: the Beaver Dam Eye Study. Ophthalmology 1997, 104:7-21.
2. The Eye Diseases Prevalence Research Group: Prevalence of Age-Related Macular Degeneration in the United States. Archives of Ophthalmology 2004, 122:564-572.
3. American Academy of Ophthalmology: Photodynamic therapy with verteporfin for age-related macular degeneration. Oph-thalmology 2000, 107:2314-2317.
4. Bressler NM: Photodynamic therapy of subfoveal choroidal neovascularization in age-related macular degeneration with verteporfin: two-year results of 2 randomized clinical trials: TAP Report 2. Archives of Ophthalmolgy 2001, 119:198-207. 5. Macular Photocoagulation Study Group: Laser Photocoagulation of subfoveal neovascular lesions of age-related macular degeneration: updated findings from two clinical trials.
Archives of Ophthalmolgy 1993, 111:1200-1209.
6. Macular Photocoagulation Study Group: Laser photocoagulation of subfoveal neovascular lesions in age-related macular degeneration: results of a randomized clinical trial. Archives of Ophthalmolgy 1991, 109:1220-1231.
7. Macular Photocoagulation Study Group: Early detection of extra-foveal neovascular membranes by daily field evaluation. Oph-thalmology 1985, 92:603-609.
8. Yannuzzi LA: A modified Amsler grid. Ophthalmology 1982, 89:157-159.
9. Singerman LJ: Important points in management of patients with choroidal neovascularization. Ophthalmology 1985, 92:610-614.
10. Schuchard RA: Validity and interpretation of Amsler Grid reports. Archives of Ophthalmolgy 1993, 111:776-780.
11. Boldrey EE: Foveal ablation for subfoveal choroidal neovascularization. Ophthalmology 1989, 96:1430-1435. 12. Walsh AW, Magargal LE, Wright F, Donoso LA: The early natural
history of subfoveal neovascular membranes in eyes with age-related macular degeneration. Annals of Ophthalmology
1989, 21:348-350.
13. Swann PG, Lovie-Kitchin JE: Age-related maculopathy, II: the nature of the central visual field loss. Ophthalmic Physiol Opt
1991, 11:59-70.
14. Loewenstein A, Malach R, Goldstein M, Leibovitch I, Barak A, Baruch E, Alster Y, Rafaeli O, Avni I, Yassur Y: Replacing the Amsler Grid. A New Method for Monitoring Patients with Age-related Macular Degeneration. Ophthalmology 2003, 110:966-970. 15. Parkes L, Lund J, Angelucci A: Compulsary averaging of crowded
orientation signals in human vision. Nature Neuroscience 2001, 4:739-744.
16. Richer S, Stiles W, Statkute L, Pulido J, Frankowski J, Rudy D, Pei K, Tsipursky M, Nyland J: Double-masked, placebo-controlled, randomized trial of lutein and antioxidant supplementation in the intervention of atrophic age-related macular degener-ation: the Veterans LAST study (Lutein Antioxidant Supple-mentation Trial). Optometry 2004, 75:216-230.
17. Bailey F, Lovie-Kitchin JE: New design principles for visual acuity letter charts. American Journal of Optometry and Physiological Optics
1976, 53:745-753.
18. Chylack LT, Leske MC, Sperduto R, Khu P, McCarthy D: Lens Opac-ities Classification-System. Arch Ophthalmol 1988, 106:330-334. 19. Bird AEC, Bressler NM, Bressler SB, Chisholm IH, Coscas G, Davis
MD, Dejong P, Klaver CCW, Klein BEK, Klein R, Mitchell P, Sarks JP, Sarks SH, Sourbane G, Taylor HR, Vingerling JR: An International Classification and Grading System for Age- Related Macu-lopathy and Age-Related Macular Degeneration. Survey of Ophthalmology 1995, 39:367-374.
20. Steinbach M: Pursuing the perceptual rather than the retinal stimulus. Vision Research 1976, 16:1371.
21. Sloan LL: New test charst for the measurement of visual acu-ity at far and near distances. American Journal of Ophthalmology
1959, 48:807-813.
22. Bland JM, Altman DG: Statistical methods for assessing agree-ment between two methods of clinical measureagree-ment. Lancet
1986, 1:307-310.
23. Elliott DB, Sheridan M: The use of accurate visual acuity meas-urements in clinical anti-cataract formulation trials. Ophthal-mic Physiol Opt 1988, 8:397-401.
24. Mackeben M, Colenbrander A: Mapping the Topography of Residual Vision after Macular Vision Loss. IOS Press 1994:59-67.
Pre-publication history
The pre-publication history for this paper can be accessed here: