R E S E A R C H A R T I C L E
Open Access
Assessing genetic polymorphisms using DNA
extracted from cells present in saliva samples
Zsofia Nemoda
1*, Maria Horvat-Gordon
2, Christine K Fortunato
3, Emilie K Beltzer
3, Jessica L Scholl
2and
Douglas A Granger
4Abstract
Background:Technical advances following the Human Genome Project revealed that high-quality and -quantity DNA may be obtained from whole saliva samples. However, usability of previously collected samples and the effects of environmental conditions on the samples during collection have not been assessed in detail. In five studies we document the effects of sample volume, handling and storage conditions, type of collection device, and oral sampling location, on quantity, quality, and genetic assessment of DNA extracted from cells present in saliva.
Methods:Saliva samples were collected from ten adults in each study. Saliva volumes from .10-1.0 ml, different saliva collection devices, sampling locations in the mouth, room temperature storage, and multiple freeze-thaw cycles were tested. One representative single nucleotide polymorphism (SNP) in the catechol-0-methyltransferase gene (COMT rs4680) and one representative variable number of tandem repeats (VNTR) in the serotonin
transporter gene (5-HTTLPR: serotonin transporter linked polymorphic region) were selected for genetic analyses. Results:The smallest tested whole saliva volume of .10 ml yielded, on average, 1.43 ± .77μg DNA and gave accurate genotype calls in both genetic analyses. The usage of collection devices reduced the amount of DNA extracted from the saliva filtrates compared to the whole saliva sample, as 54-92% of the DNA was retained on the device. An“adhered cell”extraction enabled recovery of this DNA and provided good quality and quantity DNA. The DNA from both the saliva filtrates and the adhered cell recovery provided accurate genotype calls. The effects of storage at room temperature (up to 5 days), repeated freeze-thaw cycles (up to 6 cycles), and oral sampling location on DNA extraction and on genetic analysis from saliva were negligible.
Conclusions:Whole saliva samples with volumes of at least .10 ml were sufficient to extract good quality and quantity DNA. Using 10 ng of DNA per genotyping reaction, the obtained samples can be used for more than one hundred candidate gene assays. When saliva is collected with an absorbent device, most of the nucleic acid content remains in the device, therefore it is advisable to collect the device separately for later genetic analyses.
Background
In the wake of the Human Genome Project, information from Genome Wide Association (GWA) studies is accumu-lating at a rapid rate. GWA studies include large numbers of well-characterized cases and several hundred thousand polymorphisms in an attempt to identify candidate genes with plausible linkages to the phenotypes of specific interest [1]. Once identified as biologically plausible, subsequent studies conducted on independent populations endeavour
to replicate the genotype-phenotype association, because confirmation of small genetic effect is crucial in complex inheritance disorders and traits. Research groups can potentially use already collected biological samples for genetic analyses. In a series of studies we show that saliva samples, even though originally not designed for genetic analyses, can be reliably used for genotyping genetic poly-morphisms. Recommendations are provided to guide researchers with archived specimens, as well as those pre-paring to launch new data collections.
In studies involving children and healthy subjects, non-invasive sampling of DNA is preferred. Mailing buccal or saliva samples in large-scale epidemiological studies is * Correspondence: [email protected]
1
Department of Medical Chemistry, Molecular Biology and
Pathobiochemistry, Semmelweis University, Tuzolto utca, Budapest, Hungary Full list of author information is available at the end of the article
also the choice of method. Recent studies reveal that high-quality and -quantity DNA can be obtained from saliva samples [2-4]. However, the use of saliva as a bios-pecimen is associated with several special issues. Depend-ing on the method used to collect saliva, the specimen will yield different volumes, raising the possibility that the quantity of DNA available to be extracted will also vary. Saliva contains a variety of compounds that have the potential to degrade proteins and nucleic acids [5]. If samples are stored or transported at room temperature, the activity of these compounds or their products may affect the DNA extracted from the sample. Even under healthy circumstances, oral fluids contain a diverse array of microbes (e.g., virus, bacteria, and fungi), and therefore estimates of DNA quantity and quality in saliva may be overestimated (or confounded) by DNA from these microorganisms [2]. Cells may also adhere to different devices that are utilized in saliva sample collection (e.g., cotton, foam, and hydrocellulose), causing lower quanti-ties of DNA to be present in the extracted saliva speci-men. Additionally,“saliva”is a mixture of different fluids produced by multiple glandular sources (i.e., parotid, sub-lingual, submandibular salivary glands). Each gland pro-duces a different volume of saliva and secretes different constituents, raising the possibility that specific oral fluid types may contain more or less nucleic acid content. The past two decades have witnessed the adoption and inte-gration of minimally invasive measures (in saliva) in stu-dies of the psychobiology of the stress response (e.g., cortisol, alpha-amylase [6]), secretory products of the endocrine systems (e.g., testosterone [7]), inflammatory processes (e.g., cytokines [8]), and pathogen-specific anti-bodies (e.g., HSV [9]). Access to these tools is now wide-spread, collection and assay protocols are being standardized, and salivary analytes and biomarkers are being employed across many subfields.
In a series of comparative analyses of saliva samples collected using commonly employed techniques the effects of saliva volume, handling, and storage conditions, collection device, and sampling location in the mouth were tested on the quantity and quality of extracted DNA. We also confirmed whether the detection of repre-sentative single nucleotide polymorphism (SNP) and vari-able number of tandem repeats (VNTR) are affected by these factors and processes. For the genetic analyses, two functional polymorphisms were selected from the psy-chogenetic literature [10]. The Val158Met (rs4680) SNP of the catechol-0-methyltransferase (COMT) gene causes an amino acid change from valine to methionine at the 158thposition in the membrane-bound isoform. The Met-variant results in 2 to 4 times lower enzymatic activ-ity [11], affecting degradation of catecholamines (e.g., dopamine) in the central nervous system. This SNP dis-plays a trimodal distribution of enzyme activity: low
(Met/Met), intermediate (Val/Met), and high (Val/Val) [12]. The investigated VNTR was the so-called 5-HTTLPR (serotonin transporter linked polymorphic region) located in the promoter region of the serotonin transporter gene (SLC6A4). It has two main alleles in Caucasians: 14-repeat = Short (S) and 16-repeat = Long (L) allele. The short variant showed reduced transcription activity in a reporter gene system and in lymphoblasts [13,14].
Study 1: Are the typical volumes of saliva collected in research studies sufficient to enable isolation of DNA for genetic analyses?
The attention saliva has received as a research and diag-nostic specimen [15] is largely due to the perception that sample collection is quick and uncomplicated. In many circumstances this claim is true. However, saliva collec-tion from infants less than 3 months of age often results in low specimen volumes [16]. Later in early childhood (12-18 months), saliva collection by a stranger becomes complicated by more frequent occurrences of anxiety and non-compliance with collection procedures [17]. On the opposite end of the continuum, collecting saliva from the elderly can be time-consuming and also may have a high failure rate. Xerostomia (dry mouth) is a common iatrogenic effect of medications, and dry mouth presents in a high percentage of participants in studies of the old-est-old [18]. Thus, in field settings the volume of saliva available to be collected will vary. In Study 1, we tested how variation in the volume of saliva collected affects the quality and quantity of DNA, and the detection of 5-HTTLPR and COMT Val158Met polymorphisms.
Study 2: Do collection device materials affect the isolation of sufficient quantity and quality DNA from saliva?
Historically, saliva collection devices involve cotton-absor-bent materials [19]. When placed in the mouth (2-3 min), cotton saturates with saliva which is then expressed into collection vials by centrifugation or compression [20]. Most of the time, this approach is convenient, simple, and time-efficient. However, when the absorbent capacity is large and sample volume is small, the specimen absorbed can be diffusely distributed and specimen recovery becomes problematic [21]. Contemporary collection meth-ods now employ synthetic or hydrocellulose rather than cotton fibers and yield a much higher sample recovery rate (e.g., hydrocellulose microsponge, synthetic pledget or swab). When the participant is older than 6 years, awake, compliant, and capable of following instructions, collecting whole saliva by passive drool is optimal [17].
be compromised. In Study 2, we examined this possibility utilizing four common saliva collection methods (1) BD hydrocellulose microsponge, (2) Richmond cotton rope, (3) Sarstedt synthetic pledget, and (4) Salimetrics syn-thetic swab, and (5) passive drool as a control.
Study 3: What are the effects of storing saliva samples at room temperature on the extraction and analysis of DNA?
In research studies, saliva specimens are often gathered in the field or in such conditions that restrict the way in which they can be handled and stored. Typically, once a specimen is collected, samples are kept cold and then fro-zen to maintain sample integrity. Refrigeration prevents degradation of some salivary analytes and restricts proteo-lytic enzyme activity and bacteria growth. For large-scale national surveys, in which investigators are working in remote areas [22,23] or for diurnal cortisol assessment where patients are collecting samples at home [24], freez-ing and shippfreez-ing samples frozen can be cost-prohibitive. Appropriate sample handling after collection is essential to maintaining sample integrity; the handling plan needs to be worked outa priori and matched specifically to the “needs”of the analytes to be measured. For example, sali-vary cortisol or alpha-amylase levels were shown to be stable at room temperature (RT) for up to 5 days [25,26]. DNA is very stable molecule; however, with respect to extracting DNA from saliva held at RT for any length of time, there are two issues. First, when measuring the quantity and quality of DNA spectrophotometrically, the measurement technique does not differentiate between human and microbial DNA. Bacteria load and growth in specimens held at RT raise the possibility that the amount of microbial DNA in the extracted DNA is rising over time in proportion to bacteria growth. Second, bacterial DNAses can degrade human DNA, raising the possibility that saliva samples held at RT for varying lengths of time would yield lower quantities of human DNA suitable for determination of polymorphisms. In Study 3, saliva sam-ples were held at RT for up to 5 days so the effects of this sample treatment on DNA quality, quantity, and genotyp-ing could be observed.
Study 4: Do archived saliva samples that have been exposed to multiple freeze-thaw cycles yield sufficient quantity and quality DNA for genetic analyses?
Saliva samples that have already been assayed for multi-ple analytes and archived have often been subjected to multiple freeze-thaw cycles. Levels of certain salivary steroid hormones (e.g., cortisol, progesterone) and pro-tein biomarkers (e.g., alpha-amylase, immunoglobulin A) show stability over the repeated freeze-thaw cycles in pilot studies [25-28]. However, the extraction of DNA
from saliva may be decreased due to freeze-thaw cycle-related damage to DNA or enhanced by the effects of freeze-thaw cycles on the breakdown of cellular materi-als. Therefore, saliva samples that have been archived after multiple freeze-thaw cycles may yield different quantity and quality DNA. In Study 4, we explore this possibility.
Study 5: When oral fluids are collected from specific areas in the mouth associated with different salivary glands, is there a difference in DNA quality or quantity?
Whole saliva is a composite derived from oral fluids secreted by many salivary glands. The largest glands are the parotid (located upper posterior area of oral cavity), submandibular (lower area between cheek and jaw), and sublingual (under tongue). Some oral fluid also comes from the serum via the crevicular fluid (area between teeth and gums) or via mucosal damage and by leakage. Each type of gland secretes fluid with characteristic composition and properties [29]. The contribution each source gland makes to the overall“oral fluid pool”is variable; conse-quently, the composition of the saliva exhibits consider-able variation. For instance, mucins make saliva viscous, elastic, and sticky to protect tooth enamel against wear and encapsulate microorganisms. These glycoproteins are not present in oral fluid secreted by the parotid gland. Under resting conditions, minimal fluid contribution from the parotid gland occurs and the levels of mucins in saliva will be high (consequentially, specimens will be more vis-cous). However, after stimulation, saliva flow from the par-otid gland (e.g., in response to autonomic nervous system activation) will dilute the concentration of mucins and specimens will be less viscous [29].
Methods
Participants and Design
The following five studies were planned in compliance with the guidelines of the Helsinki Declaration. The proto-col and procedures involving healthy participants were reviewed and approved by the Penn State University insti-tutional review board, and informed consent was obtained from all participants.
Study 1: Ten healthy adults donated a bolus sample (2 × 2 ml) of whole saliva over 10 minutes. Following the recommendations of Granger and colleagues [17], samples were collected using the passive drool technique. Briefly, participants were asked to imagine that they were chewing their favourite food, move their jaws as if they were chew-ing that food, and gently force the poolchew-ing saliva generated through a short plastic drinking straw into a polypropylene collection vial (2.0 ml). After collection, samples were vor-texed (mixed) and aliquoted into separate cyrogenic sto-rage vials in volumes of .10, .25, .50, and 1.0 ml. Samples (n= 40) were stored frozen at -20°C until extraction and assay.
Study 2: Ten healthy adults donated a bolus sample (5 ml) of whole saliva. After collection, samples were vor-texed (mixed) and aliquoted into five separate 2 ml centri-fuge tubes in volumes of .50 ml. A different collection device (1) BD hydrocellulose microsponge (BD Medical-Ophtalmic Systems, Waltham, MA, USA), (2) Richmond cotton rope (Richmond Dental, Charlotte, NC, USA), (3) Sarstedt synthetic pledget (Sarstedt AG & Co, Nümbrecht, Germany), and (4) Salimetrics synthetic swab (Salimetrics LLC, State College, PA, USA) was submerged into each aliquot for 3 minutes. Saliva was expressed from the devices by centrifugation (1500 g) for 15 min. Saliva sam-ples (n= 50) were stored frozen at -20°C until the day of extraction.
Study 3: Ten healthy adults donated a bolus sample (3 ml) of whole saliva. After collection, samples were vor-texed (mixed) and aliquoted into five separate volumes of .50 ml. One aliquot was frozen at -20°C immediately thereafter and served as an “untreated” control. The remaining four aliquots were held at room temperature (RT, 18-22°C) and frozen after 24 hrs, 48 hrs, 72 hrs, or 120 hrs (5 days). At the conclusion of the 5-day period, all samples (n= 50) remained stored frozen at -20°C until the day of extraction.
Study 4: Ten healthy adults donated a bolus sample (3 ml) of whole saliva by the passive drool technique. After collection, samples were vortexed (mixed) and ali-quoted into five separate volumes of .50 ml in 2.0 ml cryogenic vials. One aliquot was extracted immediately without freezing and served as an “untreated”control. The remaining 4 aliquots were exposed to 1, 2, 4 or 6 freeze-thaw cycles. The duration of each “freeze” cycle was 45 min at -20°C and each“thaw”cycle was 45 min
at RT. On the final freeze-thaw cycle for each condition, samples were left frozen at -20°C until the day of extraction.
Study 5: Ten healthy adults first donated .50 ml of whole saliva by the passive drool technique into a 2 ml vial. Then, each participant placed hydrocellulose micro-sponges (BD Medical-Ophtalmic Systems, Waltham, MA, USA)simultaneouslyin three different areas of the mouth for 5 min. Devices were placed under the tongue to absorb oral fluid produced in the sublingual salivary gland area, between the lower left cheek and gum to collect oral fluid from the submandibular salivary gland area, and also between the upper right cheek and gum in the rear of the mouth by the jaw hinge to gather oral fluid from the paro-tid salivary gland area. Upon removal from the mouth, participants sealed the devices in a 2 ml cyrovial, and the samples were stored at -80°C until assay. After a 10 min wait period, the same participants placed 1 × 4 cm absor-bent synthetic oral swabs (Salimetrics LLC, State College, PA, USA)simultaneouslyin the three different areas of the mouth listed above for 5 min. Upon removal, each swab was sealed in a polypropylene carrier tube and stored at -80°C until assay. The order of device use (i.e., micro-sponge and then oral swab, or visa versa) was counterba-lanced among participants. Sample volume recovery was measured when transferring sample into extraction tube. Saliva samples (n= 70) were stored frozen at -20°C until the day of extraction.
DNA Extraction
warm TE (10 mM Tris, 1 mM EDTA) buffer (for extended storage), and samples were stored at -20°C. DNA quality and quantity were estimated by measuring the absorbance of the sample at wavelengths 260 nm and 280 nm using a spectrophotometer (NanoVue Spectrophotometer, GE Healthcare). Nucleic acid absorbs ultraviolet light (UV) with an absorption peak at 260 nm, whereas proteins with aromatic side chains have an absorption peak at 280 nm. An optical density of 1 at 260 nm corresponds to about 50 ng/μl of double-stranded DNA, whereas the 1.8 or higher 260/280 nm ratio indicates that the DNA sample is relatively free from protein contamination (the acceptable range is 1.5-2.0). After the NanoVue measurements, the DNA samples were diluted to a final concentration of 15 ± 5 ng/μl for the genetic analyses. DNA samples were stored frozen until the day of assay.
After extracting and measuring the DNA recovered in Study 2, it was hypothesized that a large percentage of the samples’nucleic acid content was retained in the absor-bent devices. An“adhered cell”modified extraction techni-que was developed in effort to recover the remaining DNA in the collection devices. The“dry”collection devices, which had been re-frozen at -20°C following the centrifu-gation step as presented above, were then retrieved and used for subsequent analyses. The DNA in the collection devices was recovered by adding the 350μl of lysate solu-tion (with .9 U proteinase K) onto the device. After 1 hour of incubation at 56°C the collection device was centrifuged and the resulting filtrate solution used to complete the extraction process, taking up the procedure at the protein precipitation step and completing as described previously.
Genotyping 5-HTTLPR
Polymerase chain reaction (PCR) was used according to Wendland et al. [33] with the HotStar Taq DNA-polymer-ase kit (Qiagen) applying .25 U enzyme in a total volume of 10μl, and 10-20 ng genomic DNA. Thermocycling was initiated by a 15 min 95°C denaturation step, followed by 35 cycles of 94°C 1 min, 65°C 30 sec, 72°C 1 min, and a 10 min 72°C final extension (Perkin Elmer 9700 Thermal Cycler). The VNTR was determined by capillary electro-phoresis using a 3130xl Genetic Analyzer to separate the 469 bp PCR product of the S allele from the 512 bp PCR product of the L allele. To prepare for the electrophoresis analysis, 1μl PCR product was dissolved in formamide loading solution with GeneScan Rox size standard in a total volume of 10μl and heated at 95°C for 5 min, fol-lowed by at least 1 min at -20°C. For data analysis, Gene-Marker®HID software was used; results are reported for the 5-HTTLPR as S/S, S/L, and L/L genotype groups. The genotyping procedure was carried out at the Nucleic Acid and Protein Core Facility of the Children’s Hospital of Phi-ladelphia Research Institute with lab staff blind to the sam-ple data.
Genotyping COMT Val158Met
A 5’nuclease assay was used for the COMT Val158Met SNP (rs4680) with a pre-designed TaqMan kit (C_25746809_50, Applied BioSystems) and 10-20 ng of genomic DNA. The amplification conditions were: 2 min at 50°C and 10 min at 95°C followed by 40 cycles of 15 sec at 92°C and 90 sec at 60°C in ABI Prism®7500 (Applied Biosystems). Allelic discrimination analysis was performed using the Sequence Detector Systems software; results are reported in three COMT genotype groups: Met/Met, Val/ Met, Val/Val. The genotyping procedure was performed at the Mitotyping Technologies Laboratory (State College, PA) with lab staff blind to the sample descriptions.
In each study the reference genotypes of the participants were obtained from the .50 ml whole saliva samples col-lected by the passive drool technique and stored under the control condition, i.e., frozen within half an hour of the collection and thawed only once on the day of DNA extraction.
Results and Discussion Study 1
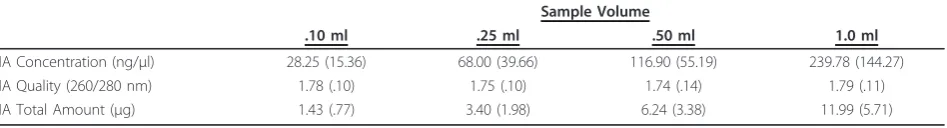
In the first study comparing different volume of whole sal-iva one-way repeated measure ANOVAs were computed with sample volume (.10, .25, .50, and 1.0 ml) as a 4-level independent variable. DNA concentration (ng/μl) and the 260/280 nm ratio were the dependent measures. An out-lier greater than 3SDfrom the mean was removed from the 1.0 ml condition. Table 1 contains the means and stan-dard deviations for the DNA quantity and quality at each sample volume. A linear contrast was computed followed bya prioricomparisons (t-tests) to decompose the nature of the effect of sample volume.
DNA Quantity and Quality
Results revealed significant effects of sample volume on DNA quantity,F(3, 24) = 31.36,p<.001. The linear con-trast was significant,F(1, 9) = 7.02,p< .05.A priori com-parisons (t-tests, one-tailed) revealed that DNA concentration was lower in the .10 ml sample than in the .25 ml sample,t(9) = 4.99,p< .001; lower in the .25 ml sample than in the .50 ml sample,t(9) = 3.42,p< .01; and lower in the .50 ml sample than in 1.0 ml,t(8) = 6.45,p< .001. By contrast, the main effect of volume on DNA qual-ity was not significant,F(3, 24) = 1.58,ns. As can be seen in Table 1, even with only .10 ml of whole saliva in the specimen, on average, the DNA extracted exceeded 20 ng/ μl concentration (1μg amount) and the quality of the spe-cimen was acceptable.
Genotyping
the following: all samples from the .10 ml and 1.0 ml conditions, 8/10 of the .25 ml samples, and 9/10 of the .50 ml samples were genotyped successfully in the first run. The 3 samples which needed repetition were suc-cessfully genotyped in the second run using 40-60 ng DNA. For 5-HTTLPR, the rate of successful identifica-tion was 100% in the first genotyping run.
Whole saliva samples with volumes ofat least100μl were sufficient to extract good quantity and quality DNA to make accurate determinations of genotypes for repre-sentative SNP and VNTR polymorphisms. Based on sensi-tive genotyping methods using 10 ng DNA per polymorphism, the DNA samples obtained from 100μl of whole saliva are sufficient - on average - for genotyping more than 100 candidate polymorphisms. However, we have to note that the lowest DNA concentration was 9.9 ng/μl (total DNA amount .50μg) among the 100μl sam-ples, hence this sample can be used only for 25-50 geno-typing reactions. The total DNA amount isolated fromat least250μl of whole saliva can be sufficient for whole gen-ome analyses requiring 1.5-3μg DNA. However, because of the variance among samples (the mean DNA amount was 3.4μg at the 250μl samples, but ranging from .9μg to 7.4μg), we suggest to collect at least 500μl (.50 ml) of whole saliva for GWA studies (the mean DNA amount was 6.2μg at the 500μl samples, ranging from 1.5μg to 12.4μg).
Study 2
In the second study assessing the effects of different col-lection devices the volume recoveries - as measured when transferring the saliva filtrate to the extraction tube - were, on average, .36 ml (SD= .03) for hydrocellulose micro-sponge, .35 ml (SD= .03) for the cotton rope, .39 ml (SD= .12) for the synthetic pledget; and .42 ml (SD= .02) for the synthetic swab. One-way repeated measure ANO-VAs were computed with collection device type as a 5-level independent variable separately for DNA concen-tration (ng/μl) and 260/280 nm ratio. Planneda priori comparisons (t-tests) tested the difference between whole saliva (control) and each individual device.
DNA Quantity
There was a main effect of collection device/method on DNA concentration, F (4, 36) = 15.83,p < .0001. On
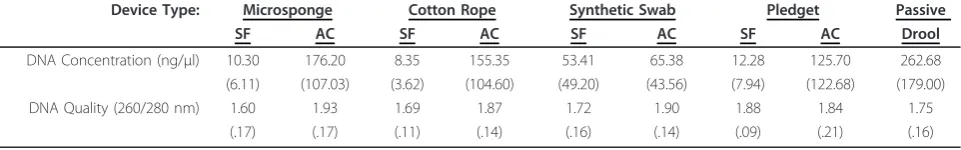
average, the concentration of DNA extracted from whole saliva (M= 256.2 ng/μl,SD= 188.24) was signifi-cantly higher than the average level extracted from sal-iva collected with the microsponge (M = 10.30 ng/μl, SD = 6.11),t (9) = 4.17,p < .01; than the cotton rope (M = 8.35 ng/μl, SD= 3.62), t(9) = 4.21,p< .01; than the pledget (M = 12.80 ng/μl, SD= 7.94),t(9) = 4.23, p< . 01; and the synthetic swab (M= 53.41 ng/μl, SD= 49.20), t(9) = 3.47,p< .01. The levels obtained among the specific absorbent devices (hydrocellulose micro-sponge, cotton rope, pledget, and synthetic swabs) did not significantly differ from one another. Also, there was no evidence that sample volume recovered from the devices was associated with the concentration of the DNA extracted.
DNA Quality
In the saliva filtrate there was also a main effect on the 260/280 nm ratio,F(4,36) = 7.02,p< .0001. The average 260/280 nm ratio in sample extracted from whole saliva (M= 1.75,SD= .16) was significantly higher than from the hydrocellulose microsponge filtrate (M= 1.60,SD= .17),t(9) = 3.50,p< .01. The pledget filtrate yielded the highest quality DNA (M= 1.88,SD= .09,t(9) = -2.20,ns), whereas the average 260/280 nm ratio of filtrates from cotton rope (M= 1.69,SD= .11,t(9) = .96,ns) and syn-thetic swab (M = 1.72,SD= .16,t(9) = 1.63,ns) were similar to that of the whole saliva.
Genotyping
Genotype groupings at the two polymorphisms were: COMT: Val/Met (n = 6), Val/Val (n= 4); 5-HTTLPR: S/S (n = 3), S/L (n= 4), L/L (n = 3). Despite the sig-nificant differences in DNA quantity by collection method, there was 100% accuracy in the determination of COMT Val158Met polymorphism within each sub-ject across collection device type, and there was only one misgenotyping at the 5-HTTLPR (S/L instead of L/L). All samples except one from the pledget filtrates yielded good genotype calls in the first genotyping run at the COMT SNP; the sample which needed repeti-tion was successfully genotyped in the second run. For 5-HTTLPR, the genotyping success rate of the first genotyping run was 100% for whole saliva, cotton rope and pledget filtrate samples. There was one non-deter-mination for the microsponge filtrates, and the
Table 1 Study 1: Means (Standard Deviations) of DNA sample characteristics isolated from different volumes of whole saliva
Sample Volume
.10 ml .25 ml .50 ml 1.0 ml
DNA Concentration (ng/μl) 28.25 (15.36) 68.00 (39.66) 116.90 (55.19) 239.78 (144.27)
DNA Quality (260/280 nm) 1.78 (.10) 1.75 (.10) 1.74 (.14) 1.79 (.11)
DNA Total Amount (μg) 1.43 (.77) 3.40 (1.98) 6.24 (3.38) 11.99 (5.71)
misgenotyping mentioned above occurred with one of the synthetic swab filtrates.
As can be seen in Table 2, after extracting DNA from the saliva passed through the devices (i.e., the saliva fil-trate), the quantity of DNA recovered was very low com-pared to the whole saliva sample control. The“adhered cell”hypothesis was confirmed by the results of the modi-fied extraction, as the quantity and quality of the DNA samples extracted from the adhered cells were comparable to that of the whole saliva samples (Table 2). More nota-bly, all of these samples could be accurately genotyped for the COMT SNP in the first genotyping run. For each spe-cimen, a percentage of DNA extracted from the collection device (i.e., adhered cell) was computed. On average, the percentage of DNA retained in each device was 91.34% for the hydrocellulose microsponge, 92.32% for the cotton rope, 86.74% for the pledget, and 53.91% for the synthetic swab. Table 2 presents the descriptive data for the DNA extracted via the Saliva Filtrate and Adhered Cell procedures.
When saliva is collected using absorbent devices, a con-siderable portion of the nucleic acid content is retained in the absorbent devices. The DNA retained in collection devices studied here can be obtained using a secondary extraction protocol. Despite this phenomenon, DNA extracted from saliva filtrate was sufficient to accurately call the COMT Val158Met polymorphism in every condi-tion, and detection of the 5-HTTLPR in almost every condition.
Study 3
In the third study analyzing the effect of room tempera-ture storage one-way repeated measure ANOVAs were computed with time stored at RT prior to freezing as a 5-level independent variable separately for DNA concentra-tion and 260/280 nm ratio. A planned comparison tested the linear effect of time, anda prioricontrasts (t-tests) compared the control condition (frozen immediately) to each individual time point (24, 48, 72, and 120 hrs). DNA Quantity and Quality
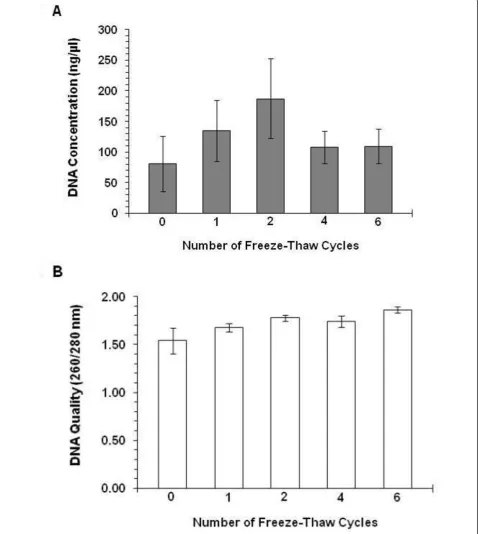
The main effect of storage at RT on DNA concentration was not significant,F(4, 36) = .94,ns. By contrast, there was a significant main effect of time at RT on the 260/280
nm ratio, F (4, 36) = 11.40,p < .0001 (see Figure 1). On average, the control condition (frozen immediately, no storage at RT) had a lower 260/280 nm ratio (M= 1.61, SD= .19) than samples stored at RT for 24 hrs (M= 1.78, SD= .07), 48 hrs (M= 1.82,SD= .09), 72 hrs (M= 1.89, SD= .17), or 120 hrs (M= 1.86,SD= .09),ts (9) = 3.34 to 4.08,ps < .01. The linear contrast was significant,F(1, 9) = 16.59,p< .01, indicating that as hours at RT increased, the 260/280 nm ratio tended to increase.A priori compari-sons (t-tests, one-tailed) revealed the RT-related increases in the 260/280 nm ratio were more pronounced between the control and 24 hrs, (t(9) = 3.33,p< .01), and between the 24 hrs and 48 hrs, (t(9) = 2.15,p< .05) time points, and less pronounced between the 48 hrs to 72 hrs (t(9) = 1.93,p< .05), and between 72 hrs to 120 hrs (t(9) = 1.01, ns) intervals.
Genotyping
The genotypes at the studied polymorphisms were: COMT Met/Met (n= 2), Val/Met (n= 5), Val/Val (n= 3); 5-HTTLPR S/S (n= 1), S/L (n = 5), L/L (n= 4). The geno-typing success rate of the first run was 100% for the 5-HTTLPR, whereas 7 samples out of the 50 needed repe-tition at the COMT SNP (successfully determined sample ratios in the first genotyping run were: frozen immediately: 8/10; frozen 24 hrs: 8/10; frozen 48 hrs: 8/10; frozen 72 hrs: 10/10; frozen 120 hrs: 9/10). All samples yielded accurate genotype calls in the second run.
Consistent with the literature documenting the stability of nucleic acids, we observed that saliva samples could be held at RT for many days without compromising the usability to analyze candidate gene polymorphisms. Sto-rage of saliva samples at RT prior to freezing, similar to sending samples through the mail unrefrigerated, for up to 5 days did not influence the accuracy of COMT Val158-Met or 5-HTTLPR genotyping. The success rate of the first genotyping run was not associated with the time sam-ples were held at RT, and probably reflects technical issues (e.g., pipetting problem at the PCR).
Study 4
In the fourth study assessing the effect of multiple freeze-thaw cycles one-way repeated measure ANOVAs were computed with number of freeze-thaw cycles as a
Table 2 Study 2: Means (Standard Deviations) of DNA sample characteristics obtained comparing different collection devices and passive drool (control)
Device Type: Microsponge Cotton Rope Synthetic Swab Pledget Passive
SF AC SF AC SF AC SF AC Drool
DNA Concentration (ng/μl) 10.30 176.20 8.35 155.35 53.41 65.38 12.28 125.70 262.68 (6.11) (107.03) (3.62) (104.60) (49.20) (43.56) (7.94) (122.68) (179.00)
DNA Quality (260/280 nm) 1.60 1.93 1.69 1.87 1.72 1.90 1.88 1.84 1.75
(.17) (.17) (.11) (.14) (.16) (.14) (.09) (.21) (.16)
5-level independent variable separately for DNA concen-tration and 260/280 nm ratio. A planned comparison tested the linear effect, and a priori comparisons (t-tests) compared the no freeze-thaw cycle condition to each exposure condition (1, 2, 4, and 6 freeze-thaw cycles).
DNA Quantity and Quality
Freeze-thaw conditions had a main effect on both DNA concentration,F(4, 36) = 2.86,p< .05 and DNA quality,F (4, 36) = 3.30,p< .05. However, the linear contrast for DNA quantity was not significant; the main difference came from the lower DNA concentration of the extracted immediately samples compared to the samples exposed to one or two freeze-thaw cycles (but not to the 4 or 6 freeze-thaw cycles samples, see Figure 2A). In terms of DNA quality, the linear contrast was significant,F(1, 9) =
5.39,p< .05. On average, the 260/280 nm ratio was com-parable in samples extracted immediately without a freeze-thaw cycle (M = 1.54,SD= .42), and in samples exposed to a single freeze-thaw cycle (M= 1.67,SD= .14), t(9) = 1.13,ns. Samples with one or fewer freeze-thaw cycle exposure yielded lower 260/280 nm ratio on average (M= 1.61,SD= .25) than samples exposed to 2 or more freeze-thaw cycles (M= 1.79,SD= .07),t(9) = 2.47,p< .05. DNA quality was not statistically different in samples exposed to 2, 4, or 6 freeze-thaw cycles (see Figure 2B). Genotyping
All 3 genotypes were represented at both polymorphisms: COMT Met/Met (n= 1), Val/Met (n= 6), Val/Val (n= 3); 5-HTTLPR S/S (n= 5), S/L (n= 3), L/L (n = 2). The determination of 5-HTTLPR and COMT Val158Met poly-morphism was not affected by the number of freeze-thaw
cycles or by the 260/280 nm ratio values; all samples from the same individual gave identical results. The genotyping success rate of the first run was 100% at the 5-HTTLPR, whereas 6 samples out of the 50 needed repetition at the COMT SNP (all the control, 4 and 6 freeze-thaw cycle samples gave good quality signals in the first run but 30% of the 1 and the 2 freeze-thaw cycle samples did not, these samples were successfully genotyped in the second run).
The effects of freeze-thaw cycles on saliva samples were more pronounced for the quality of DNA extracted from archived specimens. On average, the ratio of DNA to large molecule contaminants was enhanced by freezing and thawing the sample. The lower 260/280 nm ratio and the lower DNA yield of the samples extracted immediately compared to that of the frozen samples were probably due to the pellet formation after centrifugation, because many times the pellets in unfrozen saliva were very loose, and the supernatant was very viscous and thick. As a result of incomplete separation during centrifugation, some of the cell fraction from the unfrozen samples was lost when the samples were decanted. However, the results of the genetic analyses were unaffected (all the extracted immediately samples were genotyped successfully in the first run). Overall, neither the quantity of DNA extracted nor the genotype determinations were systematically influenced by exposure to freeze-thaw conditions.
Study 5
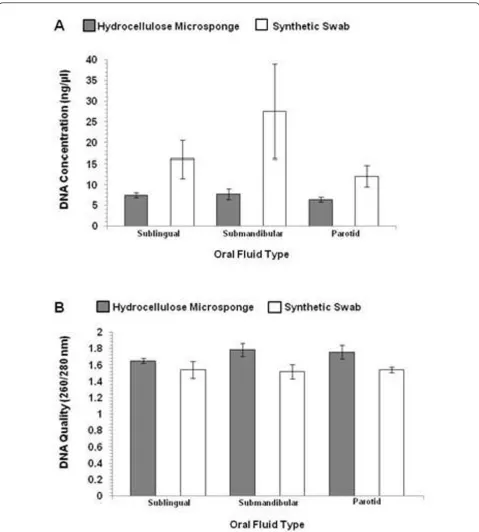
In the last study comparing sampling locations in the mouth the volume recoveries for the microsponge condi-tion were, on average: sublingual .26 ml (SD= .08), parotid .19 ml (SD= .11), and submandibular .16 ml (SD= .13). For the synthetic swab volume recoveries were, on aver-age: sublingual .92 ml (SD= .47), parotid .49 ml (SD= .27), and submandibular .67 ml (SD= .44). A series of 2 (hydrocellulose microsponge vs. synthetic swab) by 3 (sampling location: sublingual, parotid, submandibular) repeated measures ANOVAs were computed separately for DNA concentration and the 260/280 nm ratio.
DNA Quantity and Quality
The effect of device type on DNA concentration of the sal-iva filtrates was not significant,F(1, 9) = 3.64,ns, but there was a main effect of device type on DNA quality, F(1, 9) = 6.85,p< .05 (Figure 3). Given the findings for Study 2, this redundant observation is not described in any further detail.
Genotyping
All 3 genotypes were represented at both polymorphisms: COMT Met/Met (n= 2), Val/Met (n= 4), Val/Val (n= 4); 5-HTTLPR S/S (n= 2), S/L (n= 5), L/L (n= 3). The geno-typing success rate was 98.6% for both polymorphisms, with one sample out of 70 giving no result.
The findings of collection device effectiveness at differ-ent selected oral sampling locales are consistdiffer-ent with the
findings in Study 2 regarding collection devices. That is, Study 5 confirms that the synthetic swab gives a greater recovery of DNA from the saliva filtrate than the micro-sponge. This could be directly related to the fact that the synthetic swab collects a larger amount of oral fluid which can then be used for extraction. The collection devices for Study 5 were not extracted using the“adhered cell”extraction developed for Study 2 due to the similar-ity of the observations for the initial extraction noted. As expected, oral sampling location does not significantly affect the quantity or quality of DNA recovered (per each device evaluated). As in the previous studies, the quantity of DNA which was recovered is still sufficient to perform multiple genotyping procedures. Genotyping of both the COMT rs4680 and 5-HTTLPR VNTR polymorphisms was unaffected by the study conditions.
Conclusions
To summarize, these experiments revealed several note-worthy findings. First, whole saliva samples with volumes ofat least100μl were sufficient to extract good quality and quantity DNA. Second, when saliva is collected via absorbent devices, the majority of the nucleic acid content remains in the device and is not expressed in the saliva fil-trate. It is important to note that the nucleic acid retained in these devices can be recovered with a follow-up extrac-tion procedure. Third, the effects of saliva storage at room temperature (for up to 5 days), repeated freeze-thaw cycles (up to 6 cycles), and sampling different oral fluid types on DNA extraction from saliva were negligible. Finally, across the conditions studied, the DNA extracted from saliva samples was sufficient to consistently determine genotypes for representative SNP (COMT Val158Met) and VNTR (5-HTTLPR) polymorphisms. Since PCR-based candidate gene analyses usually require 5-10 ng of DNA per poly-morphism, the lowest DNA concentration samples could be still used for determination of 20-50 polymorphisms. Collectively, these observations serve to raise awareness in the scientific community that a number of genetic poly-morphisms can be determined from saliva specimens that have already been assayed and stored at -20 or -80°C. To do so, of course, would require appropriate ethical review and approval. Also, the cell pellet of the same saliva sam-ple can be used for genetic analyses in parallel to salivary biomarker analysis conducted from the supernatant, redu-cing the cost and time of collecting biological specimen from the study participants.
average amount of DNA per 1 ml saliva calculated from the samples we stored under the control condition (i.e., frozen within half an hour of the collection) to published data of other research groups using whole saliva mixed
with cell lysis buffer at the time of collection, our results (ranging from 11.99μg/ml to 26.67μg/ml) represented the lower end of the range, as the reported average DNA amounts in pilot studies vary from 11.4μg/ml [2] to 77.4
μg/ml [3], whereas in large scale studies the calculated total DNA per 1 ml saliva is between 23-42 μg/ml [4,34,35]. It is interesting to note that the total amount of DNA obtained from saliva samples shows huge variability
both under experimental laboratory settings (e.g., 155 ± 103μg per 2 ml saliva [3]) and in epidemiological studies (e.g., 92 ± 74μg per 4 ml saliva from a sample of 555 adults [34]).
Investigators interested in the possibility of including DNA analyses in current or future projects, who are using absorbent materials (sponges, pledgets, swabs, ropes) to collect saliva specimens, should be warned that they are discarding the majority of the cells needed to extract nucleic acids when they remove the saliva filtrate and discard the collection device into biohazard waste. Given the expense of sample collection, particularly in high-risk or special populations, investigators may wish to consider storing the collection devices (and the cell fraction contained therein) to extract DNA from it.
Researchers should be pleased to know that DNA can be obtained from simple and cost-effective collection techniques already employed in the field. That is, even if specimens have not been obtained using devices specific for the collection, stabilization, and transportation of DNA, they can be still used for determination of candi-date gene polymorphisms using sensitive genotyping methods. Sufficient quality and quantity DNA can be recovered even from very small samples of saliva, despite thawing and refreezing as part of testing for other ana-lytes, and even if they have been shipped or stored unre-frigerated for (up to 5) days. The success rates of the first genotyping rounds (using 10-20 ng DNA) were 94-98% across the studies at the two representative candidate polymorphisms, with only one sample out of the 260 giv-ing no results at either polymorphisms, suggestgiv-ing that the DNA isolation was unsuccessful only in .38% of sam-ples. All samples retested with higher amounts of DNA (40-60 ng) could be genotyped with repeated measure-ments (see results for COMT SNP), hence the final suc-cess rate reached 99.6%.
This series of studies has several methodological strengths which lead us to have confidence in the conclu-sions reached. However, it is important to note that the conditions under which these specimens were collected are different from the field conditions in which actual specimens would be collected. Therefore, the findings illustrate potential, rather than actual, pitfalls and pro-blems that might be associated with extracting DNA from saliva. Studies in field settings aimed to corroborate these results would be a worthwhile next step. Another important limitation of this study is that only spectro-photometric measurement was used to determine DNA concentration, preventing differentiation between human and bacterial DNA. Therefore, the DNA concentration values of samples left out at room temperatures for days probably do not reflect the true amounts of human DNA. However, the genetic analyses of these (probably con-taminated) samples yielded the same genotypes as those of the control samples (frozen immediately), suggesting that sensitive PCR-methods using human specific pri-mers and/or probes are able to detect human genetic var-iations accurately even from a small fraction of human
DNA. Also, we limited our scope to a single representa-tive SNP and VNTR. Future studies should consider expanding the range of candidate polymorphisms to eval-uate the breadth of these observations.
In this decade, an initiative led by the U.S. National Institute of Craniofacial and Dental Research (NICDR) characterized the salivary proteome. This ground-break-ing effort revealed that as many as 2,000 analytes of potential interest to the behavioral, health, sports, and developmental sciences are present in oral fluids [36]. This library of potential salivary analytes in combination with genetic polymorphisms, offer scientists an opportu-nity to take the lead by testing models that involve multi-level components of biological systems and their relationship to behavior, health, and social forces. As with all major developments, however, many questions remain unanswered and specialized issues exist that require empirical attention. Drawing attention to these issues will increase the probability that DNA, in combi-nation with other salivary analytes, will be more success-fully integrated into the next generation of studies, and in doing so, will set a more solid foundation for the eventual translation of the basic findings into screening, prevention, clinical investigation, and diagnostics.
Acknowledgements
Thanks are due to Becky Zavacky and Jennifer Jewell for technical assistance.
Author details
1Department of Medical Chemistry, Molecular Biology and
Pathobiochemistry, Semmelweis University, Tuzolto utca, Budapest, Hungary.
2Salimetrics LLC, Innovation Boulevard, State College, Pennsylvania, USA. 3
Department of Human Development and Family Studies and Biobehavioral Health, Pennsylvania State University, Henderson South, University Park, Pennsylvania, USA.4Center for Interdisciplinary Salivary Bioscience Research, Johns Hopkins University School of Nursing and Bloomberg School of Public Health, Baltimore, Maryland, USA.
Authors’contributions
ZN participated in data interpretation and manuscript preparation. MG participated in study design and results evaluation. CF performed the statistical analysis. EB participated in study design, graphing, and data work. JS carried out sample collection, treatment, DNA extraction and sample preparation for polymorphism analysis; and participated in results evaluation. DG conceived the study, and participated in project and statistical design, write-up, and coordination. All authors participated in writing and critical review of the manuscript. The final manuscript was approved by all authors.
Competing interests
The studies reported in this paper were conducted while Dr. Granger was on the Faculty in the Department of Biobehavioral Health at Penn State University. In the interest of full disclosure, Douglas A. Granger is Chief Scientific and Strategy Advisor at Salimetrics LLC (State College, PA, USA) and this relationship is managed by the policies of the conflict of interest committee at the Johns Hopkins University School of Medicine.
Received: 16 June 2011 Accepted: 19 December 2011 Published: 19 December 2011
References
association studies: history, rationale, and prospects for psychiatric disorders.Am J Psychiatry2009,166:540-556.
2. Quinque D, Kittler R, Kayser M, Stoneking M, Nasidze I:Evaluation of saliva as a source of human DNA for population and association studies.Anal Biochem2006,353:272-277.
3. Rogers NL, Cole SA, Lan HC, Crossa A, Demerath EW:New saliva DNA collection method compared to buccal cell collection techniques for epidemiological studies.Am J Hum Biol2007,19:319-326.
4. Koni AC, Scott RA, Wang G, Bailey ME, Peplies J, Bammann K,et al:DNA yield and quality of saliva samples and suitability for large-scale epidemiological studies in children.Int J Obes (Lond)2011,35:S113-118. 5. Ochert AS, Boulter AW, Birnbaum W, Johnson NW, Teo CG:Inhibitory
effect of salivary fluids on PCR: potency and removal.PCR Methods Appl 1994,3:365-368.
6. Rudolph KD, Troop-Gordon W, Granger DA:Peer victimization and aggression: moderation by individual differences in salivary cortisol and alpha-amylase.J Abnorm Child Psychol2010,38:843-856.
7. Booth A, Johnson DR, Granger DA, Crouter AC, McHale S:Testosterone and child and adolescent adjustment: the moderating role of parent-child relationships.Dev Psychol2003,39:85-98.
8. El-Sheikh M, Buckhalt JA, Granger DA, Erath SA, Acebo C:The association between children’s sleep disruption and salivary interleukin-6.J Sleep Res 2007,16:188-197.
9. Shirtcliff EA, Coe CL, Pollak SD:Early childhood stress is associated with elevated antibody levels to herpes simplex virus type 1.Proc Natl Acad Sci USA2009,106:2963-2967.
10. D’Souza UM, Craig IW:Functional genetic polymorphisms in serotonin and dopamine gene systems and their significance in behavioural disorders.Prog Brain Res2008,172:73-98.
11. Lachman HM, Papolos DF, Saito T, Yu YM, Szumlanski CL, Weinshilboum RM:Human catechol-O-methyltransferase
pharmacogenetics: description of a functional polymorphism and its potential application to neuropsychiatric disorders.Pharmacogenetics 1996,6:243-250.
12. Chen J, Lipska BK, Halim N, Ma QD, Matsumoto M, Melhem S,et al: Functional analysis of genetic variation in catechol-O-methyltransferase (COMT): effects on mRNA, protein, and enzyme activity in postmortem human brain.Am J Hum Genet2004,75:807-821.
13. Lesch KP, Bengel D, Heils A, Sabol SZ, Greenberg BD, Petri S,et al: Association of anxiety-related traits with a polymorphism in the serotonin transporter gene regulatory region.Science1996, 274:1527-1531.
14. Heils A, Mossner R, Lesch KP:The human serotonin transporter gene polymorphism–basic research and clinical implications.J Neural Transm 1997,104:1005-1014.
15. Nieuw Amerongen AV, Ligtenberg AJ, Veerman EC:Implications for diagnostics in the biochemistry and physiology of saliva.Ann N Y Acad Sci2007,1098:1-6.
16. Herrington CJ, Olomu IN, Geller SM:Salivary cortisol as indicators of pain in preterm infants: a pilot study.Clin Nurs Res2004,13:53-68.
17. Granger DA, Kivlighan KT, Fortunato C, Harmon AG, Hibel LC, Schwartz EB, et al:Integration of salivary biomarkers into developmental and behaviorally-oriented research: problems and solutions for collecting specimens.Physiol Behav2007,92:583-590.
18. Hodgson N, Freedman VA, Granger DA, Erno A:Biobehavioral correlates of relocation in the frail elderly: salivary cortisol, affect, and cognitive function.J Am Geriatr Soc2004,52:1856-1862.
19. Dabbs JM Jr:Salivary testosterone measurements: collecting, storing, and mailing saliva samples.Physiol Behav1991,49:815-817.
20. Gunnar MR, Mangelsdorf S, Larson M, Hertsgaard L:Attachment, temperament, and adrenocortical activity in infancy: A study of psychoendocrine regulation.Dev Psychol1989,25:355-363.
21. Harmon AG, Hibel LC, Rumyantseva O, Granger DA:Measuring salivary cortisol in studies of child development: watch out–what goes in may not come out of saliva collection devices.Dev Psychobiol2007, 49:495-500.
22. Beall CM, Worthman CM, Stallings J, Strohl KP, Brittenham GM, Barragan M: Salivary testosterone concentration of Aymara men native to 3600 m. Ann Hum Biol1992,19:67-78.
23. Flinn MV, England BG:Social economics of childhood glucocorticoid stress response and health.Am J Phys Anthropol1997,102:33-53.
24. Raff H, Homar PJ, Skoner DP:New enzyme immunoassay for salivary cortisol.Clin Chem2003,49:203-204.
25. Gröschl M, Wagner R, Rauh M, Dörr HG:Stability of salivary steroids: the influences of storage, food and dental care.Steroids2001,66:737-741. 26. O’Donnell K, Kammerer M, O’Reilly R, Taylor A, Glover V:Salivary alpha-amylase stability, diurnal profile and lack of response to the cold hand test in young women.Stress2009,12:549-554.
27. Garde AH, Hansen AM:Long-term stability of salivary cortisol.Scand J Clin Lab Invest2005,65:433-436.
28. Booth CK, Dwyer DB, Pacque PF, Ball MJ:Measurement of immunoglobulin A in saliva by particle-enhanced nephelometric immunoassay: sample collection, limits of quantitation, precision, stability and reference range.Ann Clin Biochem2009,46:401-406. 29. Veerman EC, van den Keybus PA, Vissink A, Nieuw Amerongen AV:Human
glandular salivas: their separate collection and analysis.Eur J Oral Sci 1996,104:346-352.
30. de Weerth C, Jansen J, Vos MH, Maitimu I, Lentjes EG:A new device for collecting saliva for cortisol determination.Psychoneuroendocrinology 2007,32:1144-1148.
31. Beltzer EK, Fortunato CK, Guaderrama MM, Peckins MK, Garramone BM, Granger DA:Salivary flow and alpha-amylase: collection technique, duration, and oral fluid type.Physiol Behav2010,101:289-296.
32. Harmon AG, Towe-Goodman NR, Fortunato CK, Granger DA:Differences in saliva collection location and disparities in baseline and diurnal rhythms of alpha-amylase: a preliminary note of caution.Horm Behav2008, 54:592-596.
33. Wendland JR, Martin BJ, Kruse MR, Lesch KP, Murphy DL:Simultaneous genotyping of four functional loci of human SLC6A4, with a reappraisal of 5-HTTLPR and rs25531.Mol Psychiatry2006,11:224-226.
34. Philibert RA, Zadorozhnyaya O, Beach SR, Brody GH:Comparison of the genotyping results using DNA obtained from blood and saliva.Psychiatr Genet2008,18:275-281.
35. Nishita DM, Jack LM, McElroy M, McClure JB, Richards J, Swan GE, Bergen AW:Clinical trial participant characteristics and saliva and DNA metrics.BMC Med Res Methodol2009,9:71.
36. Wong D:Salivary DiagnosticsHoboken: Wiley-Blackwell; 2008.
Pre-publication history
The pre-publication history for this paper can be accessed here: http://www.biomedcentral.com/1471-2288/11/170/prepub
doi:10.1186/1471-2288-11-170
Cite this article as:Nemodaet al.:Assessing genetic polymorphisms using DNA extracted from cells present in saliva samples.BMC Medical Research Methodology201111:170.
Submit your next manuscript to BioMed Central and take full advantage of:
• Convenient online submission
• Thorough peer review
• No space constraints or color figure charges
• Immediate publication on acceptance
• Inclusion in PubMed, CAS, Scopus and Google Scholar
• Research which is freely available for redistribution