R E S E A R C H A R T I C L E
Open Access
Re-evaluating a vision-related quality of life
questionnaire with item response theory (IRT)
and differential item functioning (DIF) analyses
Ruth MA van Nispen
1,2*, Dirk L Knol
2,3, Maaike Langelaan
4and Ger HMB van Rens
1,2,5Abstract
Background:For the Low Vision Quality Of Life questionnaire (LVQOL) it is unknown whether the psychometric properties are satisfactory when an item response theory (IRT) perspective is considered. This study evaluates some essential psychometric properties of the LVQOL questionnaire in an IRT model, and investigates differential item functioning (DIF).
Methods:Cross-sectional data were used from an observational study among visually-impaired patients (n = 296). Calibration was performed for every dimension of the LVQOL in the graded response model. Item goodness-of-fit was assessed with the S-X2-test. DIF was assessed on relevant background variables (i.e. age, gender, visual acuity, eye condition, rehabilitation type and administration type) with likelihood-ratio tests for DIF. The magnitude of DIF was interpreted by assessing the largest difference in expected scores between subgroups. Measurement precision was assessed by presenting test information curves; reliability with the index of subject separation.
Results:All items of the LVQOL dimensions fitted the model. There was significant DIF on several items. For two items the maximum difference between expected scores exceeded one point, and DIF was found on multiple relevant background variables. Item 1‘Vision in general’ from the“Adjustment” dimension and item 24‘Using tools’ from the“Reading and fine work”dimension were removed. Test information was highest for the “Reading and fine work” dimension. Indices for subject separation ranged from 0.83 to 0.94.
Conclusions:The items of the LVQOL showed satisfactory item fit to the graded response model; however, two items were removed because of DIF. The adapted LVQOL with 21 items is DIF-free and therefore seems highly appropriate for use in heterogeneous populations of visually impaired patients.
Keywords:Visual impairment, Vision-related quality of life, Item response theory, Graded response model, Differential item functioning
Background
The detrimental effects of living with vision loss caused by irreversible eye conditions (such as age-related macular degeneration or diabetic retinopathy) are well reported [1]. Research in low vision has primarily focused on older adult populations, because of increased prevalence of age-related eye conditions in older age [2-8]. Those studies used several vision-related quality-of-life questionnaires which allow to assess the disability suffered in daily life
[9,10]. In their review, de Boer et al. reported that the original Low Vision Quality Of Life questionnaire (LVQOL) was one of the best for use in patients with low vision [11,12]; its items are mainly related to difficulties people have in performing certain activities due to their visual disability. In a few studies within the framework of classical test theory, de Boer et al. translated and further validated the Dutch version of the LVQOL [13,14]. In two subsequent studies on the longitudinal outcomes of low vision rehabilitation, additional comments on the validity of the LVQOL were made using item response theory (IRT); however, a calibration-process was not performed [5,15]. In these studies, which were performed on the data
* Correspondence: [email protected] 1
Department of Ophthalmology, VU University Medical Center, Amsterdam, the Netherlands
Full list of author information is available at the end of the article
previously used by de Boer et al. [13,14], it was concluded that on the dimension“Reading and fine work”, the item invariance assumption did not hold over time. The lack of item invariance might have been a redundant phenom-enon if the items had been calibrated in an IRT model beforehand.
Nowadays, IRT models are recommended for evaluating patient-reported outcomes; some questionnaires have been re-evaluated using the Rasch model [9,16-19], which is considered a special case of an IRT model [20]. IRT models represent a collection of statistical models for item analysis in questionnaires that measure a latent construct, i.e. vision-related quality of life, and for estimating indivi-dual scores for the construct, based on responses to the items. Another IRT model is the graded response model (GRM), which is a cumulative probability model. Although the Rasch model has favorable measurement properties, such as statistical sufficiency and specific objectivity, it is often too restrictive, especially for existing tests (developed in the classical test theory framework). For evaluative pur-poses, less constrained models such as the GRM often give a more realistic reflection of the data compared to Rasch or partial credit models [20]. Furthermore, from studies on cognitive processing in which it is investigated how response options are chosen, the GRM seems most appropriate for Likert-type items [21-23]. Another advan-tage of the GRM is that although a normal distribution of the latent variable is assumed, the model is quite robust to slight deviations from normality [24,25].
In an IRT calibration process some steps need to be taken, such as assessing item fit and differential item func-tioning (DIF) [26]. A large proportion of items with DIF is a severe threat to its construct validity and thus to the ability to draw conclusions based on the test scores [27]. Variables that potentially lead to DIF are demographic variables. A DIF analysis allows to examine the relation-ship between item responses and another variable, such as gender or age group, conditional on a measure of the latent construct, i.e. vision-related quality-of-life [28]. Disease-related variables may also lead to DIF, e.g. items may be interpreted differently by patients with different eye conditions, but with a similar disability level. Although vision-related quality-of-life questionnaires measure at the disability level, items could be problematic to patients in different ways due to differences in visual impairment, such as visual acuity or field loss. This could indicate whether there should be separate calibrations for popula-tions with specific eye condipopula-tions [10] or demographic variables.
Since the LVQOL has not yet been calibrated, it remains unknown whether the items appropriately fit an IRT model. Therefore, the present study evaluates some essential psychometric properties of the LVQOL,
including assessing item goodness-of-fit and DIF between subgroups.
Methods
Design and participants
Cross-sectional data were obtained from a longitudinal study: i.e. visually impaired older patients of an observa-tional study on the vision-related quality-of-life effects of two types of low-vision rehabilitation (optometric ser-vice and multidisciplinary rehabilitation serser-vice) [4,10]. Consecutive patients (n = 357) were recruited from the ophthalmology departments of four hospitals in the Netherlands between July 2000 and January 2003. The eligibility requirements for inclusion in the study were referral to either the optometrist or the multidisciplinary low-vision service by an ophthalmologist, age over 50 years, no previous contact with low-vision rehabilitation services, irreversible vision loss, adequate understanding of the Dutch language, and adequate cognitive abilities. Patients who met the inclusion criteria were informed about the study and were invited to participate. From the eligible patients 17.1% did not participate. Baseline data were available of 296 visually impaired patients. Written consent was obtained from all participants. The study protocol was approved by the Medical Ethics Committee of the VU University Medical Center, and conducted according to the principles of the Declaration of Helsinki.
Measurements
Patient characteristics
Demographic variables and other characteristics (e.g. age, gender and main cause of vision loss) were taken from the patients’ hospital charts. Rehabilitation type was either the optometric, or multidisciplinary service. Dis-tance visual acuity was assessed for all participants by their ophthalmologist by projection and with habitual correction for both eyes separately. To enable meaningful computations, decimal visual acuity values were trans-formed to logMAR values, where higher values represent more vision loss, or lower visual acuity values.
Vision-related quality-of-life
removed from the questionnaire [5], therefore this report is based on 23 items.
Validation and statistical analyses
Assessing dimensionality and local independence
Unidimensionality is a critical assumption of IRT. It refers to whether a person’s response to an item that measures a construct is accounted for by the level on that trait, and not by other factors [29]. In a previous study, dimensional-ity of the LVQOL was investigated on baseline data of the low-vision rehabilitation effect study [5]. In summary, an exploratory factor analysis on polychoric correlations and Promax rotation in Mplus version 3.13 was carried out. The model parameters were estimated applying weighted least squares with mean and variance correction (WLSMV). Item 5“Problems reading street name signs” and item 25“Problems doing household tasks”had low factor loadings and interpretation of factors was confusing (both items loaded almost equally on two factors). After removing items 5 and 25, the factor analysis yielded four dimensions:“Mobility”,“Reading and fine work”,“ Adjust-ment”and“Basic aspects”(explained variance 75%). The root mean-square residual, which is an index of global model fit, was satisfactory: i.e. 0.03 and, factor loadings were all higher than 0.40. The Cronbach’s alpha-values for these were 0.84, 0.90, 0.82 and 0.93, respectively.
To further prepare for the IRT analyses, we assessed local independence of items by inspection of possible excess correlation among items in the residual correlation matrix. Local dependence could arise from items with a similar content or wording. Inspection of the residual cor-relations showed that it was highest between items 17 “Reading large print”and 24“Using tools”(-0.11), but the other residual correlations were never higher than 0.09 and were therefore not considered to be a problem. The psychometric properties of the LVQOL dimensions were further assessed with an IRT model.
IRT calibration
In the present study, we used the GRM to evaluate the LVQOL [30], which is a generalization of the two-para-meter logistic model.
In the GRM, the cumulative probability (P*) of responding in categoryjor higher on itemiof a person s with disabilityθs, i.e. the‘underlying’ or ‘latent’
vari-able, is given by
Pij∗(θs) =
exp[αi(θs−βij)]
1 + exp[αi(θs−βij)]
,
with item parametersaias the slope or discrimination parameter and bij as the threshold or difficulty para-meters of itemi. A highai indicates that the response categories differentiate well across disability levels [20]. Each item (i) on (a dimension of) the LVQOL is
described by one ai, and by five bij, which is one less than the number of response categories. The point along the disability continuum at which respondents have a 0.50 probability of endorsing response categoryj or higher of item iis represented by bij. From theP*, the probability of endorsing category j of item i is obtained by
Pij(θs) =P∗ij(θs)−P∗i,j+1(θs).
It is assumed that the prior distribution of the person parameter (θs) is standard normal (mean 0; SD 1) [20]. The item parameters were estimated in MULTILOG by the method of marginal maximum likelihood [31]. Sub-sequently, posterior estimates ofθscan be obtained.
Even after unidimensionality and local independence have been investigated, some items might have remained that do not fit the GRM. Applications of IRT implicitly assume that the model is correct; that is, expected item scores should increase monotonically and the item response model should reflect the data accurately. Although a certain amount of misfit is inherent to every model, considerable misfit should be avoided. Item fit can be examined by comparing model predictions (expectations) and observed data [20]. By using item tests, decisions can be made as to whether it is necessary to remove any items. Therefore, item goodness-of-fit was investigated with an item test by Bjorner et al. [32], which is implemented in SAS [31,32]. This item-test is an extension (generalization) of the item test with dichot-omous response categories which was developed by Orlando and Thissen and is known as the S-X2-test [33,34]. Items were considered as misfitting to the model if p < 0.01.
aibetween subgroups, conditional on the disability level, which reflects subgroup by ability interaction [28]. DIF analyses were performed with software for the computa-tion of statistics involved in IRT likelihood-ratio tests for DIF (IRTLRDIF) by Thissen [36,37]. This approach tests the null hypothesis that ai is equal for two subgroups (absence of non-uniform DIF), yielding a Chi-square (G2) statistic with one degree of freedom, and the null hypoth-esis that the bij is equal (absence of uniform DIF) between subgroups, using five degrees of freedom. IRTLRDIF is based on a hierarchical structure, which means thatbijis tested for uniform DIF, only if the test foraiis not significant. To correct for multiple testing, a p-value < 0.01 was indicated as statistically significant occurrence of DIF.
To gain more insight into DIF items (particularly to examine the magnitude of DIF between subgroups), we calculated differences in expected scores for those sub-groups. The magnitude of DIF was presented as the maxi-mum difference between expected scores. When DIF cannot be resolved, a solution would be to separately esti-mate item parameters for subgroups; those parameters can subsequently be used to estimate the person para-meter (θs) [38]. Another solution is to remove the item. In the present study, items were removed on the basis of the magnitude of DIF which was determined by a large differ-ence (> 1 point) between expected scores on the item; if there was DIF between more than one subgroup variable; or if DIF was present on a relatively large part of the dis-ability continuum. After removing DIF items, the dimen-sions of the LVQOL were re-calibrated and DIF analyses were repeated to see whether other DIF items would resolve. Subsequently,‘test information’was presented for the dimensions of the LVQOL. Test information refers to the range of the underlying construct over which (a dimension of) a test is most useful to distinguish between respondents. Therefore, information represents the relia-bility or measurement precision. The inverse of the square root of the information function is equivalent to the stan-dard error (SE) ofθs[24]. Test information for the sepa-rate dimensions of the LVQOL was analyzed in MULTILOG [31] and the corresponding curves presented. Finally, the reliability coefficient was calculated forθsof the separate LVQOL dimensions (index of subject separa-tion) [39].
Results
Patient characteristics
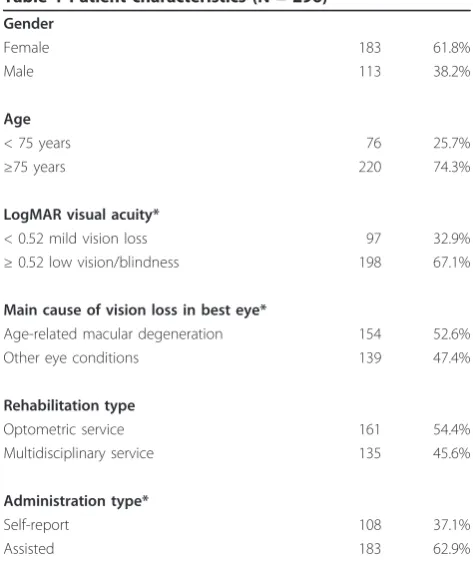
Table 1 presents the characteristics of the patients. Mean age was 78.4 (SD 8.8; range 52-98). Mean log-MAR Visual Acuity was 0.67 (SD 0.39). Besides age-related macular degeneration (53%), the most common other causes of vision loss were diabetic retinopathy, glaucoma and cataract (47%). About 63% of the patients
were assisted by a significant other with administering the LVQOL, i.e. 15.5% by their spouse, 40.9% by family members and 6.5% by a friend, a nurse or someone else.
Item non-response and goodness-of-fit
The item non-response was 4.1% for “Basic aspects” (60 missing responses for 5 items); 4.8% for“Mobility” (71 missing responses for 5 items); 4.1% for“Adjustment” (61 missing responses for 5 items); and 4.8% for“Reading and fine work”(113 missing responses for 8 items). The total item non-response for the LVQOL was 4.5%. All items of the four separate LVQOL dimensions fit the GRM.
Differential item functioning
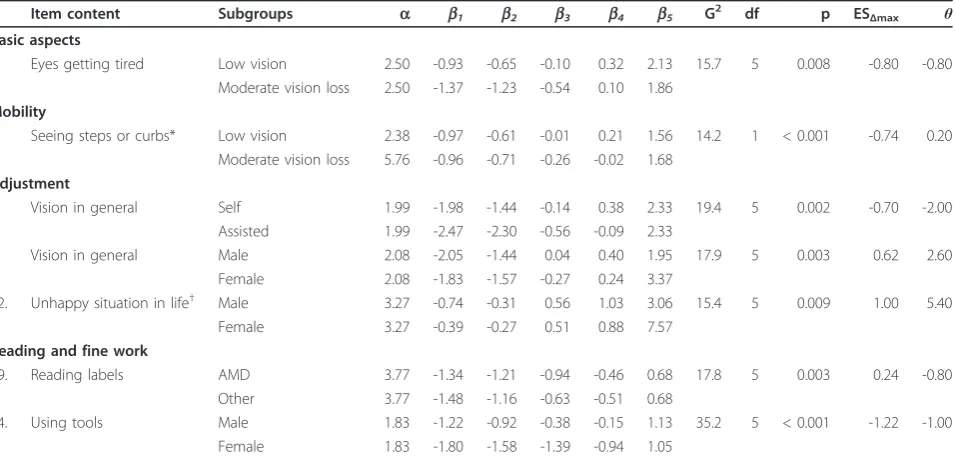
Table 2 presents items with DIF between different sub-groups, meaning that there was interference between item responses of different subgroups at similar disability levels. For example, on the “Adjustment” dimension, item 1 ‘Vision in general’had uniform DIF on two subgroup vari-ables, i.e. gender and administration mode. Patients who self-administered the questionnaire responded lower to this item (reflecting less disability) than patients who were assisted by a significant other, conditional on the disability level. Particularly at the higher extremity of the disability continuum (representing more disability), women responded lower to this item than men. This difference was caused by a small number of responses in the highest
Table 1 Patient characteristics (N = 296)
Gender
Female 183 61.8%
Male 113 38.2%
Age
< 75 years 76 25.7%
≥75 years 220 74.3%
LogMAR visual acuity*
< 0.52 mild vision loss 97 32.9%
≥0.52 low vision/blindness 198 67.1%
Main cause of vision loss in best eye*
Age-related macular degeneration 154 52.6%
Other eye conditions 139 47.4%
Rehabilitation type
Optometric service 161 54.4%
Multidisciplinary service 135 45.6%
Administration type*
Self-report 108 37.1%
Assisted 183 62.9%
category. Furthermore, on the“Reading and fine work dimension”, two items had DIF, i.e. item 19‘Reading labels’(uniform DIF between eye condition subgroups) and item 24‘Using tools, e.g. using a hammer or threading a needle’ (uniform DIF between men and women) to which women responded higher than men, conditional on the disability level.
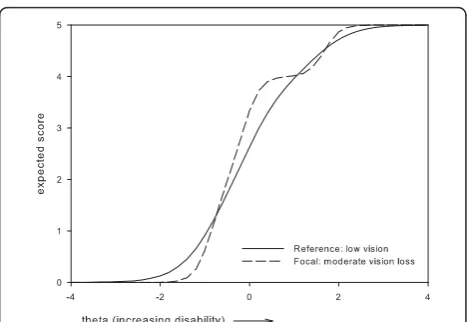
Based on these results, two items which were perceived as most problematic were removed, i.e.: item 1‘Vision in general’and item 24‘Using tools’. Item 1 was removed because it presented with DIF between two subgroups, i.e. administration mode and gender, where the difference in expected item scores remained relatively large along a large part of the disability continuum (Figures 1, 2). For item 24, the maximum difference in expected scores exceeded 1 point between women and men, and, along a large part of the disability continuum (Figure 3). The dif-ference in expected scores on items 3, 7 and 19 was not considered a problem, because differences between expected scores were not extreme, the place of this differ-ence on the disability continuum was near the extremes (Figures 4, 5, 6), and DIF was only found for one subgroup variable per item.
Although most subgroups were comparable on most characteristics, differences were found between the Log-MAR visual acuity subgroups, where patients with low vision/blindness significantly more often received assis-tance by someone to fill out the questionnaire (68%) than patients with mild vision loss (52%; p = 0.006). In
addition, significantly less patients who went to the optometric service needed assistance with filling out the questionnaire (56%) compared to those who received multidisciplinary rehabilitation (70%; p = 0.012). Rela-tively more patients with age-related macular degenera-tion were in the 75+ age category (89%) than patients with other eye-conditions (59%; p < 0.001).
Re-calibration after removing items
Table 3 presents the LVQOL items per dimension, cali-brations and fit statistics without items 1 and 24. All
Table 2 Items with DIF between subgroups of relevant variables
Item content Subgroups a b1 b2 b3 b4 b5 G2 df p ESΔmax θ
Basic aspects
7. Eyes getting tired Low vision 2.50 -0.93 -0.65 -0.10 0.32 2.13 15.7 5 0.008 -0.80 -0.80 Moderate vision loss 2.50 -1.37 -1.23 -0.54 0.10 1.86
Mobility
3. Seeing steps or curbs* Low vision 2.38 -0.97 -0.61 -0.01 0.21 1.56 14.2 1 < 0.001 -0.74 0.20 Moderate vision loss 5.76 -0.96 -0.71 -0.26 -0.02 1.68
Adjustment
1. Vision in general Self 1.99 -1.98 -1.44 -0.14 0.38 2.33 19.4 5 0.002 -0.70 -2.00 Assisted 1.99 -2.47 -2.30 -0.56 -0.09 2.33
1. Vision in general Male 2.08 -2.05 -1.44 0.04 0.40 1.95 17.9 5 0.003 0.62 2.60 Female 2.08 -1.83 -1.57 -0.27 0.24 3.37
12. Unhappy situation in life† Male 3.27 -0.74 -0.31 0.56 1.03 3.06 15.4 5 0.009 1.00 5.40 Female 3.27 -0.39 -0.27 0.51 0.88 7.57
Reading and fine work
19. Reading labels AMD 3.77 -1.34 -1.21 -0.94 -0.46 0.68 17.8 5 0.003 0.24 -0.80 Other 3.77 -1.48 -1.16 -0.63 -0.51 0.68
24. Using tools Male 1.83 -1.22 -0.92 -0.38 -0.15 1.13 35.2 5 < 0.001 -1.22 -1.00 Female 1.83 -1.80 -1.58 -1.39 -0.94 1.05
Person distribution standard normal;a= item discrimination parameter;b= item threshold parameter; G2
= Chi-square statistic; df = degrees of freedom; ESΔmax=
maximum difference in expected scores,θ=person parameter (disability level is presented at which the maximum difference in expected scores was found); AMD = age-related macular degeneration.
* Non-uniform DIF;†After deleting item 1, DIF for item 12 was not statistically significant.
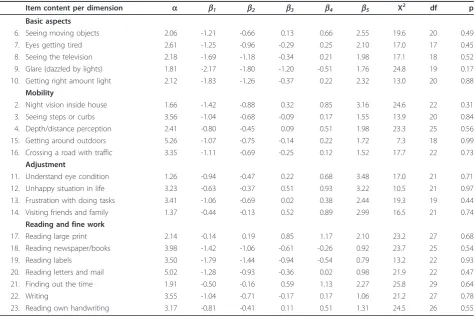
items fit the GRM. The difficulty parameters (b1-b5) for the items which reflect the range of the underlying con-struct was between -2.17 and 2.55 for the“Basic aspects; -1.42 and 3.16 for“Mobility"; -1.06 and 3.48 for“ Adjust-ment”, and between -1.79 and 2.27 for“Reading and fine work”. This means that the LVQOL items show reason-able variability with respect to endorsement of response categories by patients from the whole disability continuum.
DIF analyses were repeated for“Adjustment” without item 1 on the subgroup variable gender. DIF for item 12 resolved at the p < 0.01 level. DIF analyses were repeated for “Reading and fine work” without item 24 on the subgroup variable eye condition. Uniform DIF remained for item 19 (G2(5) = 18.1; p < 0.01) between patients with age-related macular degeneration and patients with other eye conditions. However, the differ-ence in expected scores remained small. Consequently, item 19 was not removed from this dimension.
Figure 7 presents the test information curves of the four dimensions of the LVQOL, providing information about precision of the dimensions across the disability continuum. The dimensions were less precise at the extremes; however, the whole disability spectrum was covered by the dimensions. At the highest point of the information curves, the lowest SEs are calculated. For “Reading and fine work”, the highest information point was 25.0 (SE 0.20 forθs= -0.4); for“Mobility” 18.9 (SE 0.23 for θs = -0.8); for“Basic aspects” 8.2 (SE 0.35 for
θs= -0.8); and for “Adjustment” 8.4 (SE 0.35 for θs=
-0.6). Furthermore, the “Mobility” dimension showed a slight‘information dip’around a θsof 1.0, but was still about equally informative as the “Basic aspects” and “Adjustment”dimensions.
Finally, the indices of subject separation were high for all dimensions: “Reading and fine work” (0.94);“ Mobi-lity” (0.91); “Basic aspects” (0.86); and “Adjustment” (0.83).
Figure 2Uniform DIF on item 1‘vision in general‘between administration mode subgroups.
Figure 3Uniform DIF on item 24‘using tools’between gender subgroups.
Figure 4Non-uniform DIF on item 3‘seeing steps or curbs’ between vision category subgroups.
Discussion
The purpose of this study was to assess some essential psychometric properties of the LVQOL using an IRT model. Special attention was paid to investigating DIF on relevant background variables. All items of the four LVQOL dimensions fit the GRM, also after two items
were removed because of DIF. DIF was found on five items between subgroups of gender, visual acuity, administration modes and eye conditions. However, only item 1 ‘Vision in general’ of the “Adjustment” dimension and item 24‘Using tools’of the“Reading and fine work”dimension were considered to be a problem. Item 1 had DIF between the administration mode sub-groups and gender subsub-groups, where the difference in expected item scores remained relatively large along a large part of the disability continuum. Patients who self-administered the questionnaire responded lower to this item conditional on their disability level than patients who were assisted by a significant other, which was often a relative or spouse (91.3%; n = 183). Wolffsohn et al. found that patients who were assisted by someone reported higher disability levels measured with the LVQOL; they concluded that the subgroup which was assisted with administration had more vision loss and reduced contrast sensitivity than the self-report sub-group, but also suggested that the difference might reflect a negative bias introduced by the patient’s rela-tive [40]. An earlier study in which the psychometric quality of the Vision-related quality of life Core Measure
Figure 6Uniform DIF on item 19‘reading labels’between eye condition subgroups.
Table 3 Item parameter estimates and fit statistics
Item content per dimension a b1 b2 b3 b4 b5 X2 df p
Basic aspects
6. Seeing moving objects 2.06 -1.21 -0.66 0.13 0.66 2.55 19.6 20 0.49
7. Eyes getting tired 2.61 -1.25 -0.96 -0.29 0.25 2.10 17.0 17 0.45
8. Seeing the television 2.18 -1.69 -1.18 -0.34 0.21 1.98 17.1 18 0.52
9. Glare (dazzled by lights) 1.81 -2.17 -1.80 -1.20 -0.51 1.76 24.8 19 0.17 10. Getting right amount light 2.12 -1.83 -1.26 -0.37 0.22 2.32 13.0 20 0.88
Mobility
2. Night vision inside house 1.66 -1.42 -0.88 0.32 0.85 3.16 24.6 22 0.31
3. Seeing steps or curbs 3.56 -1.04 -0.68 -0.09 0.17 1.55 13.9 20 0.84
4. Depth/distance perception 2.41 -0.80 -0.45 0.09 0.51 1.98 23.3 25 0.56
15. Getting around outdoors 5.26 -1.07 -0.75 -0.14 0.22 1.72 7.3 18 0.99
16. Crossing a road with traffic 3.35 -1.11 -0.69 -0.25 0.12 1.52 17.7 22 0.73 Adjustment
11. Understand eye condition 1.26 -0.94 -0.47 0.22 0.68 3.48 17.0 21 0.71
12. Unhappy situation in life 3.23 -0.63 -0.37 0.51 0.93 3.22 10.5 21 0.97
13. Frustration with doing tasks 3.41 -1.06 -0.69 0.02 0.38 2.44 19.3 19 0.44 14. Visiting friends and family 1.37 -0.44 -0.13 0.52 0.89 2.99 16.5 21 0.74
Reading and fine work
17. Reading large print 2.14 -0.14 0.19 0.85 1.17 2.10 23.2 27 0.68
18. Reading newspaper/books 3.98 -1.42 -1.06 -0.61 -0.26 0.92 23.7 25 0.54
19. Reading labels 3.50 -1.79 -1.44 -0.94 -0.54 0.79 13.2 22 0.93
20. Reading letters and mail 5.02 -1.28 -0.93 -0.36 0.02 0.98 21.9 22 0.47
21. Finding out the time 1.91 -0.50 -0.16 0.59 1.13 2.27 25.8 29 0.64
22. Writing 3.55 -1.04 -0.71 -0.17 0.17 1.06 21.2 27 0.78
23. Reading own handwriting 3.17 -0.81 -0.41 0.11 0.51 1.31 24.5 26 0.55
Person distribution standard normal;a= item discrimination parameter;b= item threshold parameter; X2
was assessed in the same visually impaired patient group reported similar results with DIF present on two items [41]. Patients who were assisted had significantly more vision loss (mean logMAR Visual Acuity 0.74; SD 0.43) than patients who self-reported (mean 0.56; SD 0.90); this may explain why patients who were assisted scored higher on the item, conditional on their disability level. Similar to Wolffsohn et al., another plausible explana-tion was the nature of the relaexplana-tionship between the patient and the significant other who assisted with administration. The significant other may have (uncon-sciously) conveyed his/her personal opinion, or the patient’s perception of the characteristics of the signifi-cant other may have prompted a socially-desirable response [42]. Furthermore, DIF on item 1 ‘Vision in general’between women and men was caused by a lack of responses in the highest response category.
There was a higher response to item 24‘Using tools’ (e.g. using a hammer or threading a needle) of the“ Read-ing and fine work”dimension by women than by men, conditional on the disability level. Because the difference in expected item scores was sufficiently large, and along a relatively large part of the disability continuum, it was decided to remove item 24.
A consequence of removing a differentially functioning item is that the psychometric quality of the underlying construct improves, i.e. vision-related quality of life and in particular the“Adjustment”and“Reading and fine work” dimensions. The four and seven remaining items on those dimensions, respectively, fit the GRM and DIF resolved for item 12‘Unhappy with situation in life’. Item 19‘Reading labels’ continued to have DIF, but the difference in expected scores was small. The choice of removing an item with DIF is usually expressed by the difference in logits. A problem with polytomous item responses is that the difference in logits may vary for every threshold
parameter, making the magnitude of DIF difficult to assess. Therefore, the difference in expected item scores was perceived as a helpful interpretation of the DIF magni-tude [38]. Another consequence of improvement of the dimensions“Reading and fine work”and“Adjustment” might be that item invariance across occasions can be assumed. However, after removing item 24‘Using tools’, the assumption of item parameter invariance across time points could still not be maintained for the“Reading and fine work”dimension (data not shown). Consequently, further investigation and confirmation in other longitudi-nal studies may be necessary. In contrast, after removing item 1‘Vision in general’, item invariance was assured across occasions for the“Adjustment”dimension, indicat-ing that the outcome on this dimension can be appropri-ately assessed. A limitation of the present study may be that the subsets on which DIF was investigated were rather small (N < 100 in two subsets). Differences in patient char-acteristics found between subsets may have been caused by limited numbers of patients.
Finally, the test information curves provided insight into the separate dimensions of vision-related quality-of-life. The“Reading and fine work”and“Mobility”dimensions were most informative for differentiating between patients’ disability levels in terms of vision-related quality-of-life.
Conclusion
The items of the LVQOL showed satisfactory item fit to the GRM; however, two items were removed because of DIF. The adapted (Dutch) LVQOL with 21 items is‘ DIF-free’ when relevant subgroups are considered, which means that the psychometric quality of the questionnaire has improved. Consequently, the LVQOL seems highly appropriate for use in heterogeneous populations of visually impaired patients.
List of abbreviations
DIF: Differential item functioning; GRM: Graded response model; IRT: Item response theory; IRTLRDIF: Item response theory likelihood-ratio tests for differential item functioning; LVQOL: Low Vision Quality Of Life questionnaire; WLSMV: Weighted least squares with mean and variance correction.
Acknowledgements
Financial support was provided by: ZonMw-Inzicht (Netherlands Organisation for Health Research and Development-Insight Society, The Hague, Grant no. 943-03-017).
Author details
1Department of Ophthalmology, VU University Medical Center, Amsterdam, the Netherlands.2EMGO+Institute for Health and Care Research, VU University Medical Center, Amsterdam, the Netherlands.3Department of Epidemiology and Biostatistics, VU University Medical Center, Amsterdam, the Netherlands.4Netherlands Institute for Health Services Research (NIVEL), Utrecht, the Netherlands.5Department of Ophthalmology, Elkerliek Hospital, Helmond, the Netherlands.
Authors’contributions
RMAVN drafted the manuscript and performed the statistical analyses; DLK gave advice and performed the statistical analyses, and helped to interpret Figure 7Test information curves for the LVQOL dimensions.
the data; ML helped to draft and revise the manuscript; GHMBVR conceived of the study and its design; helped to draft the manuscript, and approved the final version to be published. All authors read and approved the final manuscript.
Authors’information
RMAVN (PhD) is a psychologist and epidemiologist and has a special interest in the measurement of quality-of-life in the field of low vision. She received the Quality of Care Fellowship (200-2012) from the EMGO+Institute for Health and Care Research. DLK (PhD) is a statistician and is specialized in psychometrics and specifically in item response theory. ML (PhD) is a human movement scientist, epidemiologist and a former occupational therapist and researcher in the field of low vision. GHMBVR (PhD) is a professor of ophthalmology and holds a chair in the field of low vision.
Competing interests
The authors declare that they have no competing interests.
Received: 16 September 2010 Accepted: 2 September 2011 Published: 2 September 2011
References
1. Stelmack J:Quality of life of vision patients and outcomes of low-vision rehabilitation.Optom Vis Sci2001,78:335-342.
2. Klaver CC, Wolfs RC, Vingerling JR, Hofman A, de Jong PT:Age-specific prevalence and causes of blindness and visual impairment in an older population: the Rotterdam Study.Arch Ophthalmol1998,116:653-658. 3. McCabe P, Nason F, Demers TP, Friedman D, Seddon JM:Evaluating the
effectiveness of a vision rehabilitation intervention using an objective and subjective measure of functional performance.Ophthalmic Epidemiol
2000,7:259-270.
4. de Boer MR, Twisk J, Moll AC, Volker-Dieben HJM, de Vet HCW, van Rens GHMB:Outcomes of low vision services using optometric and multidisciplinary approaches: a non-randomized comparison.Ophthalmic Physiol Opt2006,26:535-544.
5. van Nispen RMA, Knol DL, Langelaan M, de Boer MR, Terwee CB, van Rens GHMB:Applying multilevel item response theory to vision-related quality of life in Dutch visually impaired elderly.Optom Vis Sci2007,
84:710-720.
6. Birk T, Hickl S, Wahl HW, Miller D, Kämmerer A, Holz F, Becker S, Völcker HE:
Development and pilot evaluation of a psychosocial intervention program for patients with age-related macular degeneration.
Gerontologist2004,44:836-843.
7. Reeves BC, Harper RA, Russell WB:Enhanced low vision rehabilitation for people with age related macular degeneration: a randomised controlled trial.Br J Ophthalmol2004,88:1443-1449.
8. Hinds A, Sinclair A, Park J, Suttie A, Paterson H, Macdonald M:Impact of an interdisciplinary low vision service on the quality of life of low vision patients.Br J Ophthalmol2003,87:1391-1396.
9. Finger R, Fleckenstein M, Holz F, Scholl H:Quality of life in age-related macular degeneration: a review of available vision-specific psychometric tools.Qual Life Res2008,17:559-574.
10. van Nispen RMA, de Boer MR, van Rens GHMB:Additional psychometric information and vision-specific questionnaires are available for age-related macular degeneration.Qual Life Res2009,18:65-69. 11. de Boer MR, Moll AC, de Vet HCW, Terwee CB, Volker-Dieben HJM, van
Rens GHMB:Psychometric properties of vision-related quality of life questionnaires: a systematic review.Ophthalmic Physiol Opt2004,24:257-273. 12. Wolffsohn JS, Cochrane AL:Design of the low vision quality-of-life
questionnaire (LVQOL) and measuring the outcome of low-vision rehabilitation.Am J Ophthalmol2000,130:793-802.
13. de Boer MR, de Vet HCW, Terwee CB, Moll AC, Volker-Dieben HJM, van Rens GHMB:Changes to the subscales of two vision-related quality of life questionnaires are proposed.J Clin Epidemiol2005,58:1260-1268. 14. de Boer MR, Terwee CB, de Vet HCW, Moll AC, Volker-Dieben HJM, van
Rens GHMB:Evaluation of cross-sectional and longitudinal construct validity of two vision-related quality of life questionnaires: the LVQOL and VCM1.Qual Life Res2006,15:233-248.
15. van Nispen RMA, Knol DL, Neve JJ, van Rens GHMB:A multilevel item response theory model was investigated for longitudinal vision-related quality of life data.J Clin Epidemiol2010,63:321-330.
16. Reeve BB, Hays RD, Chang C-H, Perfetto EM:Applying item response theory to enhance health outcomes assessment.Qual Life Res2007,16:1-3. 17. Massof RW:An interval-scaled scoring algorithm for visual function
questionnaires.Optom Vis Sci2007,84:689-704.
18. Langelaan M, van Nispen RMA, Knol DL, Moll AC, de Boer MR, Wouters B, van Rens GHMB:Visual Functioning Questionnaire: reevaluation of psychometric properties for a group of working-age adults.Optom Vis Sci2007,84:775-784.
19. Lamoureux E, Pesudovs K, Pallant J, Rees G, Hassell JB, Caudle LE, Keeffe JE:
An evaluation of the 10-item Vision Core Measure 1 (VCM1) scale (the Core Module of the Vision-related Quality of Life scale) using Rasch analysis.Ophthalmic Epidemiol2008,15:224-233.
20. Embretson S, Reise S:Item response theory for psychologistsMahwah, NJ: Erlbaum; 2000.
21. Tutz G:Sequential item response models with an ordered response.Brit J Math Stat Psychol1990,43:39-55.
22. van Engelenburg G:On psychometric models for polytomous items with ordered categories within the framework of item response theoryUniversity of Amsterdam, the Netherlands; 1997.
23. Akkermans LMW:Studies on statistical models for polytomously scored test itemsUniversity of Twente, the Netherlands; 1998.
24. Skrondal A, Rabe-Hesketh S:Generalized latent variable modeling: multilevel, longitudinal, and structural equation modelsLondon, UK: Chapman & Hall; 2004, 113.
25. Sass DA, Schmitt TA, Walker CM:Estimating non-normal latent trait distributions within item response theory using true and estimated item parameters.Appl Meas Educat2008,21:65-88.
26. Orlando Edelen M, Reeve BB:Applying item response theory (IRT) modeling to questionnaire development, evaluation, and refinement.
Qual Life Res2007,16:5-18.
27. Crane P, van Belle G, Larson E:Test bias in a cognitive test: differential item functioning in the CASI.Stat Med2004,23:241-256.
28. Teresi J, Fleishman J:Differential item functioning and health assessment.
Qual Life Res2007,16:33-42.
29. Reeve BB, Hays RD, Bjorner JB, Cook KF, Crane PK, Teresi JA, Thissen D, Revicki DA, Weiss DJ, Hambleton RK, Liu H, Gershon R, Reise SP, Lai J, Cella D:Psychometric evaluation and calibration of health-related quality of life item banks. Plans for the Patient-Reported Outcomes
Measurement Information System (PROMIS).Med Care2007,45:S22-S31. 30. Samejima F:Estimation of latent ability using response pattern of graded
scoresPsychometric Monograph Supplement No 17: Richmond, VA: William Byrd Press; 1969.
31. Thissen D:MULTILOG™User’s guide. Multiple, categorical item analysis and test scoring using item response theoryChicago: Scientific Software Inc.; 1991. 32. Bjorner J, Christensen K, Orlando M, Thissen D:Testing the fit of item
response theory models for patient reported outcomes2005 [http://www. isoqol.org/2005ConfAbstracts.pdf], International Society for Quality of Life Research meeting abstracts. The QLR journal, P-151, Abstract #1676. 33. Orlando M, Thissen D:Likelihood-based item-fit indices for dichotomous
item response theory models.Appl Psychol Meas2000,24:50-64. 34. Orlando M, Thissen D:Further examination of the performance of S-X2,
an item fit index for dichotomous item response theory models.Appl Psychol Meas2003,27:289-298.
35. Teresi J, Ocepek-Welikson K, Kleinman M, Cook KF, Crane PK, Gibbons LE, Morales LS, Orlando-Edelen M, Cella D:Evaluating measurement equivalence using item response theory log-likelihood ratio (IRTLR) method to assess differential item functioning (DIF): applications (with illustrations) to measures of physical functioning ability and general distress.Qual Life Res2007,16:43-68.
36. Thissen D:IRTLRDIF v.2.0b: Software for the computation of the statistics involved in item response theory likelihood-ratio tests for differential item functioningChapel Hill, NC: L.L. Thurstone Psychometric Laboratory, University of North Carolina at Chapel Hill; 2001.
37. Thissen D:IRTLRDIF software.[http://www.unc.edu/~dthissen/dl.html], Accessed at 14 Sep 2010.
38. Langer M, Hill C, Thissen D, Burwinkle T, Varni J, DeWalt D:Item response theory detected differential item functioning between healthy and ill children in quality-of-life measures.J Clin Epidemiol2008,61:268-276. 39. Gustafsson J:The Rasch model for dichotomous items: Theory, applications
40. Wolffsohn JS, Cochrane AL, Watt NA:Implementation methods for vision related quality of life questionnaires.Br J Ophthalmol2000,84:1035-1040. 41. van Nispen RMA, Knol DL, Mokkink LB, Comijs HC, Deeg DJH, van
Rens GHMB:Vision-related quality of life Core Measure (VCM1) showed low-impact differential item functioning between groups with different administration modes.J Clin Epidemiol2010,63:1232-1241.
42. Schwartz N, Strack F, Hippler H, Bishop G:The impact of administration mode on response effects in survey measurement.Appl Cognitive Psychol
1991,5:193-212.
43. Raju NS, Oshima TC:Two prophecy formulas for assessing the reliability of item response theory-based ability estimates.Educat Psychol Meas
2005,65:361.
44. Samejima F:Estimation of reliability coefficients using the test information function and its modifications.Appl Psychol Meas1994,
18:229.
Pre-publication history
The pre-publication history for this paper can be accessed here: http://www.biomedcentral.com/1471-2288/11/125/prepub
doi:10.1186/1471-2288-11-125
Cite this article as:van Nispenet al.:Re-evaluating a vision-related quality of life questionnaire with item response theory (IRT) and differential item functioning (DIF) analyses.BMC Medical Research Methodology201111:125.
Submit your next manuscript to BioMed Central and take full advantage of:
• Convenient online submission
• Thorough peer review
• No space constraints or color figure charges
• Immediate publication on acceptance
• Inclusion in PubMed, CAS, Scopus and Google Scholar
• Research which is freely available for redistribution
![Figure 7 Test information curves for the LVQOL dimensionsThe horizontal dash line is a reference line representing classicalreliability = 0.9 [43,44].](https://thumb-us.123doks.com/thumbv2/123dok_us/9343475.1921494/8.595.56.290.88.240/figure-information-curves-dimensionsthe-horizontal-reference-representing-classicalreliability.webp)
