Analysis of Hypothetical Water Distribution
Network from the Application of Three
Calibration Optimization Algorithms Applying
the Genetic Algorithms
Fernando das Graças Braga da Silva
1, Thaisa Dias Goulart
2, Regina M.
Barros
3123Federal University of Itajubá, Brazil
[email protected], [email protected], [email protected]
Abstract
The calibration of models applied to water distribution network systems is fundamental, as this improves the computational algorithms constructed from mathematical models. In this work from a hypothetical network, three proposed calibration algorithms were tested, (a) in terms of roughness of the model; (b) in terms of roughness and random demand and (c) in terms of random roughness and pressure directed demand. The results show few differences for the three algorithms tested, the first and third results are almost identical and slightly different from the second. However, these are basis for application in real networks, where surely the more complex algorithms can produce advantages.
Keywords: water distribution network Structure, Genetic Algorithms, calibration Volume 3, 2018, Pages 1962–1970
HIC 2018. 13th International Conference on Hydroinformatics
1.
Introduction
Calibration is defined by Santos, M. (2013) as the set of operations that establish the relationship between the values indicated by a measuring instrument or system and the values represented by a materialized measure or a reference material. For the SDA, the calibration refers to the approximation of the results obtained by a mathematical model to the values provided by the measurements.
According to Rocha et al. (2009), the calibration process is important because the equations of hydraulic equilibrium conditions depend on several factors, such as characteristics of the transported fluid, local geography and physical aspects of the system parts, thus translating into a large number of variables involved, and the proper and accurate use of these variables as much as possible will translate into the reliability of the hydraulic models.
Alegre et al. (2006) present as elements of the verification and calibration of a model:
• Identification of malfunctions of the model; • Failure analysis and correction through an iterative process; • Verification of the conformity of the results obtained with the design data, flow and pressure measurements, etc.
The phases that involve the calibration process of a water distribution system (Figure 5) are presented by Ormsbee and Lingireddy (1997) as seven:
1. Identify the purpose of the model - this step involves the identification of the purpose of the model, analyzing the value of the error that will be considered admissible; 2. Determine the initial estimation of the calibration parameters - in this phase we try to calculate, by means of heuristic rules, which contain some degree of uncertainty, the predicted values of certain parameters such as roughness of the conducts and consumptions in the nodes; 3. Collect data for calibration - survey of data measured in the field, by means of tests and tests;4. Evaluate the results of the model - analysis of the results of the model, using the data estimated in the second step and collected in the third, in order to validate the model by comparison with reality; 5. Macro-calibration - Evaluation of the sources of errors obtained in the previous step, since when this value exceeds 30%, it is probably associated with an additional error and not only with the initial estimation of the parameters, which may be related to the non-detection of a closed register;6. Sensitivity analysis - The parameters for the analysis of the associated effects are varied in order to identify the components and parameters that most influence the behavior of the network, and that most influence the error observed in the SDA; and 7. Micro-calibration - already having reached a great level of approximation with reality, the previously estimated parameters, such as the roughness of the conduits, are adjusted.
2. Material and methods
2.1 Network in Study
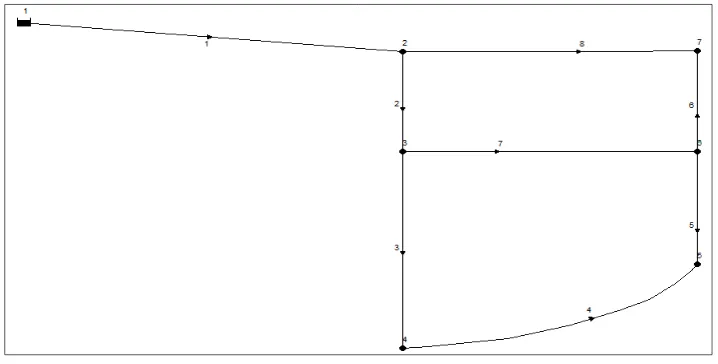
The network shown in Figure 1 is composed of 7 nodes and 8 segments. Its use was carried out in the network calibration studies in terms of absolute roughness (Silva, 2003 – Model 1) in terms of absolute roughness and random demand and in terms of absolute roughness (Goulart, 2016 – Model 2) and pressure driven demand through the model proposed by Tucciarelli, Criminisi and Termini (1999)
(Goulart, 2016 – Model 3). This network was mainly adopted by the computational time reduction. The network is a modified example of the proposed in the Epanet 2.0 Brazil software manual.
Figure 1 : Hypothetical water distribution network tracing. (Source: Adapted from Epanet 2.0 Brazil)
For the study of the hypothetical network calibration, the values obtained by the simulation in the Epanet software for the patterns of consumption, minimum consumption (standard 3).
The hypothetical network extracted from the simplified example of the Epanet 2.0 Brazil manual was used to determine the absolute roughness of the stretches and to determine the nodal demands through the use of the genetic algorithm from 30 different initial random populations.
The number of iterations was established as a criterion of convergence, with a number of 1000 generations and the same leakage coefficients (C1 = 1E-05 l / sm and N1 = 1.18)
The Tucciarelli, Criminisi and Termini (1999) pressure-matched mathematical model was calibrated for the hypothetical network, adopting as the minimum load value zero mca and the desired load value equal at 20 mca.
2.2 Algorithms Study – Figure 2 illustrates the general format of the 3 implemented algorithms
Figure 2 – Three algorithms for implementation models
3.Results
The first analysis to be made in function of the evolution of the objective function
of each computational routine. The Figures 3 present a typical evolution is quickly
found by the three models and algorithms tested.
Figure 3 : Objective function evolution for generations
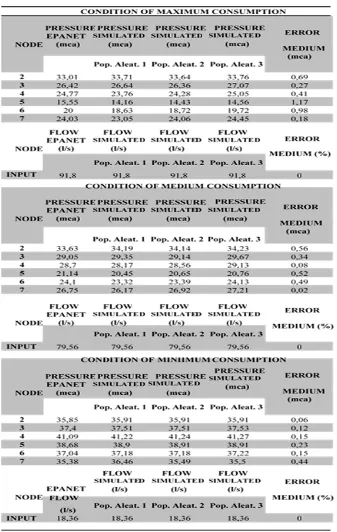
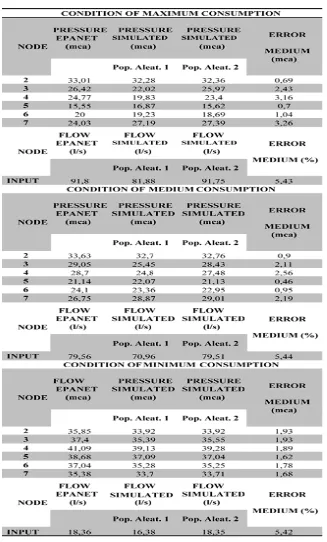
What can be observed is a similar evolution of the three models. However, maximum values are found for models 1 and 3. For model 2, the ranking found was worth a little below the others. In Tables 1, 2 and 3, the values of the observed pressures and flows were adopted as preliminary values simulated in the Epanet software and calculated for all nodes of the network, for 3 consumption conditions and for different populations of random rugosities of the model proposed by Silva (2003), by the model
Calibration of roughness in view adjustment of pressure and flow
Calibration of roughness in view adjustment of pressure and flow and
demand random
Calibration of roughness in view adjustment of pressure and flow
and demand drive pressure
ALGORITHM 01
ALGORITHM 02
ALGORITHM 03
implemented with random demand and by the model implemented with demand driven by pressure, respectively.
It is observed that the mean absolute pressure errors (obtained by subtracting the values obtained in the Epanet software from the mean of the simulated values) present the highest pressure deviation value for the maximum consumption condition for the three simulated models, reaching 3.16 mca for the model implemented with the random demand, and the smaller pressure deviations are presented for the calibration with the model proposed by Silva (2003), reaching 0.02 mca in the condition of average consumption.
For the flow values, also contained in Tables 1, 2 and 3, the relative errors represent values practically equal to the three consumption conditions in the tests with the three models, showing higher for the model implemented with random demand equal to 5.44% of the average consumption pattern and lower for the model proposed by Silva (2003), which reaches exactly the value of the flow at the input of the system. But it is worth mentioning that, for the model implemented with pressure demand, the relative flow error was quite small, reaching 0.08%.
The differences between the pressure and flow values of the Epanet software (assuming in this case the observed data of a system) and the simulated values in the calibration processes are very close to those suggested in the international standards. Reaching mean absolute pressure error of less than 0.5 mca to 100% of the points in the model proposed by Silva (2003), less than 2 mca for 100% of the points of the model implemented with random demand and again lower than 0.5 mca to 100% of the points of the model implemented with pressure demand, in the minimum consumption pattern..
Table 1 : Pressure values and flow rates simulated in the Epanet software and obtained by the calibration model with random demand,Algorithm 1, model 1
Table 2: Pressure values and flow rates simulated in the Epanet software and obtained by the calibration model with random demand, Algorithm 2, model 2
Table 3 : Simulated pressures and flow rates in Epanet and obtained by the calibration model implemented pressure directed demand – Algorthm 3, Model 3
4. Conclusions
Three algorithms were proposed for the calibration of water distribution network model for supply. The tests were done for a hypothetical network. The results obtained were good considering the approximation of the observed and simulated values for the three models tested. Such a study will serve as a basis for applications in real networks.
Acknowledgments
The paper authors thanks FAPEMIG - Foundation for Research Support of Minas Gerais for the support in particular to the PPM Project - Researcher of Minas Gerais, in particular to PPM 00755-16 and the Brazilian Ministry of Science and Technology for the REDECOPE FINEP Project. Ref. 0983/10 -"Development of Efficient Technologies for Hydroenergetic Management in Water Supply Systems"
Reference
[1]Alegre, H., Coelho, S.T., Loureiro, D. Modeling and analysis of Water Supply Systems. Ed .: Water and Waste Regulatory Institute & National Laboratory of Civil Engineering. 2006. Available at: <http://epanet-curso.lnec.pt/artigos/GT4.pdf> Accessed on: 09 Jul. 2015
[2]EPANET 2.0 Manual do Usuário por Lewis A. Rossman Water Supply and Water Resources Division National Risk Management Research Laboratory United States Environmental Protection Agency Translation and Adaptation Laboratory of Energy and Hydraulic Efficiency in Sanitation Federal University of Paraíba, UFPB, BRAZIL (2009)
[3]Ormsbee, L. E., Lingireddy, S. Calibrating Hydraulic Network Models. Vol 89, Issue 2, Journal AWWA,(1997).Disponívelem:<https://www.researchgate.net/publication/229849487_Calibration_of_ Hydraulic_Network_Models>. Acesso: 04 out 2017
[4] Rocha, V.A.G. M., Castro, M.A.H., Araújo, J. K. Calibration of roughness in supply networks from hydraulic gradients by iterative method. XVIII Brazilian Symposium on Water Resources, (2009).Availableat:<https://www.abrh.org.br/SGCv3/index.php?PUB=3&ID=110&PUBLICACAO= SIMPOSIOS>. Access: 9 Oct. 2014.
[5]Goulart, T.D Studies of improvement of calibration algorithm and application in water distribution network of Cambui (MG). 2015. Dissertação (Mestrado em Meio Ambiente e Recursos Hídricos) - Dissertation (Master in Energy Engineering) - Federal University of Itajubá,. Advisor: Fernando das Graças Braga da Silva.
[6] Santos, M. A. F. Simplification of Water Distribution Systems. Dissertation (Master in Civil Construction Infrastructure) - School of Technology, Polytechnic Institute of Castelo Branco, Castelo Branco, Portugal, (2013. 79f). Available at: http://repositorio.ipcb.pt/bitstream/10400.11/2382/2. Access: September 5, 2014.
[7] Silva, F. G. B. Studies of calibration of water distribution networks through genetic algorithms. (2003). 234 f. Thesis (Doctorate in Hydraulics and Sanitation) - School of Engineering of São Carlos, University of São Paulo, São Carlos, SP, 2003. CD-ROM.
[8] TUCCIARELLI, T.; CRIMINISI, A.; TERMINI, D. Leak analysis in pipeline systems by means of optimal valve regulation. Journal of Hydraulic Engineering, v.125, n. 3, p. 277-285, mar. 1999.
Disponível
em:<http://ascelibrary.org/doi/abs/10.1061/%28ASCE%290733-9429%281999%29125%3A3%28277%29>. Acesso em: 10 nov. 2014.