Copyright © 2016–2017, User Experience Professionals Association and the authors. Permission to make digital or hard copies of all or part of this work for personal or classroom use is granted without fee provided that copies are not made or distributed for profit or commercial advantage and that copies bear this notice and the full citation on the first page. To copy otherwise, or republish, to post on servers or to redistribute to lists, requires prior specific permission and/or a fee. URL: http://www.upassoc.org.
Investigation of Three Think-Aloud
Protocols in Usability Testing
Obead Alhadreti Assistant Professor College of Computer Umm Al-Qura University Al-Qunfoudah
Saudi Arabia oghadreti@uqu.edu.sa
Pam Mayhew Senior Lecturer School of Computing Sciences
University of East Anglia Norwich
UK
p.mayhew@uea.ac.uk
Abstract
This paper presents the results of a study investigating the use of three think-aloud methods in website usability testing: the concurrent think-aloud, the speech-communication, and the active intervention methods. These three methods were compared through an evaluation of a library website, which involved four points of comparison: overall task
performance, test participants’ experiences, the quantity and quality of usability problems discovered, and the cost of employing the methods. Data were collected from 60 individuals, with 20 participants allocated to each testing method, who were asked to complete a set of nine experimental tasks. The results of the study revealed that the three variations enabled the identification of a similar number of usability problems and types. However, the active intervention method was found to cause some reactivity, modifying participants’ interaction with the interface and negatively affecting their feelings towards the evaluator. The active intervention method also required a much greater investment than the other two methods in terms of evaluators' time.
Keywords
Journal of Usability Studies Vol. 12, Issue 3, May 2017
Introduction
Usability is increasingly recognized as an important factor in the design and development of websites, offering multiple benefits for both development teams and end users. Several studies have demonstrated the benefits of a strong commitment to usability throughout the
development life cycle of a system. These benefits include improvements in performance, security, user productivity, and user satisfaction. There are also significant cost- and time-saving effects—it has been estimated that the cost of correcting a problem after a product has been released can be as much as 100 times the cost of resolving it in the development phase (Aaron, 2005). The selection and employment of effective usability evaluation methods is therefore a crucial element of product development.
Over the last four decades, a number of different usability evaluation methods have been proposed (Nagpal, Mehrotra, & Bhatia, 2016). Amongst these methods, the concurrent think-aloud (CTA) method, also known as CTA protocol, is widely used. McDonald, Edwards, and Zhao's (2012) international survey showed that 98% of respondents had used the CTA, and 89% rated it as the most frequently used approach. The CTA method was originally based on the theoretical framework developed by cognitive psychologists Ericsson and Simon (1980), and was introduced to the field of usability testing by Lewis and Rieman in 1982 (cited in Lewis and Rieman, 1993). Typically, the testing method has test participants work on a set of tasks, and asks them to verbalize their experiences, thoughts, actions, and feelings whilst interacting with the system. This provides direct insight into the cognitive processes employed by users— knowledge that can then inform strategies to improve usability. However, despite the common usage of CTA in the field, the specific think-aloud (TA) procedures employed vary widely among usability professionals (Olmsted-Hawala, Murphy, Hawala, & Ashenfelter, 2010).
This paper presents the findings of our study on the effect of different variations of the TA protocol on the outcome of website usability testing. The rest of this paper is structured as follows: the next section discusses the existing literature focusing on recent studies related to the TA methods in usability testing, and states the aims and research questions of the current study; further sections discuss the research method, data analysis, and results of this study; and finally, the paper concludes with a brief discussion of the findings.
Related Work
This section presents an overview of the related literature on TA protocols. The Classic TA Protocol
The traditional CTA method provides “real-time” information during the participant’s interaction with a system, which can make it easier to identify the areas of a system that cause problems for the user. There are, however, several issues to be aware of that could have a negative impact on the quality of the data being collected. The first of these issues concerns the
completeness of the data gathered. Ericsson and Simon (1993) acknowledged that although the concurrent data can provide sufficient evidence for the accurate sequence of thoughts that participants had whilst completing the task, the verbal reports are likely to be incomplete because participants are expected to give priority to task solving and may therefore fail to report some thoughts (Ericsson & Fox, 2011; Ericsson & Simon, 1993). Within the context of usability testing, research investigating the relationship between eye movements and TA protocols suggest that verbal reports may indeed be incomplete (Cooke, 2010). The second issue is simply that the process of concurrent verbalization may feel uncomfortable or unnatural, as people do not commonly verbalize their thoughts constantly while working (Nielsen, 1993). The third issue concerns the extent to which the request to talk aloud may interfere with and alter participants' thought processes and task performance. The change in task performance is often referred to as reactivity. Reactivity may result in an improvement in participants' performances, but it may also act as an impediment to performance. For usability testers, reactivity poses a problem: In cases where it enhances participants' performance, evaluators may fail to detect usability problems or may assign unhelpful severity assessments. In the opposite case, where reactivity causes a decline in performance, evaluators risk
Journal of Usability Studies Vol. 12, Issue 3, May 2017 silent condition followed by a retrospective thinking-aloud have had mixed results (e.g.,
Hertzum, Hansen, & Anderse, 2009; Peute, de Keizer, & Jaspers, 2010; van den Haak, De Jong, & Schellens, 2004).
Alternatives to the Classical TA Protocol
According to Ericsson and Simon (1993), in tests utilizing the traditional CTA method, verbalizations can only be considered valid if they represent directly accessible information contained in the participant’s short-term memory. Such verbalizations do not alter the sequence of information comprehended by participants, and so do not affect the tasks that participants perform during TA sessions. Conversely, any verbalization that requires additional processing through reflection or elaboration, causing the flow of short-term memory content to change during the TA process, is considered invalid. Therefore, the evaluator is advised to avoid prompting or questioning the participant because participants’ verbalizations and task performance can be affected by interventions. However, evidence gathered from field studies suggests that usability professionals often ignore the recommendations from Ericsson and Simon, choosing to adopt a more relaxed approach. These practitioners often intervene actively in the CTA process, exploring and questioning participants' reported experiences in the hope of extracting maximum utility from the data (Boren & Ramey, 2000; McDonald et al., 2012). This is accomplished through prompts and interventions that are much more intrusive than a classic TA reminder. In fact, even some well-known handbooks on usability testing (Dumas & Redish, 1999; Rubin & Chisnell, 2008) encourage test evaluators to seek explanations and additional details from participants because this might help to gain more insight into the deficiencies of a particular test object. By intervening in this way, evaluators risk compromising the validity of the CTA test; additionally, there is no empirical evidence supporting the assumption that such interventions enhance the utility of the data collected. This method is referred to as the active intervention (AI) method in this paper.
The difference between the traditional CTA and the actual practices of usability professionals has led some researchers to question whether another approach to TA testing might be more effective. Boren and Ramey (2000) proposed a theoretical alternative to the traditional
protocol—referred to as the speech communication (SC) method—where the evaluator takes on an active listening role. This is achieved through the use of acknowledgment phrases that indicate to the participant that they are being heard and understood. Aside from these affirmative phrases, no questions are asked, and no conversation is made. Boren and Ramey (2000) presented their model as a compromise between the AI approach, which may risk skewing the validity of collected data, and the traditional CTA technique that requires the evaluator to listen passively, which some usability professionals (and participants) may find inadequate, uncomfortable, or unrealistic. They also argued that their SC protocol reflects the way human beings naturally communicate, with a combination of statements offered by a speaker followed by feedback or acknowledgment from a listener. Although the SC protocol was designed with usability evaluation in mind, there is no definitive evidence regarding its real contribution, as no research has examined it in detail.
Prior Studies Comparing TA Methods
There have been few comparative studies that have measured the validity and utility of the relaxed protocols against that of the traditional CTA protocols. A study by Hertzum et al. (2009) compared the traditional and the AI protocols to a silent condition. They found that the classic TA approach had very little effect on task performance, whereas the AI method seemed to alter the participants’ behavior, causing them to browse and navigate more within and between the web pages. The results confirmed that classic TA testing yields valid data about the use of the evaluated systems provided the interaction between participant and test evaluator is kept to a minimum. AI, on the other hand, may not be a valid method for gathering data about users’ performance, as it may be associated with increased reactivity.
Journal of Usability Studies Vol. 12, Issue 3, May 2017 participants in the SC condition completed more tasks successfully and were less likely to be disoriented. Krahmer and Ummelen claimed that these measures were subject to the influence of evaluator intervention, and therefore validity issues may result.
Finally, Olmsted-Hawala et al. (2010) compared three different TA methods—classic CTA, SC, and AI—and used a silent condition as a control. Three outcomes were measured: accuracy (considered in terms of success or failure with the tasks), efficiency (considered in terms of task completion time), and satisfaction (measured using the subjective satisfaction score about the website used). The results showed that the levels of accuracy were significantly higher in the AI condition. The AI protocol also produced higher satisfaction scores, as participants gave more positive scores in this condition compared to the others. In terms of efficiency, no significant differences were found between the test conditions, even when compared to the silent
condition. The researchers concluded that usability practitioners should use either the traditional or the SC method, because the AI protocol created reactivity.
Assessment of comparisons
Assessments of usability evaluation methods in general (including TA methods) have been subjected to heavy criticism (Hornbæk, 2010). Therefore, even though the studies conducted on assessing TA methods in usability testing have improved the understanding regarding the usefulness of the methods, several gaps can be identified in the literature.
First, it is evident that there is a need for a thorough and holistic assessment of the methods. TA methods have been evaluated based on a range of criteria, including usability problem identification (Peute et al., 2010), task performance metrics (Olmsted-Hawala et al., 2010; van den Haak et al., 2004), participants' testing experiences (Hertzum et al., 2009), and the cost of employing methods (Als, Jensen, & Skov, 2005). However, no existing research unifies all of these criteria into a single study. The failure of previous studies to combine evaluation criteria has resulted in conflicting findings and an incomplete understanding.
Second, although the main purpose of usability evaluations is to uncover as many problems as possible, the authors have only found one empirical assessment of the usability problems identified via the different TA protocols (Krahmer & Ummelen, 2004). This limited focus on problem identification supports the general critique that usability research is "in crisis” and has little relevance to practice (Wixon, 2003; Woolrych & Cockton, 2011). Third, despite the significance that the evaluator effect, which refers to the phenomenon wherein different evaluators when using the same evaluation technique to evaluate the same user interface identify different numbers of usability problems (Hertzum & Jacobsen, 2001), can have on the validity of the data, the majority of studies do not consider or discuss this factor (Hornbæk, 2010; Hornbæk and Frøkjær, 2008).
The Present Study
Our study aims to provide a holistic examination of the three variations of TA methods: the classic CTA, the AI, and the SC methods. The methods selected for this study are either classical methods or are commonly employed by usability practitioners (McDonald et al., 2012; Olmsted-Hawala et al., 2010). The research questions we endeavor to address with this study are as follows:
Research Question 1 (RQ1): Are there discrepancies between TA methods with regard to participants’ task performances?
Research Question 2 (RQ2): Are there discrepancies between TA methods with regard to participants’ testing experiences?
Research Question 3 (RQ3): Are there discrepancies between TA methods with regard to the quantity and quality of usability problems they detect?
Journal of Usability Studies Vol. 12, Issue 3, May 2017
Method
In this section, we describe the methodology used to address the research questions, and the strategies considered for analyzing the data. We also describe how usability problems were extracted from the test data and the factors considered to reduce the evaluator effect. Study Design
Given the study’s focus on investigating different variants of TA methods and the fact that TA testing methods are typically applied in usability laboratory settings (Norman & Panizzi, 2006), an experimental method is used in this study. The independent variable under examination in this study is the type of TA methods: the CTA, the SC, and AI methods. The dependent variables are the following evaluating criteria of TA performance: (a) performance data from participants’ tasks, (b) participants’ testing experience, (c) usability problem data, and (d) the cost of employing methods. Considering the advantages and disadvantages of the between-group and within-between-group approaches, the former approach was chosen as the most appropriate experimental approach for the present study. The later approach was rejected because of the possible “carry-over” effects between the TA conditions of each study. For instance, participants could have provided more verbalizations than they would otherwise have provided due to increasing familiarity with the TA process, or could have become aware of the purpose of the study. Indeed, the majority of comparative TA studies favor the between-group approach (e.g., Olmsted-Hawala et al., 2010; van den Haak et al., 2004).
Test Object and Tasks
The test object targeted in this study is the Durham University (DU) library website. The selection of the website was based on the following criteria:
• It had to be a dynamic website with multiple interactive features and functions. • It had to be manageable in size to allow for thorough evaluation of its usability level. • It had to possess a certain number of potential usability problems, thereby ensuring to
some extent that participants would encounter difficulties whilst using the site. • It had to retain the validity of the results obtained; the interface of the selected site
could not change during the study period.
• It had to ensure to the greatest extent possible that study participants could not rely on pre-existing knowledge of the website interface when performing test tasks; the site selected should be unfamiliar to study participants (Sova & Nielsen, 2003).
After defining the test object, a set of tasks was developed to assess the usability of the chosen website by means of the three TA methods. The selection of tasks was based on the following two criteria: (a) selecting those that are representative of the actual activities the end users undertake most whilst using the targeted application in a real-life context and (b) selecting those that could be diagnostic in revealing usability problems (Dumas & Redish, 1999). To this end, a context of use analysis of the chosen website was conducted (Maguire, 2001), and the library site was evaluated by the first author using the heuristic evaluation method (Nielsen, 1993) in order to identify potential usability problems that, in turn, could provide a focus for the task design. Nine tasks were designed that together covered the targeted website’s main features and predicted problematic areas (see Appendix B).
Participants
Journal of Usability Studies Vol. 12, Issue 3, May 2017 After the user profile was clarified, a number of recruiting criteria were developed to obtain the most appropriate participants for our study. These criteria, which were derived from the context of use analysis and from TA and usability testing literature, were as follows:
• Given the sample size of the TA groups in our study, it was not possible to provide valid representation of different user subgroups. We, therefore, decided to select the study sample from among university students, as the site administrator deemed them the dominant and most important user group of the tested website.
• The participants sample must include male and female members, as the targeted site was intended for both genders.
• The age range of the recruited participants should be 18 to 65 years old; the age was limited to 65 years old to limit the influence of ageing on TA usability testing (Olmsted-Hawala & Bergstrom, 2012; Sonderegger, Schmutz, & Sauer, 2016).
• Participants had to have competence in English due to the potential impact of language proficiency on TA behavior (Sun & Shi, 2007).
• Participants had to possess good Internet skills, as the majority of the site users were assumed to have good web experience.
• Participants could not have prior familiarity with the chosen website.
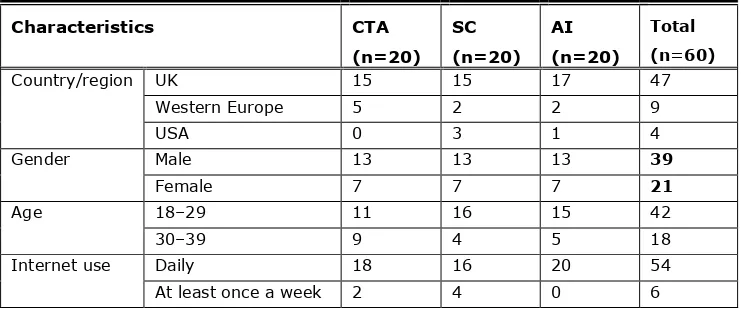
Sixty students, from the University of East Anglia in the UK, meeting the selection criteria were contacted and invited via email to participate in the study. The participants were allocated to the three TA testing conditions, with 20 per condition. To mitigate the impact of individual differences and to be able to draw valid comparisons between the TA groups, participants were matched on the basis of demographic variables as closely as possible. Table 1 summarizes the demographic profile and descriptive statistics of the participants. All the selected participants used the Internet on a daily basis and had done so for more than five years. Nearly all of them had worked with a library website before, but none of them had ever used the evaluated website. By being part of the target group (i.e., university students) as well as novice users of the targeted website, the participants were very suitable for evaluating the DU library website. We believe that the independent groups were matched successfully, given that a
non-parametric Kruskal-Wallis H test (Kruskal & Wallis, 1952) with an alpha level of 0.05 (i.e., p < 0.05)1 revealed no statistically significant difference between the TA groups in terms of nationality (χ2(2) = 0.804, p = .669), gender (χ2(2) = .000, p = 1.00), age (χ2(2) = 3.27, p = .194), and Internet experience (χ2(2) = 4.37, p = .112).
Table 1. Summary Statistics of Demographic Characteristics of Participants
Characteristics CTA
(n=20) SC (n=20)
AI (n=20)
Total (n=60)
Country/region UK 15 15 17 47
Western Europe 5 2 2 9
USA 0 3 1 4
Gender Male 13 13 13 39
Female 7 7 7 21
Age 18–29 11 16 15 42
30–39 9 4 5 18
Internet use Daily 18 16 20 54
At least once a week 2 4 0 6
Journal of Usability Studies Vol. 12, Issue 3, May 2017 Procedure
All evaluation sessions were conducted in the same laboratory in the School of Computing sciences at University of East Anglia. The session began with the evaluator (first author) welcoming each participant and asking them to read and sign a consent form. Participants were informed that the purpose of the study was to evaluate an online library website. Following this, the concept of thinking aloud was introduced using Ericsson and Simon’s instructions (1993). Regardless of their TA condition, the same basic instruction on the TA technique was used. Participants were instructed to talk aloud while performing the tasks and not to turn to the evaluator for assistance; they were however informed that if they did fall silent for a period the evaluator would tell them to keep thinking aloud. The participant then engaged in a brief TA practice session using the simple and neutral task of looking up the word “chant” in an online dictionary. On completion of the training session, the participants were asked to read the task instructions shown on the screen, before beginning task solving. For the traditional CTA condition, Ericsson and Simon's guidelines were strictly followed; the only interaction between the evaluator and the participants was to issue the “please keep talking” reminder if participants had fallen silent for 15 seconds. For the SC condition, the evaluator followed the TA technique proposed by Boren and Ramey (2000); using acknowledgement tokens in form of the
affirmatory “Mm hmm” with intonation, and probing with tokens of “Mm hmm?” or asking “And now…?” if participants fell silent for more than 15 seconds, and if the former questioning tone failed to elicit response. For the AI condition, the evaluator intervened actively with participants. Zhao and McDonald (2010) developed a list of interventions in their comparative study of the AI method and the traditional CTA method. The researchers also set out a research project to explore the types of interventions usability practitioners used in the practice (Naveedh, 2015). The project results were utilized alongside the information acquired from the relevant literature (Zhao & McDonald, 2010) to determine how the evaluator would intervene with participants in the test sessions (for the full list of interventions types and associated triggers see Appendix A). In order to control for variation in computer performance, the same participant computer was used in all tests. The Morae software package (2015) was adopted in the experiments to record the whole test process. When participants had completed the tasks, they were asked to fill in two online post-test questionnaires to provide feedback on the evaluated website (the System Usability Scale [SUS] questionnaire) and the test (experience with TA test questionnaire). Lastly, the evaluator thanked each participant for taking part and gave them £5 reward as token of appreciation for participating in the study.
Usability Problem Extraction
To date, there are no standard guidelines in existence for how usability problems should be extracted (Hornbæk, 2010). For this study, we considered a number of measures during the problem extraction process based on recommendations from the literature in order to reduce the evaluator effect and to increase the reliability and validity of data.
The process of the usability problem identification in this study consists of two stages
(Figure 1). In Stage One (Individual problems) each participant’s testing video was reviewed to detect usability problems. Data files were selected using a random number generator to reduce order effect. A clear and explicit usability problem indicator checklist was used at this stage to guide the extraction process. We adopted the checklist developed by Vermeeren, Bouwmeester, Aasman, and de Ridder (2002); the checklist offers a detailed account of a large number of problem indicators. Zhao et al. (2012) adopted this checklist in their study on the effect of different TA instruction on the outcome of CTA testing, and found that the checklist increases the reliability of data collected. Each problem that was discovered in our study was assigned a number (e.g., IUP1), and was recorded in a report in terms of the contexts in which they arose, their descriptions, their impact, their persistence (the number of times a problem is
encountered by the same participant), the current task, and time when it occurred (generated by screen capture recorder), in accordance with Lavery, Cockton, and Atkinson’s (1997) structure report form.
Journal of Usability Studies Vol. 12, Issue 3, May 2017 Figure 1: Schematic overview of the usability problems extraction process.
Results
This section presents the results obtained from the three TA methods used in the study. Task Performance
We recorded the number of successful task completions, time on task, mouse clicks, pages browsed to determine if the different TA conditions would differ in the measures that are typically associated with reactivity. A one-way ANOVA test and Bonferroni post-hoc analyses found significance differences between the AI condition and the other two conditions in the participants’ task performance. The use of proactive interventions in the AI condition slowed down the process of task solving and led to a higher number of mouse clicks and pages viewed compared to the CTA and SC conditions (see Table 2). The SC participants performed their tasks neither better nor worse than the participants in the CTA condition.
Table 2. Task Performance Measures
CTA SC AI p-value
Mean SD Mean SD Mean SD
Tasks completion rate 5.50 1.59 5.30 1.39 5.05 1.05 p = .537 Time on tasks (min) 25.15 3.45 27.75 3.78 31.20 4.88 p < 0.0001 Number of mouse clicks 105.20 22.70 109.25 29.25 125.00 25.00 p = .021 Number of pages browsed 34.80 7.86 37.30 8.74 43.55 14.60 p = .004
Participants’ Testing Experiences
This subsection presents participants’ satisfaction with the website usability and their experience with the TA test.
Participants’ satisfaction with the usability of the website
We used the SUS questionnaire to investigate the effects of the variations of TA protocols on participants’ satisfaction with the tested websites. The form yields a single score on a scale of 0–100 representing the overall usability of the website. The higher the score, the more satisfied the participant reported being with the site (Brooke, 1996). A one-way ANOVA test was
Journal of Usability Studies Vol. 12, Issue 3, May 2017 Table 3. Participants’ Satisfaction With the Tested Website
CTA SC AI p-value
Mean SD Mean SD Mean SD
SUS score 61.60 10.58 58.55 13.37 56.40 15.82 p = .670 Note. SUS score is on a totaled scale of 1 to 100.
Participant experience with the TA test
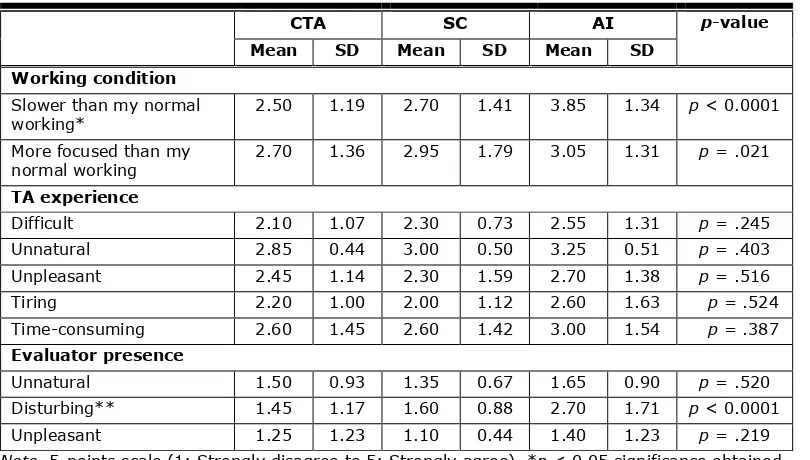
The experience with the TA test questionnaire was based on previous research (van den Haak et al., 2004), and aims to understand participants' experiences of the TA testing environment. Table 4 presents the results of participants' ratings in the three TA conditions. To begin, all participants were asked to estimate how their working procedure on the experimental tasks differed from their normal working, by marking on a 5-point scale their perceived speed and focus differential whilst involved in the study. A Kruskal Wallis H test and Bonferroni post-hoc analyses indicated that participants in the AI condition felt they worked significantly slower when thinking aloud than participants in the CTA (p < 0.005) and SC (p < 0.05) conditions. The participants in the CTA and SC conditions indicated that they had not worked all that differently from usual with average scores ranging from 2.50 to 2.95.
Participants were also asked to indicate to which degree they thought having to talk aloud was difficult, unpleasant, tiring, unnatural, and time consuming. The results showed that there were no significant differences between the methods. On average, the participants rated their experiences with thinking aloud neutrally, with scores ranging around the middle of the 5-point scale.
The third and final part of the questionnaire involved questions about the presence of the evaluator (first author). Participants were asked to indicate to what degree they found it unpleasant, unnatural, or disturbing to have the evaluator present during the experiment. A Kruskal Wallis H test and Bonferroni post hoc analyses revealed a significant difference in the level of distractions caused by the evaluator: Participants in the AI condition felt more distracted than their colleges in the other two conditions. No differences were found in other aspects. With all scores ranging from 1.10 to 1.60, the CTA and SC participants clearly felt that they were not affected by the presence of the evaluator.
Table 4. Participants’ Experience With the TA Test
CTA SC AI p-value
Mean SD Mean SD Mean SD
Working condition Slower than my normal
working* 2.50 1.19 2.70 1.41 3.85 1.34 p < 0.0001 More focused than my
normal working 2.70 1.36 2.95 1.79 3.05 1.31 p = .021 TA experience
Difficult 2.10 1.07 2.30 0.73 2.55 1.31 p = .245
Unnatural 2.85 0.44 3.00 0.50 3.25 0.51 p = .403
Unpleasant 2.45 1.14 2.30 1.59 2.70 1.38 p = .516
Tiring 2.20 1.00 2.00 1.12 2.60 1.63 p = .524
Time-consuming 2.60 1.45 2.60 1.42 3.00 1.54 p = .387 Evaluator presence
Unnatural 1.50 0.93 1.35 0.67 1.65 0.90 p = .520
Disturbing** 1.45 1.17 1.60 0.88 2.70 1.71 p < 0.0001
Unpleasant 1.25 1.23 1.10 0.44 1.40 1.23 p = .219
Journal of Usability Studies Vol. 12, Issue 3, May 2017 Usability Problems
This subsection focuses on the quantity and quality of the problems detected per participant (i.e., individual problems) and in each TA condition (i.e., final problems). This study assesses the quality of problems in terms of their sources, severity levels, types, and uniqueness. A non-parametric Kruskal Wallis H test was used for the analysis of the individual problem data because the data were not normally distributed. Descriptive statistics were used to describe and summarize the final problems discovered.
Individual usability problems
Table 5 presents the mean number and standard deviation for problems detected per participant, and classifies all problems according to how they were detected: (a) through observation (i.e., from observed evidence with no accompanying verbal data), (b) through verbalization (i.e., from verbal data with no accompanying behavioral evidence), or (c) through a combination of observation and verbalization. Interestingly, Kruskal Wallis H testing revealed that there were no significant differences between the three TA testing variations, either in terms of the number of individual problems detected or in terms of the ways in which these were detected.
Table 5. Number and Source of Individual Problems Identified
CTA SC AI p-value
Mean SD Mean SD Mean SD
Observed 2.50 2.06 2.25 1.86 3.10 1.73 p = .213 Verbalized 2.20 1.28 2.40 1.53 2.85 2.41 p = .978 Both 6.60 3.78 6.30 2.93 7.05 2.83 p = .555 Total 11.30 3.96 10.95 3.79 13.00 4.13 p = .157
Individual usability problems and severity levels
Our study breaks down severity levels according to participants' task performance and based on the popularly used four level severity ratings (Dumas & Redish, 1999, Zhao et al., 2012), as outlined in Table 6.
Table 6. Coding Scheme for Problem Severity Levels
Problem severity level Definition
1 Critical The usability problem prevented the completion of a task. 2 Major The usability problem caused significant delay or frustration. 3 Minor The usability problem had minor effect on usability, several
seconds of delay and slight frustration.
4 Enhancement Participants made suggestions or indicated a preference, but the issue did not cause impact on performance.
Journal of Usability Studies Vol. 12, Issue 3, May 2017 Table 7. Individual Problem Severity Levels
CTA SC AI p-value
Mean SD Mean SD Mean SD
Critical 3.50 0.94 3.55 0.75 3.85 0.70 p = .348 Major 4.20 1.50 4.35 2.00 4.80 1.85 p = 673 Minor 3.35 2.45 2.90 1.86 3.65 2.20 p = .442 Enhancement* 0.25 0.55 0.15 0.36 0.70 0.62 p = .004 * p < 0.05 significance obtained
Individual usability problem types
To investigate the types of problem that were detected in the three conditions, two independent usability experts divided all detected problems into four specific problem types: navigation, layout, content, and functionality (see Table 8). These types are based on the literature related to the categorization of usability problem of online libraries (van den Haak et al., 2004) and the literature related to the categorization of website usability problems (Tullis & Albert, 2008; Zhao et al., 2012). The inter-coder reliability was computed using Cohen’s kappa (Barendregt, Bekker, Bouwhuis, & Baauw, 2006). The overall kappa was 0.79, which indicates a highly satisfactory level of inter-coder agreement.
Table 8. Coding Scheme for Problem Types
Problem type Definition Example
Navigation Participants have problems navigating between pages or identifying suitable links for information/functions.
The participant has trouble returning to the home page.
Layout Participants encounter difficulties due to web elements, display problems, visibility issues, inconsistency, and problematic structure and form design.
The participant feels that the font is too small.
Content Participants think certain information is unnecessary or is absent; Participants have problems understanding the information including terminology and dialogue.
The participant does not understand the feedback of an error messages.
Functionality Participants encounter difficulties due to the absence of certain functions or the presence of problematic functions.
The participant expects an option on the “Catalogue” page to specify how many items to load per page.
Journal of Usability Studies Vol. 12, Issue 3, May 2017 Table 9. Individual Problem Types
CTA SC AI p-value
Mean SD Mean SD Mean SD
Navigation 4.45 1.57 4.30 1.49 5.05 1.60 p = .213
Layout 4.00 1.86 3.80 1.70 4.50 1.96 p = .414
Content 0.65* 0.48 0.25* 0.55 0.40 0.50 p = .038
Functionality 2.20 1.07 2.60 1.23 3.05 1.79 p = .149 * p < 0.05 significance obtained
Final usability problems
In total, 98 problems were extracted from the test session files of the three conditions. The CTA condition generated 60 problems (61%), 16 of which were unique to that condition, the SC condition yielded 58 problems (59%), 12 of which were unique to that condition, and the AI condition produced 64 problems (65%), 19 of which were unique to that condition. There were 33 (33%) problems that occurred in each of the three conditions. The Venn diagram in Figure 2 shows the overlap between the three TA protocols.
Figure 2. Venn diagram showing overlap in problems number between TA protocols.
Final usability problems and their sources
The final usability problems were coded according to verbalization source, observation source, and a combination of both. A problem was deemed to have a combined source if the individual problems had been merged from both verbal and observation sources. To qualify as having either a verbal or observed source, a final problem had to consist of individual problems from a single source of origin (all verbal or all observed; Zhao et al., 2012). The results are shown in Table 10.
Table 10. Final Problem Sources
CTA SC AI
Unique Overlapping Unique Overlapping Unique Overlapping
Observed 1 6 0 5 3 5
Verbalized 12 8 10 8 15 6
Both 3 30 2 33 1 34
Total 16 44 12 46 19 45
As shown in the table, in the CTA condition, 7 problems were derived from observation
Journal of Usability Studies Vol. 12, Issue 3, May 2017 unique final problems, the vast majority of unique problems in the CTA (75%), the SC (83%), and the AI (79%) conditions came to light from the verbalization source.
Final usability problems and severity levels
The assignment of severity levels to final problems must take into account the discrepancies between how a given problem may be experienced by participants; for example, one participant may circumvent a problem very quickly, while another may spend a long time overcoming the same problem. To bypass potential conflict between severity levels, levels were assigned according to the majority of problems (Lindgaard & Chattratichart, 2007). In those cases where the contradictory severity levels emerged with an equal number of participants, assignment took place according to the highest severity level (Ebling & John, 2000). Table 11 presents the number of problems for different severity levels from the three TA conditions. The results show that 31% (19 problems) of the total problems extracted from the CTA method were high severity problems (with critical and major effects). However, for the SC condition, 27% (16 problems) of the final problems were high severity problems, and for the AI condition, 25% (16 problems) were high severity problems. The majority of unique problems identified in each TA condition were at a low level of severity (with minor and enhancement effects), 62% for the CTA condition, 75% for the SC condition, and 63% for the AI condition.
Table 11. Final Problem Severity Levels
CTA SC AI
Unique Overlapping Unique Overlapping Unique Overlapping
Critical 0 4 0 4 0 4
Major 5 10 3 9 2 10
Minor 10 28 9 31 12 31
Enhancement 1 2 0 2 5 0
Total 16 44 12 46 19 45
Final usability problem types
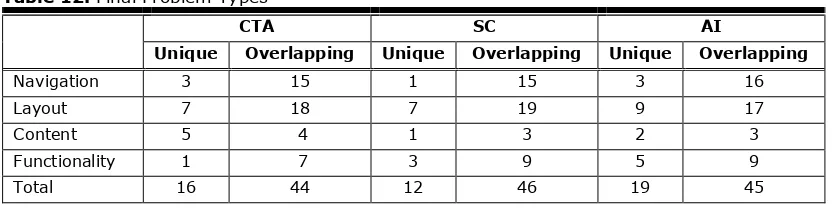
The 98 final problems discovered on the tested website in this study were classified by the usability experts into 23 navigational problems, 44 layout problems, 13 content problems, and 18 functional problems. Table 12 shows the number of final usability problems by their type. The distribution of problems across the four types were similar in the SC and AI conditions, with fewest being content, next, functionality, then navigational problems, and the greatest number being problems related to the layout. The CTA showed a similar pattern with the exception of functionality problems being the fewest number of problems and the content problems being the second last. Regarding the unique problems, the majority of the unique problems found by the three methods were related to the layout problems.
Table 12. Final Problem Types
CTA SC AI
Unique Overlapping Unique Overlapping Unique Overlapping
Navigation 3 15 1 15 3 16
Layout 7 18 7 19 9 17
Content 5 4 1 3 2 3
Functionality 1 7 3 9 5 9
Total 16 44 12 46 19 45
Reliability of problem identification and classification
An independent evaluator was recruited to carry out an inter-coder reliability check on usability problem analysis. The independent evaluator coded the usability problems for the first
Journal of Usability Studies Vol. 12, Issue 3, May 2017 agreement formula provided by Hertzum and Jacobsen (2001) was used to calculate the inter-coder reliability across the six videos.
𝐴𝑛𝑦 − 𝑡𝑤𝑜 𝑎𝑔𝑟𝑒𝑒𝑚𝑒𝑛𝑡 = |𝑃𝑖 ∩ 𝑃𝑗| |𝑃𝑖 ∪ 𝑃𝑗 |
The average any-two agreement for the individual problem identification across the six videos was 70% (individual agreements were 73%, 71%, 69%, 66%, 75%, and 70%). The any-two agreement for the final usability problems was 75% (CTA: 75%, SC: 73%, and AI: 77%), a very good figure. The reliability of the coding of the problem source and severity level was examined using Cohen's Kappa (Barendregt et al., 2006). For the individual problem levels, the resulting Kappa value for the problem source was 0.842, and for problem severity it was 0.671. For the final usability problems, the resulting Kappa value for problem source was 0.885, and the severity level was 0.724. This correlates a high reliability for the coding.
Comparative Cost
The cost of employing the three TA methods under study was measured by recording the time the evaluator spent conducting testing and analyzing the results for each method. Testing time, recorded via an observation sheet, refers to the time taken to carry out the entire testing sessions, including the instruction of participants, data collection, and solving problems that may arise during test sessions. Analysis time, collected via a web-based free time tracking software called Toggle 2 (Version 2013), refers to the time taken to extract the usability
problems from each method’s testing data. As is shown in Table 13, the AI method required the longest session time (844 minutes), whereas the CTA method required the shortest session time (723 minutes). The SC testing lasted for 775 minutes. The total time taken to apply the three verbalization methods was 2342 minutes. ANOVA testing with a Tukey post-hoc analysis revealed that the session time in the AI was significantly longer than in the CTA condition (p = 0.021).
Table 13. Temporal Cost
CTA SC AI Total
Session time (m) 723 775 844 2342
Analysis time (m) 865 912 980 2757
Total time (m) 1588 1687 1824 5099
The total time taken to identify usability problems using the three methods was 2757 minutes, with the AI method requiring the highest amount of time (980 minutes) in comparison to the CTA (865 minutes) and SC methods (912 minutes). A Kruskal Wallis H test with Bonferroni post-hoc analyses were used and showed that the analysis time in the CTA was significantly shorter than in the AI condition (p =.016). The overall results showed that the CTA method incurred the shortest time (1588 minutes), followed by the SC method (1687 minutes), and then the AI method (1824 minutes).
Discussion
Below, the results obtained from this study and the limitations of the study are discussed. TA Methods and Task Performance
The use of proactive interventions in the AI condition slowed down the process of task solving and led to a higher number of mouse clicks and pages viewed compared to the CTA and SC conditions. Ericsson and Simon (1993) warned that the practitioners’ use of interventions could disrupt participants thought processes, causing a change in this process and task performance. This implies that the significant increase in task time and navigational behavior is due to the triple-workload effect of the AI condition, in that participants needed to solve the task, to talk aloud, and also respond to the evaluator’s questions. This finding, therefore, casts doubt on using task outcome in an AI evaluation as an overall indication of the usability of an artifact,
Journal of Usability Studies Vol. 12, Issue 3, May 2017 and on the implicit assumption that the problems found in an AI usability test are by definition real user problems. These results were in line with Hertzum et al. (2009). However, the findings contradicted Olmsted-Hawala et al. (2010) who found that the evaluator’s probing improved participants' task solving accuracy. One explanation may be that the two studies mentioned above did not take steps to control the participants' individual differences by matching them as closely as possible between conditions, and also used different evaluators between different conditions. These additional variables may affect the results.
The SC participants performed their tasks neither better nor worse than the participants in the CTA condition. This corresponds to earlier findings by Olmsted-Hawala et al. (2010). This finding implies that practitioners have a choice between using the traditional TA model put forth by Ericsson and Simon (1993) or the newer model suggested by Boren and Ramey (2000), as these two conditions show no statistically significant differences in task solving accuracy, efficiency, or navigational behavior.
TA Methods and Participants’ Testing Experiences
For the participants’ satisfaction with the tested website, although the AI condition increased participants' task completion time and changed their navigational behavior, it did not lead to changes in their perceptions about the usability of the websites compared to the classic and SC conditions. This finding is in disagreement with the findings of Olmsted-Hawala et al. (2010) who found that participants in the AI were significantly more satisfied with the website compared to participants in CTA and SC. This conflicting result may be explained by the inevitable differences in experimental design, task set, and interface. Another plausible reason could be the low correlation existent in this study between task performance and the
participants’ satisfaction, which was also proved in numerous other studies (Hornbæk & Law, 2007; Nielsen & Levy, 1994).
With regard to the participants’ experience with the TA testing, the evaluator seems to have had a more detrimental effect in the AI condition than in the CTA and SC conditions, with
participants indicating the presence of the evaluator as a disturbance. AI participants also felt that their working condition on the tasks were significantly slower than their CTA and SC counterparts. Once again, as mentioned earlier, these discrepancies can perhaps be explained by the evaluator’s probing.
The CTA and SC participants in our study appeared to have similar testing experiences. Most measures of experience with the TA test questionnaire yielded neutral to positive judgments for the two evaluation methods. Accordingly, it can be concluded that the ecological validity of these two methods (i.e., a method should be comfortable for participants to use) is ensured. No previous study has investigated the participants’ experience with relaxed TA methods, so no comparison can be made. In summary, the findings would seem to suggest that given the choice, participants would prefer to use the CTA or the SC methods rather than the AI method. TA Methods and Usability Problems
Contrary to general emphases on the AI protocol, this study showed no indication that it was superior for identifying usability problems. At the individual problem level, the three conditions yielded a similar number of problems, and no differences were found in terms of problem source. The AI method only identified a higher number of problems with enhancement effect than the CTA and SC conditions. Considering the problem types, the CTA identified a higher number of content problems than the SC methods. However, both the difference in problem severity and types concern a small proportion of problems. At the final problem level, the AI method enabled the detection of only four more final problems. This was at the cost of putting the ecological validity of the method under threat, and the likelihood of false problems. In contrast, the SC method produced slightly fewer issues than the CTA method. In all, the overall picture that arises is one in which the three methods are comparable in terms of number and types of problems detected. This finding is in line with Krahmer and Ummele (2004). TA Methods and Comparative Cost
Journal of Usability Studies Vol. 12, Issue 3, May 2017 Limitations
As with any research, this study has a number of inevitable limitations that could be improved in future work. First, the usability test sessions were performed in a formal laboratory-based setting, an important aspect for observation and analysis of results in a scientific setting. However, this sort of setting is not reflective of the environments in which people typically access the web, and therefore might not have completely captured the normal web browsing behavior of the participants. The second limitation concerns the demographic characteristics of the participants. While the researchers did ensure, in all evaluations, that the participants were evenly divided over the methods with respect to their demographic characteristics, they were nevertheless all drawn from one specific target group, that is, university students. While this factor has not hindered our research, as students represent the main target group of the test objects, it may serve to limit the application of the results to other groups who also make use of the test object, such as faculty and employees. Third, all the participants in the study were also from the same young age group, of a similar educational background, and possessed a similar level of familiarity with the Internet. This might also minimize the utility of applying the results to a broader range of users (e.g., users with low Internet experience or without an academic background, older web users, or children of school age). Fourth, the TA methods in this research were only applied to university library websites. Testing different websites with different kinds of users, such as websites aimed at elderly people, may yield results that are different from the ones presented in this thesis. It seems possible, for instance, that thinking aloud while performing tasks might present greater difficulties for elderly people than for students who have grown up with web technologies. As such, testing websites with various target groups would be very worthwhile. Lastly, the study did not compare the TA methods to silent working. This is a limitation, however, there are studies that have compared both the classic and relaxed TA to silent working and found that the classic TA does not lead to reactivity (e.g., Alshammari, Alhadreti, & Mayhew, 2015; Hertzum et al., 2009); we followed this
assumption in our work, and therefore focused only on comparing the TA methods.
Conclusion
In this paper, we have compared the performance of the traditional concurrent think-aloud method with two interactive versions of the method: the active intervention and the speech-communication methods. The three methods were compared through an evaluation of a library website that involved four points of comparison: overall task performance, test participants’ experiences, quantity and quality of usability problems discovered, and the cost of employing methods.
Our study showed that the evaluator’s active interventions modified participants’ behavior at the interface and negatively affected their feelings towards evaluation. The three protocols facilitate identification of a similar number of usability problems and types. The traditional protocol generated more usability problems in the content category than the speech-communication, and the active interventions produced more enhancement problems. However, both of these
differences concern a small proportion of problems. Lastly, the AI method required considerably more time on the evaluator’s part than the other two methods. Although the traditional and speech-communication methods provided similar results in this study to a large extent, the former methods enjoy one critical advantage over the latter: directness and simplicity of
Journal of Usability Studies Vol. 12, Issue 3, May 2017
Tips for Usability Practitioners
Having discussed the degree of validity and utility of the three TA methods in the previous sections, we offer the following tips for usability practitioners:
• The varying effects of the different TA methods should be considered seriously, as the findings suggest that results may differ depending on the method used. Therefore, practitioners should consider the pros and cons of TA methods when deciding on a TA method.
• When documenting TA protocol, we recommend that, rather than writing a vague statement such as “we had participants talk aloud,” practitioners should describe the methods used and procedures followed in detail.
• Be aware of the negative effects the AI method has on user performance. This triggers alarm signals that data collected using this method might be a false representation of the user's interaction with the tested system.
• Ericsson and Simon's guidelines for interaction should be followed in collecting TA data. There should be minimal interaction between evaluator and participants to avoid effecting participants’ task performance.
• Practitioners can collect data on participants’ satisfaction with test objects using any of the three TA methods studied, as there were no statistically significant differences between the conditions.
• Usability practitioners should be aware that participants’ satisfaction with the perceived usability of test objects does not correlate with actual usability measures. This implies that user satisfaction should not be used as a sole metric for determining the usability of the tested interface.
• Usability practitioners should take into account when planning to conduct an AI test that the method requires a longer time for the application and analysis of the results than the classic CTA method.
Acknowledgements
The authors would like to thank all those people who took time to take part in the experiments. Thanks also to the anonymous reviewers for their helpful comments.
References
Aaron, M. (2005). User interface design’s return on investment: Examples and statistics. In R. G. Bias, & D. J. Mayhew (Eds.), Cost–justifying usability: An update for the Internet age (pp. 17–39). Burlington, MA: Morgan Kaufmann Press.
Als, B. S., Jensen, J. J., & Skov, M. B. (2005). Comparison of think–aloud and constructive interaction in usability testing with children. In M. Eisenberg, & A. Eisenberg (Eds.),
Proceedings of the 2005 Conference on Interaction Design and Children. IDC 2005. Boulder, Colorado. 8–10 June (pp. 9–16). New York, NY: ACM.
Alshammari, T., Alhadreti, O., & Mayhew, P. (2015). When to ask participants to think aloud: A comparative study of concurrent and retrospective think-aloud methods. International Journal of Human Computer Interaction, 6(3), 48–64.
Barendregt, W., Bekker, M. M., Bouwhuis, D. G., & Baauw, E. (2006). Identifying usability and fun problems in a computer game during first use and after some practice. International Journal of Human-Computer Studies, 64 (9), 830–846.
Boren, T., & Ramey, J. (2000). Thinking aloud: Reconciling theory and practice. IEEE transactions on professional communication, 43(3), 261–278.
Brooke, J. (1996). SUS: A “quick and dirty” usability scale. In P. Jordan, B. Thomas, B.
Journal of Usability Studies Vol. 12, Issue 3, May 2017 Cooke, L. (2010). Assessing concurrent TA protocol as a usability test method: A technical
communication approach. IEEE Transactions on Professional Communication, 53 (3), 202– 215.
Dumas, J. S., & Redish, J. (1999). A practical guide to usability testing. Intellect Books. Ebling, M. R., & John, B. E. (2000). On the contributions of different empirical data in usability
testing. Proceedings of the 3rd conference on designing interactive systems: Processes, practices, methods, and techniques (pp. 289–296). New York, NY: ACM.
Ericsson. K. A., & Fox. M. C. (2011). Thinking aloud is not a form of introspection but a qualitatively different methodology: Reply to Schooler. Psychological Bulletin, 137(2), 351– 354.
Ericsson, K. A., & Simon, H. A. (1980). Verbal reports as data. Psychological Review, 87(3), 215.
Ericsson, K. A., & Simon, H. A. (1993). Protocol analysis: Verbal reports as data (revised ed.) Cambridge, MA: MIT Press.
Gray, W. D., & Salzman, M. C. (1998). Damaged merchandise? A review of experiments that compare usability evaluation methods. Human–Computer Interaction, 13(3), 203–261. Hertzum, M. (2006). Problem prioritization in usability evaluation: From severity assessments
toward impact on design. International Journal of Human–Computer Interaction, 21(2), 125–146.
Hertzum, M., Hansen, K. D., & Andersen, H. H. K. (2009). Scrutinising usability evaluation: does thinking aloud affect behaviour and mental workload? Behaviour & Information Technology, 28 (2), 165-181.
Hertzum, M., & Jacobsen, N. E. (2001). The evaluator effect: A chilling fact about usability evaluation methods. International Journal of Human-Computer Interaction, 13(4), 421–443. Hornbæk, K. (2010). Dogmas in the assessment of usability evaluation methods. Behaviour and
Information Technology, 29(1), 97–111.
Hornbæk, K., & Frøkjær, E. (2008). A study of the evaluator effect in usability testing. Human– Computer Interaction, 23(3), 251–277.
Hornbæk, K., & Law, E. L. C. (2007). Meta-analysis of correlations among usability measures. Proceedings of the SIGCHI conference on Human factors in computing systems (pp. 617– 626). New York, NY: ACM.
Krahmer, E., & Ummelen, N. (2004). Thinking about thinking aloud: A comparison of two verbal protocols for usability testing. IEEE Transactions on Professional Communication, 47 (2), 105–117.
Kruskal, W. H., & Wallis, W.A. (1952). Use of ranks in one–criterion variance analysis. Journal of the American Statistical Association, 47(260), 583–621.
Lavery, D., Cockton, G., & Atkinson, M. P. (1997). Comparison of evaluation methods using structured usability problem reports. Behaviour and Information Technology, 16(4–5), 246– 266.
Lewis, C., & Rieman, J. (1993). Task-centered user interface design. A Practical Introduction. Available at http://www.hcibib.org/tcuid/
Lindgaard, G., & Chattratichart, J. (2007, April). Usability testing: What have we overlooked? Proceedings of the SIGCHI Conference on Human factors in Computing Systems (pp. 1415– 1424). New York, NY: ACM.
Macefield, R. (2009). How to specify the participant group size for usability studies: A practitioner's guide. Journal of Usability Studies, 5(1), 34–45.
Journal of Usability Studies Vol. 12, Issue 3, May 2017 McDonald, S., Edwards, H., & Zhao, T. (2012). Exploring TAs in usability testing: An
international survey. IEEE Transactions on Professional Communication, 55(1), 1–17. Nagpal, R., Mehrotra, D., & Bhatia, P. K. (2016). The state of art in website usability evaluation
methods. In S. Saeed, Y. A. Bamarouf, & T. Ramayah, Design Solutions for User-Centric Information Systems (p. 275). Saudi Arabia: IGI Global.
Naveedh, S. (2015). Exploring the use of TA methods in usability practice (Master’s Dissertation, University of East Anglia).
Nielsen, J. (1993). Usability engineering. San Francisco, CA: Morgan Kaufmann Publishers Inc. ISBN: 0-12-518406-9.
Nielsen, J., & Levy, J. (1994). Measuring usability: Preference vs. performance. Communications of the ACM, 37(4), 66–75.
Norman, K. L., & Panizzi, E. (2006). Levels of automation and user participation in usability testing. Interacting with Computers, 18(2), 246–264.
Peute, L. W., de Keizer, N. F., & Jaspers, M. W. M. (2010). Cognitive evaluation of a physician data query tool for a national ICU registry: Comparing two think aloud variants and their application in redesign. Studies in Health Technology and Informatics, 160(1), 309–313. Olmsted-Hawala, E., & Bergstrom, J. R. (2012). TA protocols: Does age make a difference.
Proceedings of Society for Technical Communication (STC) Summit, Chicago, IL.
Olmsted-Hawala, E. L., Murphy, E. D., Hawala, S., & Ashenfelter, K. T. (2010). TA protocols: A comparison of three TA protocols for use in testing data-dissemination web sites for usability. Proceedings of the SIGCHI conference on human factors in computing systems (pp. 2381–2390). New York, NY: ACM.
Rubin, J., & Chisnell, D. (2008). Handbook of usability testing: How to plan, design and conduct effective tests. Indianapolis, IN: Wiley Publishing, Inc.
Sauro, J. (2015). How confident do you need to be in your research? Available at http://www.measuringu.com/blog/confidence-levels.php
Sonderegger, A., Schmutz, S., & Sauer, J. (2016). The influence of age in usability testing. Applied Ergonomics, 52, 291–300.
Sova, D. H., & Nielsen, J. (2003). 234 tips and tricks for recruiting users as participants in usability studies. Available at
https://media.nngroup.com/media/reports/free/How_To_Recruit_Participants_for_Usability _Studies.pdf
Sun, X., & Shi, Q. (2007). Language issues in cross cultural usability testing: A pilot study in China. Usability and internationalization. Global and local user interfaces, 274–284. Tullis, T., & Albert, B. (2008) Measuring the user experience. Burlington MA: Elsevier Inc. van den Haak, M. J., De Jong, M. D., & Schellens, P. J. (2004). Employing TA protocols and
constructive interaction to test the usability of online library catalogues: A methodological comparison. Interacting with computers, 16(6), 1153–1170.
Vermeeren, A. P. O. S., Bouwmeester, K., Aasman, J., & de Ridder, H. (2002). DEVAN: A tool for detailed video analysis of user test data. Behaviour & Information Technology, 21(6), 403–423.
Wixon, O. (2003). Evaluating usability methods: Why the current literature fails the practitioner. Interactions, 10(4), 28–34.
Woolrych, A., & Cockton, G. (2001). Why and when five test users aren’t enough. Proceedings of IHM-HCI 2001 conference, Cépaduès Editions, Toulouse, France (Vol. 2, pp. 105-108). Zhao, T., & McDonald, S. (2010). Keep talking: An analysis of participant utterances gathered
Journal of Usability Studies Vol. 12, Issue 3, May 2017 Zhao, T., McDonald, S., & Edwards, H. M. (2012). The impact of two different TA instructions in
a usability test: A case of just following orders? Behaviour & Information Technology, 33(2), 163–183.
About the Authors
Obead Alhadreti Dr. Alhadreti is an assistant professor at the College of Computer, Umm Al-Qura University, Saudi Arabia. He has been involved in usability testing since 2009. His doctoral research focuses on the use of the TA methods within usability testing. His interests involve usability evaluation, cultural usability, and user experience.
Pam Mayhew
Dr. Mayhew is a senior lecturer in the School of Computing Sciences at the University of East Anglia in Norwich. Her broad interest is in the development of successful, usable systems via appropriate stakeholder participation. This has led to a particular concentration on user centered
Journal of Usability Studies Vol. 12, Issue 3, May 2017
Appendix A: List of Interventions Types
Intervention type Intervention trigger
Reminder Participants fall silent more than 15 seconds; the evaluator reminds them to keep talking.
Clarification When participants solve the task with unclear goals or actions and when participants make vague comments, the evaluator asks for a clarification. Ask
explanation
Participants express difficulties, feelings, likes, dislikes, etc., without giving an explanation; the evaluator asks for an explanation.
Interjection exploration
Participants make an interjection but no further comments.
Seek opinion Participants give an evaluation summary of information or outcome of their actions; the evaluator asks about the user experience and ease of task in general.
Ask suggestion
Participants verbalize difficulties or negative feelings, disproval with known system based causes; the evaluator asks for suggestions.
User expectation
Participants indicate something does not meet their expectations; the evaluator inquires about their expectations.
Task continuation
Participants think the task is finished. Participants are too chatty.
Journal of Usability Studies Vol. 12, Issue 3, May 2017
Appendix B: Task List
Task ID Task description
T1 You have borrowed a laptop from the library of Durham University for 4 hours, but it turned out that you needed to use it for 6 hours instead. Using the website, please find the charge for a late return. Can you find it?
T2 You want to find how many local studies the library catalog has on the topic of “pollution.” Can you find them?
T3 You are taking a course on “Web Technology.” Using the site, find the reading list for the course. Can you find it?
T4 You are a big fan of the author Harriet Bulkeley and want to know how many publications are written by your favorite author on the subject of “Climate change.” Can you find it?
T5 You want to book a room at the library to study for your coming exam. Using the website, find the maximum time that you can book an individual room for. Can you find it?
T6 You are a first-year PhD student in law at the Department of Law at Durham University and want to find all PhD theses that have the key word “law” in the title in Department of Law at Durham University. Can you find it?
T7 You want to find how many publications that have the keyword “usability” in their titles were published between 2010 and 2015. Can you find them?
T8 You are a part-time student who works off-campus for most of the time. You want to know what services the library offers for off-site users. Can you find them? T9 You want to find how many publications the library catalog has on the topic