Published by the
Iranian Chemical Society
Anal. Bioanal. Chem. Res., Vol. 5, No. 1, 171-182, June 2018.
A New Colorimetric Azo-azomethine Probe for Fluoride Ion Detection Based on the
Proton Transfer Signaling Mode: Real-life Applications
Raziyeh Arabahmadi*
Chemistry Department, Payame Noor University (PNU), Tehran 19395-3697, Iran
(Received 20 November 2017, Accepted 22 January 2018)
Four novel receptors were designed and synthesized for colorimetric detection of F- ions. The introduction of four electron withdrawing
groups into the backbone of the receptors makes the two phenolic groups efficient hydrogen bonding sites. The binding properties of
receptors with anions were examined for the first time by UV-Vis, 1H NMR and fluorescence spectroscopies. The addition of F- resulted in
a marked red shift of the charge-transfer absorbance band accompanied by a color change. The addition of other anions such as Cl-, Br-, I-,
NO3
-, ClO4
-, CN- and HSO4
-
did not result in an observable spectral change and solution color change. The 1H NMR titration revealed that
the colorimetric response could be the direct consequence of hydrogen-bond formation between the phenolic groups of the receptors and
fluoride ions followed by deprotonation. The current sensory systems could as well be served as practical tool for immediate and qualitative
detection of inorganic 'anions in real-life applications'.
Keywords: Host-guest, Bathochromic, Electron-withdrawing, Chromogenic
INTRODUCTION
Many possible applications in analytical chemistry and biomedical research have caused a considerable amount of research attention to focus on the design of receptors with the ability to selectively bind cation, neutral and anionic species [1-5]. The detection and control of chemical constituents comprised of cation, anions and neutral molecules have become a noteworthy task in many applications related to the management of minimum standards of edible products, environment, agriculture sciences, medicine and health sciences. The use of chemosensors is among the effective methods to detect analytes, showing a distinct “naked-eye” color transition upon a recognition event. To quantify the detection process, the change of characteristic absorption and/or emission band(s) of the sensor is used, in relation to binding constant, stoichiometry of the resultant complex, selectivity, sensitivity, etc.Among a large variety of molecules utilized
*Corresponding author. E-mail: Arabahmadi_r@yahoo.com
neutral molecule. So, most of the chromogenic sensors are available for only charged guests. Many biological processes depend on the presence or transport of anions. Also anions are used to carry out chemical transformations and crucial to the life. They are considered both as important and harmful in industrial and pollution processes. Indeed, only a few sensors have been reported that are capable of fluoride ion in water. Furthermore, most of the determination processes are limited to either recognition of TBAF or use of test papers which needseveral minutes to complete detection and are far away from real-life applications [12]. Among various anions, fluoride is of particular importance because of its applications in many industrial products.A large intake of fluoride ions can lead to human pathologies, such as osteoporosis, fluorosis and other diseases [13-16].Thus, it is important to develop new and sensitive methods for fluoride ion detection. It was decided to explore the synthesis and properties of new azo-dyes azo-dyes, for environmental applications which can potentially yield a new class of chromogens for the selective and quantitative detection of ions. This paper presents the synthesis, characterization, and chromogenic studies on a Schiff base hosts 1a, 1b, 2a and 2b 'with azophenol moieties as end groups to yield two hydroxyl groups capable of forming H-bonding or undergoing deprotonation in the presence of anion. I prepared a set of four hosts 1a, 1b, 2a and 2b based on azophenol-imine platform, cf. Scheme 1.
EXPERIMENTAL
Physical Measurements
C, H and N composition determinations were undertaken using an Elemental Analysis System Gmb H Vario EL III. Electronic spectra of the receptors in DMSO were recorded on a Perkin-Elmer Lambda 15. FTIR spectra of the compounds as KBr disks were obtained in a range of 4000-300 cm-1 with a Galaxy series FTIR 5000 spectrophotometer. Melting points of all newly prepared compounds were determined on Electrothermal 9200 apparatus. 1H NMR spectroscopy was performed using a Bruker 300 and 400 MHz spectrometer.
Materials
All solvents were of reagent grade quality and were
purchased from Merck Chemical Company and used as received without further purification. All anions in the form of tetrabutylammonium salts were purchased from Fluka and used without further purification.
Synthesis
Azo dyes (1 and 2) were synthesized according to the well-known literature procedure [17]. General procedure for the synthesis of azo-azomethine dyes Compounds 1a, 1b, 2a and 2b were prepared by taking azo-coupled precursors 1-2, (2 mmol) and related diamine, (1 mmol) in absolute ethanol. The mixture was heated in water bath for 4 h at 80 °C with stirring. The progress of the reaction was monitored by TLC. The mixture was filtered and the obtained solid was washed with hot ethanol. The resulted product was dried in air.
Bis (4-(2-chloro-4-nitro-phenylazo)-phenol)
O-phenylenediimine (1a). Brown, yield: 67%, m. p.: 188- 191 °C. Anal. Calcd. for C32H20N8O6Cl2.CHCl3.H2O, C:
48.28, H: 2.8, N: 13.64. Found: C: 48.02, H: 2.18, N: 14.1%. FTIR (KBr, cm-1): 3360 (-OH group), 1612 (C=N group),1587 (C=C), 1516 (phenol ring), 1496 (N=N), 1278 (C-O). 1H NMR (d
6-DMSO, 300 MHz, ppm) δ: 14 (2H, s),
8.8 (2H, s), 8.5 (d, 2H, J = 11.1), 8.3 (d, 2H, J = 8.04), 8.0 (d, 2H, J = 8.7), 7.8 (d, 2H, J = 8.9), 7.7 (s, 2H), 7.3 (s, 2H), 7.2 (d, 4H, J = 8.8).λmax (nm) (ε (M-1 cm-1)): 210 (21450),
315 (13725), 410 (12300) in DMSO.
Bis (4-(2-chloro-4-nitro-phenylazo)-phenol) diethylenediimine (1b). Brownish, yield: 46%, m. p.: 143-145 °C. Anal. Calcd. for C30H25N9O6Cl2.9H2O, C: 42.87, H:
5.11, N: 13.32. Found: C: 42.38, H: 4.73, N: 14.23%. FTIR (KBr, cm-1): 3270 (-OH group), 1643 (C=N group),1612
(C=C), 1514 (phenol ring), 1408 (N=N), 1271 (C-O). 1H NMR (d6-DMSO, 300 MHz, ppm) δ: 8.32 (2H, s), 8.37 (2H,
s), 8.1 (2H, d, J = 9.0 Hz), 7.9 (2H, s), 7.8 (2H, d, J = 9.4 Hz), 7.6 (2H, d, J = 8.9 Hz), 6.6 (2H, d, J = 9.8 Hz), 3.6 (4H, s), 2.9 (4H, s), 3.4 (NH, s). λmax (nm) (ε (M-1 cm-1)):
250 (7100), 440 (7350) in DMSO.
Bis (4-(4-chloro-3-nitro-phenylazo)-phenol)
O-phenylenediimine (2a). Dark brown, yield: 56%, m. p.: 179-182 °C. Anal. Calcd. for C32H20N8O6Cl2.H2O, C: 54.7,
H: 3.1, N: 15.9 Found: C: 54.16, H: 3.2, N: 15.57%. FTIR (KBr, cm-1): 3020 (-OH group), 1614 (C=N group),
1H NMR (d
6-DMSO, 400 MHz, ppm) δ: 8.19 (2H, d, J =
2.26 Hz), 7.93 (2H, d, J = 2.3), 7.9 (4H, d, J = 1.86), 7.85 (2H, s), 7.83 (2H, s), 7.8 (2H, d, J = 2.6), 7.79 (2H, d, J = 2.6), 6.6 (2H, d, J = 10.9). λmax (nm) (ε (M-1 cm-1)): 320
(15050), 355 (14725) in DMSO.
Bis (4-(4-chloro-3-nitro-phenylazo)-phenol) diethylenediimine (2b). Light brown, yield: 33%, m. p.:
128 °C. Anal. Calcd. for C30H25N9O6Cl2.2H2O, C: 50.44, H:
4.05, N: 17.63 Found: C: 51.44, H: 4.0, N: 18.28%. FTIR (KBr, cm-1): 3427 (-OH group), 1614 (C=N group), 1572 (C=C), 1531 (phenol ring), 1469 (N=N), 1288 (C-O).
1H NMR (d
6-DMSO, 400 MHz, ppm) δ: 8.2 (2H, d, J = 2.41
Hz), 8.1 (2H, d, J = 2.4 Hz), 8.05 (2H, d, J = 8.8 Hz), 7.9 (2H, s), 7.7 (2H, d, J = 8.8 Hz), 7.2 (2H, d, J = 2.0 Hz), 7.01
OH CHO
N=N NaNO2 , HCl
R
NH2
Salicylaldehyde
R
R
1 2
OH N
N N
N
OH N
N
R R
R
1 2
EtOH
N H
1a, 2a
1b, 2b
R
'
R
'
2-Cl-4-NO2 4-Cl-3-NO2
2-Cl-4-NO2 4-Cl-3-NO2
(2H, d, J = 8.8 Hz), 3.66 (4H, t, J = 5.2 Hz), 2.93 (4H, t, J = 5.1 Hz), 3.4(NH, s). λmax (nm) (ε (M-1 cm-1)): 270 (9925),
410 (13300) in DMSO.
RESULTS AND DISCUSSIONS
Receptors 1a, 1b, 2a and 2b prepared by single step condensation reaction possess the ability to sense anions colorimetrically. These Schiff base receptors sense anions through hydrogen bonding interaction through the phenolic
OH.All the compounds were characterized by IR, UV-Vis and 1H NMR spectroscopic methods as well as elemental analyses.
Colorimetric Analysis
The sensing ability of the receptors 1a, 1b, 2a and 2b in DMSO/H2O (9:1, v/v) with halide anions (F-, Cl-, Br-, I-,
NO3-, ClO4-, CN-, HSO4-, OH-, H2PO4- and OAc-)titrations
were tested by colorimetric analysis.First, the halide anions (F-, Cl-, Br-, I-, NO3-, ClO4-, CN-, HSO4-, OH-, H2PO4- and
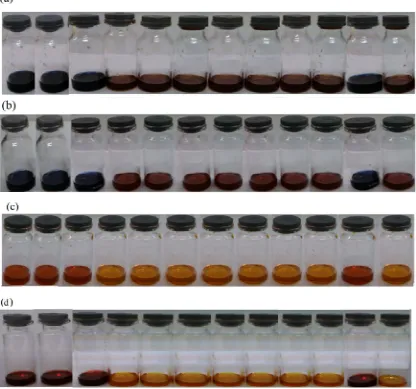
Fig. 1. Colour changes of receptors (a)1a, (b)1b, (c) 2a and (d)2b (4×10⁻⁵ M) in 9:1, DMSO/H2O solution with the
addition of 2 equiv. of various anions. From right to left: none, F-, Cl-, Br-, I-, NO3-, ClO4-, CN-, HSO4-,OAc-,
Fig. 2. UV-Vis titration of 1a (4 × 10⁻⁵ M) in DMSO/H2O (9:1) with increasing concentrations of F-, Inset: The
titration curves for F- show the 1:1stoichiometry.
OAc-) were added as tetrabutylammonium salts to 5 × 10⁻⁴ M solutions of the receptors in 9:1, DMSO/H2O. In visual
investigation, the brown solution of 1a turns to blue color on the addition of 2 equiv. F-, OH-, H
2PO4- and OAc- ions,
respectively, (Fig. 1a), and the receptor 1b turns to blue on the addition of 2 equiv. of F-, OH-, H2PO4- and OAc- ions
(Fig. 1b).In the naked eye experiments,yellow color of 2a changed to orange, for F-, OH-, H2PO4- and OAc- ions,
however, the intensity of color change was marginal (Fig. 1c). The receptor 2b showed dramatic color change from yellow to red in the presence of F-, OH-, H2PO4- and OAc
-ions (Fig. 1d). So, the results indicated that visible color changes were most probably due to the deprotonation of the OH fragment by F- and hydrogen bonding is not responsible for the drastic color change. While the receptor bound anions, hydrogen bonds were constructed to form stable complexes, and the electron density in the supramolecular system was much increased to enhance the charge-transfer interactions between the electron rich and electron deficient moieties, which resulted in a visible color change. The remarkable combination of anion-specific response/non response makes receptors an especially effective colorimetric anion sensor under the solution-phase conditions [18]. The receptors 1a and 1b showed remarkable color change compared to the receptors 2a and 2b as seen in Fig. 1. These observations are due to the variation in the position of chromogenic signaling units (-Cl and -NO2) in
the aniline ring of the receptors 1a and 1b compared to the receptors 2a and 2b. No noticeable colour change was observed with addition of other anions (Cl-, Br-, I-, NO3-,
ClO4-, CN- and HSO4-) even in excess.In fact, sensing F- in
natural aqueous environments without any spectroscopic instrumentation has been very useful in preventing fluorosis caused by the fluoride toxicity in undeveloped regions. However, since many other anions such as chloride were present in most water at much higher concentrations than fluoride, it was important to know that chloride (or other common anions) did not cause color changes at concentrations normally found in water.
UV-Vis Spectroscopic Studies
To gain a deeper insight into the binding characteristics of the prepared sensors, the sensing behavior of the receptors 1a, 1b, 2a and 2b towards anions (F-, Cl-, Br-, I-,
NO3-, ClO4-, CN-, HSO4-, OH-, H2PO4- and OAc-) was also
investigated by the UV-Vis spectroscopy [19-21]. To explore the interaction between 1a and F-, UV-Vis absorption spectral variation of 1a (4 × 10⁻⁵ M) was
investigated during titration with different concentrations of F- in DMSO/H2O (9:1) (Fig. 2). Receptor 1a displayed
strong absorption bands at 315 and 400 nm. With incremental addition of fluoride anion (0 to 2 eq), both bands decreased, while a new absorbance at 580 nm increased gradually. Additionally there were two well-defined isosbestic points at 340 and 455 nm, respectively. The titration profile of 1a with F- shown in inset of Fig. 2 demonstrated 1a equiv of F- reacting with 1 equiv of 1a
could quickly reach equilibrium, indicating the formation of a 1a-F- complex of 1:1 stoichiometry. From the UV-Vis titration data, the binding constant value (K) for 1a and fluoride was determined to be 1.02 × 10⁻⁶ M-1 using the Benesi-Hildebrand equation (Fig. 3) [22,23]. The detection limit of receptor 1a for the analysis of F- ions was calculated to be 9.007 × 10³ M(Table 1).
The characteristic absorption spectrum modulated significantly in the presence of F- ions. Subsequent addition of TBAF to the receptor 1b induces a decrease in the absorption band at 440 nm with the concomitant development of a new band around 525 nm (Fig. 4). The presence of clear isosbestic points at 360 and 470 nm indicates the formation of more than one species in the medium. The negative charge brought about by the anion induced deprotonation increases the dipole moment and stabilizes the excited state causing a red shift of 1b host. These results demonstrate that a complex formation of 1b with F- anion is taking place via hydrogen bonding
electrostatic interactions.
The UV-Vis spectrum of receptor 2a itself shows two bands centered at 320 and 355 nm in 9:1, DMSO/H2O (Fig.
5). Upon successive addition of the F- ion, the bands at 355 nm and specially 320 nm gradually became weak and a new red shifted absorption band appeared at 485 nm (charge transfer band). The formation of well-defined isobestic points at 290 and 395 nm clearly shows the formation of new species by the influence of F- with 2a.
UV-Vis spectrum of receptor 2b shows two bands at 270 and 410 nm. As shown in Fig. 6, upon addition of F- ion to
nm decreased gradually; concomitantly a new band at 515 nm emerged. The isosbestic points at 390 and 500 nm were observed respectively, which demonstrated the existence of a well-defined stoichiometric complex.
The fluoride induced deprotonation process is fully reversible as evidenced from the addition of CH3OH and
H2O. The addition of a polar protic solvent, such as
methanol, results in a gradual decrease of absorbance in UV-Vis studies and reverse color change.So, the receptors unfortunately cannot be used in fully aqueous medium. This is presumably because protic solvent competes for F- with the OH moiety, moreover, the presence of a relatively high amount of protic solvent disfavors the formation of the deprotonated receptors 1a, 1b, 2a and 2b.
The detection limitation of sensors toward F- was calculated based on UV-Vis titration. Moreover, the association constants (Ka) for designed sensors with the F-
ion were calculated using the Benesi-Hildebrand equation (Supplementary data, Figs. S16). The Job’s plot method exhibited the formation of 1:1 stoichiometry complexes of 1a, 1b, 2a and 2b with fluoride (Supplementary data, Figs. S17).
A summary of the characteristics of the obtained sensor are presented in Table 1. Similar changes were observed in UV-Vis spectra of the receptors 1a, 1b, 2a and 2b upon addition of OH-, H
2PO4- andOAc- ions (Supplementary data,
Fig. S18). The interference was studied in the case of fluoride determination. The effects of competing ions such as Cl-, Br-, I-, NO3-, ClO4-,CN- and HSO4- were also
evaluated. The date clarified that the existence of these ions did not cause any significant interference. The easy-to-prepare test kit can be utilized to roughly and quantitatively detect and estimate the concentration of fluoride ions (Supplementary data, Fig. S19) [10].
1
H NMR Spectra
The interaction of receptor 1a with fluoride was corroborated by 1H NMR titration experiments. The 1H NMR spectra of 1a, 1b, 2a and 2b, obtained at ambient temperature, in d6-DMSO, display a group of signals
corresponding to the hydrogens of each molecule.The OH protons of azo-azomethine dyes exhibit a slightly broad singlet resonance at 14.02 ppm.The imine protons of 1a, 1b, 2a and 2b exhibit a singlet resonance at 7.85-8.8 ppm.The interaction of 1a with fluoride was corroborated by 1H NMR experiments carried out in DMSO-d6 solution. To further
shed light on the nature of the interactions between 1a and the anions, as an example, 1H NMR spectral changes upon
addition of F-, as their tetrabutylammonium salts, to the DMSO-d6 solution of 1a were investigated. Obviously
observed from Fig. 7, the peak at 14.02 ppm corresponding to the proton of the phenolic OH group disappearance of the -OH protons upon addition of 2 eq of TBAF indicates strong H-bond interaction between the 1a recognition site and fluoride anion. The deprotonation of -OH group led to an increasing in electronic density of the phenyl group, so, the resonances for the -CH=N- proton showed obvious upfield shifts.In the presence of 3 eq of fluoride ions an
Table 1. Data Obtained from the UV-Vis Spectra upon Titration of 1a, 1b, 2a and 2b with n-Bu4N+F- in DMSO/H2O
Receptor Receptor, λmax
(nm)
Complex, λmax
(nm)
Bathochromic
shift, Δλ max
(nm) Isosbestic point (nm) Ka (M) Detection limit
(M-1)
1a 315 580 265 340, 455 9.007 × 10³ 1.02 × 10⁻⁶
1b 440 525 85 360, 470 10.075 × 10³ 1.22 × 10⁻⁶
2a 355 485 130 290, 395 2.995 × 10³ 1.52 × 10⁻⁶
Fig. 4. UV-Vis titration of 1b (4 × 10⁻⁵ M) in DMSO/H2O (9:1) with increasing concentrations of F-. Inset:
The titration curves for F- show the 1:1stoichiometry.
Fig. 5. UV-Vis titration of 2a (4 × 10⁻⁵ M) in 9:1, DMSO/H
2O with increasing concentrations of F-, Inset:
additional sharp peak at 16.3 ppm appeared which is due to the deprotonation of the chromogenic 1a and the subsequent formation of [HF2-] species. The phenolic OH protons
disappeared completely upon addition of fluoride anions, and the aromatic protons undergo a scrambling as well as a high field shift which can be attributed clearly to the significant electronic effect caused by the hydrogen bonding and removal of the proton and formation of new species in solution which are less aromatic [24,25]. Correspondingly, the binding mode of 1a with F- was proposed and is given in Fig. 7.
Cyclic Voltammetry Measurements
The electrochemical properties of the ligands 1a, 1b, 2a and 2b were studied by cyclic voltammetry in DMSO containing 0.1 M tetra (n-butyl) ammonium perchlorate. Cyclic voltammetry of azo-azomethine ligands indicates
that compounds have quasi-reversible redox behavior and some of the compounds give irreversible and reversible reduction [26,27]. The reduction process of ligands 1a, 1b, 2a and 2b occurs at more negative potentials in the range of -0.1 to -1.3 V. Representative data are also shown in Figs. 8a-d. However, it shows that the substituted groups have a significant effect on the electrochemical behavior of the 1a, 1b, 2a and 2b compounds. The cyclic voltammogram of compound 1a exhibits reversible reduction wave at -1.04 V. Also, a reversible oxidation wave is observed for compound 1a at 0.71 V. The reversible reduction waves are observed for compounds 1b and 2a at -0.34 V and at -0.39 V, respectively. The cyclic voltammetry of compound 2b shows two reversible waves, one of which is appeared at -0.34 V and the other is observed at -1.24 V.Also, an irreversible oxidation wave isobserved at 0.85 V. The azo-dyes display oxidations at more positive potentials as a
Fig. 6. UV-Vis titration of 2b (4 × 10⁻⁵ M) in DMSO/H
2O (9:1) with increasing concentrations of F-, Inset:
Fig. 7. Partial 1H NMR (300 MHz) spectra of host 1a in DMSO-d6 in the (A) absence, (B) presence of 1.0 equiv., and
consequence of the destabilizing effect of the electron-withdrawing group on the arylazo moiety [28]. The reduction process may be caused by the partial reduction of
the imine bonds to secondary amines. This process may also be associated with the reduction of the azo bonds [29]. In general, the reduction of imines is believed to occur via two well separated steps and can follow one of two mechanisms
[30,31].
CONCLUSIONS
To conclude, receptors 1a, 1b, 2a and 2b were designed and synthesized for the colorimetric sensing application.
The receptors 1a, 1b, 2a and 2b were able to distinguish F- ions colorimetrically over other anions. Selective binding of
the receptors with fluoride ion through hydrogen-bonding interactions gave rise to a dramatic colour changes with a concomitant bathochromic shift.The sensors have proven to be highly selective for fluoride and show remarkable color
changes upon fluoride binding in DMSO/H2O (9:1), which
enable us to discriminate F- ion from other anions including Cl-, Br-, I-, NO3-, ClO4-, CN- and HSO4- just by naked eye.
The behavior of these new compounds towards anions, e.g.
fluoride, was investigated by UV-Vis and fluorescence
spectroscopy in DMSO/H2O (9:1). Successfully, the current
sensory systems could as well be served as practical tool for
immediate and qualitative detection of inorganic 'anions in real-life applications'.
ACKNOWLEDGMENTS
The author would like to thank the Research Council of Payame Noor University for the financial support of this research (grant number: 161115422).
REFERENCES
[1] G. Feng, L. Geng, T. Wang, J. Li, X. Yu, Y. Wang, Y. Li, D. Xie, Talanta 132 (2015) 625.
[2] D. Udhayakumari, S. Velmathi, J. Lumin 167 (2015) 65.
[3] X.-M. Liu, Y.-P. Li, Y.-H. Zhang, Q. Zhao, W.-C.
Song, J. Xu1, X.-H. Bu, Talanta 131 (2015) 597. [4] M. Lee, J.H. Moon, K.M.K. Swamy, Y. Jeong, G.
Kim, J. Choi, J.Y. Lee, J. Yoon, Sensors Actuators B 199 (2014) 369.
[5] H. Çiftçi, Y. Oztekin, U. Tamer, A. Ramanavicine, A. Ramanavicius, Talanta 126 (2014) 202.
[6] Color Chemistry, in: A.T. Peters, H.S. Freeman (Eds.), The Design and Synthesis of Organic Dyes and Pigments, Elsevier Science Publishers Ltd., England, 1991, Chap. 9.
[7] H. Zollinger, Color Chemistry. Syntheses, Properties,
and Applications of Organic Dyes and Pigments, 3rd Revised ed., VHCA, Zurich and Wiley-VCH, Weinheim, 2003, Chap.14, 15.
[8] P.K. Baviskar, J.B. Zhang, V. Gupta, S. Chand, B.R. Sankapal, J. Alloy Compd. 510 (2012) 33.
[9] R. Arabahmadi, M. Orojloo, Saeid Amani, Anal.
Methods 6 (2014) 7384.
[10] R. Arabahmadi, S. Amani, Supramol. Chem. 26 (2014) 321.
[11] M. Ashraf, A. Teshome, A.J. Kay, G.J. Gainsford,
M.D.H. Bhuiyan, I. Asselberghs, K. Clays, Dyes Pigm. 95 (2012) 455.
[12] Z.H. Lin, S.J. Ou, C.Y. Duan, B.G. Zhang, Z.P. Bai, Chem. Commun. (2006) 624.
[13] K.L. Kirk, Biochemistry of the Halogens and Inorganic Halides; Plenum Press, New York, 1991. P. 58.
[14] A. Wiseman, Handbook of Experimental
Pharmacology XX/2, Vol. 2; Springer-Verlag: Berlin, 1970. p. 48.
[15] S. Guha, S. Saha, J. Am. Chem. Soc. 132 (2010) 17674.
[16] R.H. Dreisbuch, Handbook of Poisoning, Lange
Medical Publishers, Los Altos, CA, 1980.
[17] R. Arabahmadi, S. Amani, Molecules 17 (2012) 6434. [18] H.H. Hammud, A. Ghannoum, M.S. Masoud,
Spectrochim. Acta Part A 63 (2006) 255.
[19] D.H. Lee, K.H. Lee, J.-I. Hong, Org. Lett. 3 (2001) 5. [20] D.H. Lee, H.Y. Lee, K.H. Lee, J.I. Hong, Chem.
Commun. 13 (2001) 1188.
Spectrochim. Acta Part A 83 (2011) 187.
[22] R.M. Silverstein, G.C. Bassler, T.C. Morrill, Spectrometric Identi fication of Organic Compounds, 4th ed. John Wiley & Sons, New York, 1981.
[23] K.A. Conners, Binding Constants, John Wiley & Sons: New York, 1987, pp. 148 and 24.
[24] M. Bonizzoni, L. Fabbrizzi, A. Taglietti, F. Tiengo, Eur. J. Org. Chem. 16 (2006) 3567.
[25] G.S. Kumar, D.C. Neckers. Chem. Rev. 89 (1989) 1915.
[26] S.-Y. Li, C.-J. Chen, P.-Y. Lo, H.-S. Sheu, G.-H. Lee,
C.K. Lai, Tetrahedron 66 (2010) 6101.
[27] A. Anthonysamy, S. Balasubramanian, Inorg. Chem. Commun. 8 (2005) 908.
[28] M.M. Ghoneim, H.S. El-Desoky, S.A. Amer, H.F. Rizk, A.D. Habazy, Dyes Pigm. 77 (2008) 493. [29] J.C. Dabrowiak, D.P. Fisher, F.C. McElroy, D.J.
Macero, Inorg. Chem. 18 (1979) 2304.
[30] S. Brooker, S.S. Iremonger, P.G. Plieger, Polyhedron 22 (2003) 665.