ISSN 2374-2666 (Print) 2374-2658 (Online) Copyright © The Author(s). All Rights Reserved. Published by American Research Institute for Policy Development DOI: 10.15640/jibf.v3n2a1 URL: http://dx.doi.org/10.15640/jibf.v3n2a1
Application of CAMEL model on the GCC Islamic Banks: 2008-2014
Vijaya Kumar
1& Hameedah Sayani
2Abstract
Purpose- The purpose of this paper is to evaluate the soundness of Islamic banks in the GCC for the period
2008 to 2014. Methodology- The study involves 11 listed Islamic banks based in the GCC countries of Saudi Arabia, United Arab Emirates, Qatar, Bahrain, and Kuwait. The study applied the CAMEL parameters, which include capital adequacy, asset quality, management capability, earning ability, and liquidity ratio. Multivariate Z- score model is also used to ensure robustness of the results. Findings-The findings suggest that although the Islamic banks in the GCC have adequate capital, their asset quality and earning ability have deteriorated over the period of study. However, the impact was not so significant that these banks will be pushed to the brink of bankruptcy. Practical implications- The information is of interest to stakeholders, who is concerned about the soundness of the banking sector in general, as any negative impact on the financial sector may have enormous implications for the country, which was indeed evident in the recent financial crisis. Insight into these elements provides a focus for management of the bank, by identifying areas that need attention.
Keywords: Capital adequacy, Asset quality, Management capability, Earning ability, Liquidity ratio, Z-score,
Islamic banks.
1. Introduction
The global economic and financial crisis has affected the banking industry in general and the analysts are of the opinion that the crisis has not calmed down yet. Although the crisis impacted most banks around the world, the Islamic banks seem to be resilient to the financial crisis, as very few Islamic banks declared bankruptcy during these times of turmoil. Kaleem (2000) suggests that the impact of the Asian financial crisis on Islamic banks was insignificant due its assets-linked nature. Ahmed (2009) asserts that the financial crisis could have been avoided if the principles of Islamic finance were followed by the commercial banks too. Alam, et al. (2011) argues that Islamic banking also provides a sustainable financial alternative to the world economic system.
The globalization effect has put Islamic banks in tough competition with the commercial banks in the global arena. The Islamic banking industry is merely four decades old, but even in this short period it has experienced unprecedented growth. According to Banker (2011) the global Islamic banking assets have grown from $145bn in 2002 to $1,033bn in 2010 (Banker, 2011), with an expected compound annual growth rate (CAGR) of 15% to 20% until 2015. Despite the rapid growth of the Islamic finance industry, the Islamic banking assets represent only 1.5% of total global banking assets (Banker, 2011).
Like in any other country, a sound and robust banking sector is important for the GCC economies. In recent times, all the GCC countries have encouraged the development of Islamic banks leading to the existence of dual banking systems. Besides full-fledged Islamic banks, many conventional banks offer Islamic products through Islamic banking windows, hence making the GCC banking sector even more competitive.
The importance of the GCC countries cannot be undermined for various reasons. All of the GCC countries are oil producing countries with Saudi Arabia being the largest global oil supplier in the world (US Energy Information Administration, 2012). Hamilton (2003) found that the post Second World War, oil price shocks or political instability in the MENA region contributed to most recessions in the world; hence it is clear that the GCC countries can affect the macroeconomic fundamentals of other countries. Additionally, with the help of investor friendly policies, the GCC countries have attracted huge foreign investments in recent years (Groh and Wich, 2012). Turmoil in the GCC markets and institutions can cause exaggerated volatilities in the world markets as it was witnessed in 2009, when the Dubai government indicated its inability to pay its debt and asked for a restructuring of debt (Watson, 2010). Similarly, foreign shocks can have a significant effect on the GCC economies (Hamoudeh and Choi, 2006). With the huge impact of the current financial crisis in the global banking industry and supposed resilience of Islamic banks to these shocks, there has been a sudden increase in interest in evaluating the financial performance of the Islamic banks during and post crisis (Hidayat and Abduh, 2012).
Traditional approach of financial performance analysis includes financial ratios (Eljelly and Elobeed, 2013) and the modern approach, includes the CAMEL rating system (Alani, Yacoob, Hamdan, 2013). These measures help to evaluate the financial soundness and safety of entities within a particular industry. Olson and Zoubi, (2008) classify the financial ratios into five groups, i.e. profitability, efficiency, asset quality, liquidity and risk and find that these ratios provide valuable insight into the financial health of an organization. On the other hand, the CAMEL ratings system examines capital adequacy, asset quality, management, earnings, and liquidity and is widely used by supervisory bodies around the world to rate financial soundness of banking institutions. The CAMEL ratings allow identification of banks that may need additional capital or alternative arrangements to continue their operations. Besides regulatory bodies, many researchers have also opted to use the CAMEL ratings to evaluate and rank the performance of banks; both conventional and Islamic (for example Khouaja and Lotfi Boumediene, 2014; Jaffar and Manarvi, 2011; AlGindi et al. 2009).
The purpose of this study is to evaluate the financial safety and soundness of the GCC Islamic banks during and post the recent financial crisis i.e. 2008-2014 and accordingly the study adopts a multifaceted approach to analyze the soundness of Islamic banks in the GCC in turbulent times. This study measures the overall soundness and safety of selected Islamic banks in the GCC. Identification of weak parameters through CAMEL model may help to mitigate potential losses that may lead to bank failures. The CAMEL parameters include capital adequacy, asset quality, management capability, earnings ability and liquidity ratio. To ensure robustness of the results, Emerging markets (EM) Z-score is also calculated to evaluate, whether the chosen banks are under financial distress during the period under consideration.
The study is organized as follows: section 2 provides a brief but comprehensive literature review of studies using CAMEL parameters and the Z-Score: section 3 provides details of the methods adopted; section 4 presents the discussion on the results and section 5 provides the conclusion, the possible avenues for the future research and the practical application of the study.
2. Literature Review
Gasbarro et al. (2002) argues that analyzing soundness of banks during the financial crisis is a challenging task as most indicators of financial health deteriorate in turbulent times. Increased bank failures during 2008 and 2010 imply that financial crises may induce unprecedented changes to financial health of banks, which is not only detrimental to the investors but also affects the economy in general (Kerstein and Kozberg, 2013; Ng and Roychowdhury, 2013).
Kerstein and Kozberg (2013) suggest that the components of the CAMEL model individually and collectively hold the capability of predicting bank failure in the US especially surrounding the recent financial crisis. Hanc (1998) evaluate the importance of various factors in the CAMEL model that cause financial distress to banks and find that internal factors determine the financial health of banks. On the other hand Gasbarro et al. (2002) identified that the importance of various components of the CAMEL model varies with changing economic times and that the coefficients associated with the components of the CAMEL model during tranquil times are different from those during turbulent times. Rahman et al. (2004) conducted a study comprising banks in Indonesia, South Korea and Thailand for the period 1995 to 1997. The authors used logistic analysis and found that capital adequacy, loan management, and operating efficiency are the most reliable predictors of financial distress in these countries. Peek et al. (2003) study the relationship between the worst CAMEL rating and banks’ lending behavior and find that the worst ratings dramatically affect banks’ lending practices. Derviz and Podpiera (2008) evaluate the association between S&P ratings and CAMEL ratings for three largest banks in the Czech Republic. The authors find that while capital adequacy, value at risk, and leverage are the best predictors under the CAMEL ratings, funding spread, capital adequacy, and the ratio of total loans to total assets are the most relevant rating predictors in S&P ratings. The study conducted by DeYoung (1998) reveals that the management capability is directly linked to the earning ability and asset quality of the bank. The findings of the study pointed out that management capability increases with an increase in earning ability and asset quality, and vice versa.
Application of the CAMEL parameters in literature has been quite diverse. Cole and Gunther (1998) use the CAMEL model to compare the effectiveness of on-site and off-site monitoring in predicting bank failures. Berger et al. (2001) use the CAMEL ratings to evaluate the level of bank supervision during the crisis period of 1989 and 1992, and post crisis during 1993 and 1998. The authors also examine if the changes in the intensity of bank supervision affected the lending practices of banks. The results suggested that bank supervision was tougher during the crisis; however, the impact of intense supervision of banks’ lending behavior was marginal. Bongini et al. (2002) evaluate the performance of various indicators in predicting bank failure in East Asia during 1996-1998 considering accounting data, stock prices, and credit ratings. The authors find that the performance of these indicators varied significantly under different circumstances. The results implied that while share prices responded quickly to the newly available information as compared to the ratings, their performance cannot be considered superior to accounting data or judgment based indicators; hence, the authors recommended use of multiple indicators to evaluate fragility of banks especially during crisis.
Khouaja and Lotfi Boumediene (2014) use CAMEL parameters to determine the financial health of 150 commercial banks across six European countries during 2003 and 2008. The authors argue that the incentives associated with increased profitability of banks are far greater than those associated with risk management and policies that aim to make banks stable. The banks opt to increase profitability and compromise on risk mitigating practices, enhancing banks’ vulnerability. The authors suggest that a balance need to be created between two rather diverse objectives.
Another common method of measuring financial stability of entities is the application of Z-Score. The original Z-score model was devised by Altman (1968) and was primarily applicable on manufacturing forms in the US. Many variations of Z-score are presented in literature thereafter. The Z-score model is capable of predicting bankruptcy with 95% accuracy for estimations and 84% for holdout samples (Grice and Ingram, 2001). Researchers have used the model extensively to evaluate financial stability in a variety of industries (e.g., Chen and Wei, 1993; Carcello et al., 1995; Chen and Church, 1996; Subramanyan and Wild, 1996). Wang and Cambell (2010) compared the performance of multiple Z-score variations, using a sample of 1,336 Chinese listed companies over 11 years (1998 - 2008). They found that while some variations of Z-score models perform better than the others, the original Altman Z-score exhibited the highest accuracy in identifying the firms under distress. Al Zaabi (2011) analyzed the financial stability of four Islamic banks in the UAE using emerging market Z-score for the period 2004 - 2007. The results verified that though the Z-scores of some banks are weakening, they are above the benchmark scores, suggesting financial stability of Islamic banks in the UAE.
More recently, Maghyereha and Awartani (2014) found that typical CAMEL indicators are the best predictors of bank fragility in the GCC banking industry, during 2000 and 2009, using the data for 70 banks. This empirical study emphasizes that bank soundness in the GCC can be predicted with the help of the CAMEL parameters. Authors like Ali (2011) suggest that the Islamic banks demonstrated resilience to the ongoing financial crisis the MENA region. However, Kassim and Majid (2010) found that both conventional and Islamic banks in Malaysia suffered during the Asian financial crisis of 1990s and the financial crisis of 2008, suggesting that the interest-free nature of Islamic finance does not provide a buffer to the Islamic banks.
There is a lack of studies primarily based in the GCC, which indicates that there is a need to evaluate the soundness of Islamic banks in the GCC It is against this backdrop that this research has been undertaken to fill up this gap and subsequently uses the most recent data for this purpose.
3. Methods
The study involves 11 listed Islamic banks based in the GCC countries of Saudi Arabia, United Arab Emirates, Qatar, Bahrain, and Kuwait. The banks included in the sample are presented in Table 1. The table also presents total equity and the total asset value of the banks included in the study in US$ as of 2014. The study was restrained by limited availability of data, as some Islamic banks in the GCC are not publicly listed and data for some listed Islamic banks are unavailable for the complete period of analysis. For example, Islamic banks in Oman are excluded from the sample due to lack of data, as two listed Islamic banks in Oman have recently come into operation, The banks included in the sample were selected on the basis of the availability of financial statements that were extracted from the websites of the banks. There is a currency difference in the financial statements used, as the banks originate from different countries. However, the use of ratio analysis circumvents problems arising from currency differences.
Table 1: Banks included in the study
In USD Millions GCC Countries Banks Total Assets Total Equity
Saudi Arabia
Arab National Bank 164.67 20.64
Bank al Bilad 45.23 5.89
Bank al Jazira 59.98 5.73
United Arab Emirates
Dubai Islamic bank 123.88 17.71
Abu Dhabi Islamic Bank 103.16 13.07
Sharjah Islamic Bank 26.01 4.59
Qatar Qatar Islamic Bank 96.11 14.17
International Islamic bank 38.40 5.36
Bahrain Ithmar 2.70 0.20
Bahrain Islamic bank 0.88 0.08
Kuwait Boubyan 2.65 0.30
The period of analysis extends from 2008 to 2014 and uses seven year data for each bank included in the sample with a few exceptions as some banks in the sample have not yet published their annual financial statement for 2014. It is evident that the period of analysis includes the crisis and post crisis period that engulfed the global banking sector in the recent years. Data analysis in this study comprises of several steps. First, all the ratios under the CAMEL parameters and the emerging markets Z-core (Altman, 2002) are calculated, followed by calculation of average and standard deviation for each ratio as well as the Z-score. Descriptive statistics are presented in two ways: on an annual basis for all the Islamic banks in the GCC and for individual banks over the period of five years. Second, single factor ANOVA is used to identify if there are statistically significant variations within the industry during the period of analysis. Simltaneous use of the CAMEL indicators and the emerging markets Z-Score will ensure robustness of the results.
The following subsections provide the details on the ratios and models included in the data analysis.
3.1 CAMEL Model
Following ratios are calculated as a part of the CAMEL parameters.
Capital adequacy: shareholders' equity/ total assets. This ratio examines the safety and the financial stability of
the banks. The higher the capital adequacy, the lesser will be the bankruptcy risks.
Asset quality: The asset quality of a bank is based upon the financial ratio of non-performing loans (NPL) and total loans. The higher ratio indicates a higher risk of loans becoming non-performing. The lower the ratio, less capital is required by the bank to support its loan portfolio
Management capability: salaries and benefits to average assets. This ratio affects the profitability of the bank
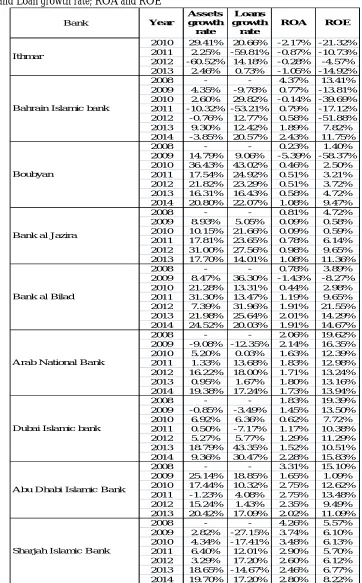
indicating the capability of the management. Another way to measure the management capability is by assessing the growth rate of total assets or total loans; more assets or loans indicate the capability of the management. Although these measures are not used in this study, they have been reported in Table D.
Earnings ability: net interest income to average assets, parameter for measuring financial performance, which
indicates the earning ability of a bank. Return on assets (ROA) and return on equity (ROE) also measures the earning ability of the bank. The higher the ratio, the higher is the earning capability of the bank. Alternative measures of earnings ability are not included in the study; however, they have been included in Table D.
Liquidity: total customer deposit/total assets. It measures the liquidity of the bank, which helps to reduce the
chances of the failure of the bank. If the bank does not have enough liquidity, then it may not be in a position to pay its depositors as well as its day to day payments.
3.2 Z-Score Model
Given the peculiar nature of emerging markets and the entities operating within these markets Altman (2002) devised a score model particularly for firms operating in the emerging economies. The Emerging Markets (EM) Z-score model is presented as:
Z-score = 3.25 + 6.56 (X1) + 3.26 (X2) + + 6.72 (X3) + + 1.05 (X4)
Where
X1 = Working capital to total assets, a measure of liquidity of a firm. X2 = Retained earnings to the total assets, a measure of profitability.
X3 = Earnings before interest and taxes (EBIT) to total assets, measures efficiency.
X4 = Market value of equity or firm’s net worth, examines stockholders’ equity to total liabilities.
4. Discussion
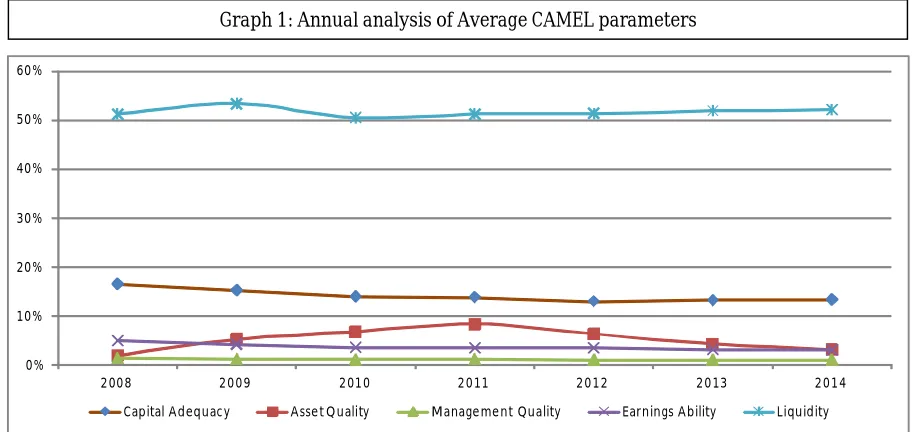
As per the American International Assurance (AIA), the Capital Adequacy Ratio (CAR) should vary between 4% and 6% (Dang, 2011). On the other hand, Bank for International Settlement (BIS) suggests a minimum requirement of 8% for CAR (Dang, 2011). Higher CAR signifies the strength of the bank and its ability to withstand changes in the financial environment (Sangmi and Nazir, 2010). Measuring against both criteria, in the five year period of study, i.e. 2008-2014, the average CAR (graph 1) is declining from 16.45% to 13.33%, however, it is much above the AIA’s norm of 4-6%. It also meets the minimum requirement of 8% as per the Bank for International settlement (BIS). The standard deviation (Table 2) of industry wide CAR varies between 6.02% and 2.53% exhibiting greater deviation from the average in all five years of analysis.
0% 10% 20% 30% 40% 50% 60%
2008 2009 2010 2011 2012 2013 2014
Capital Adequac y Asse t Q uality Manage me nt Quality Earnings Ability Liquidity
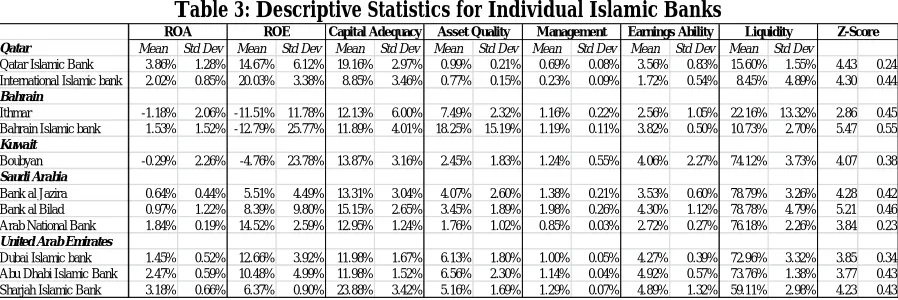
The average CAR for individual banks (Table 3)) varies between 8.85% (International Islamic Bank, Qatar) and 23.88% (Sharjah Islamic bank, UAE). The highest standard deviation is reported by Ithmar bank (6%), whereby the bank-wise standard deviation has varied between 1.52% and 6.0% in the five years of analysis. All the banks in the study have exhibited high levels of CAR in all five years of analysis. CAR may have a bearing on the decisions made by the bank like landing in high risk, but profitable areas, diversification through branches or subsidiaries etc. (Shankar 1997). However, a very high ratio may also indicate bank’s inefficiency to utilize its capital to the fullest potential.
Table 2: Descriptive Statistics for the GCC Islamic Banking Industry
Mean Std Dev Mean Std Dev Mean Std Dev Mean Std Dev Mean Std Dev Mean Std Dev Mean Std Dev
Capital Adequacy 16.45% 6.02% 15.23% 5.86% 13.99% 5.28% 13.82% 5.42% 12.96% 5.05% 13.19% 3.92% 13.33% 2.53% Asset Quality 1.89% 1.13% 5.20% 3.36% 6.64% 6.02% 8.26% 12.85% 6.27% 7.67% 4.22% 3.59% 3.04% 2.91% Management Quality 1.34% 0.63% 1.12% 0.54% 1.06% 0.46% 1.08% 0.42% 1.02% 0.42% 1.02% 0.39% 1.01% 0.44% Earnings Ability 4.89% 1.88% 4.13% 1.16% 3.58% 1.34% 3.40% 1.30% 3.40% 1.24% 3.08% 0.69% 3.01% 0.49% Liquidity 51.21% 29.20% 53.31% 29.69% 50.49% 32.53% 51.18% 32.76% 51.30% 31.55% 51.86% 30.11% 52.10% 30.98% Z-Score 4.11 0.82 4.01 0.82 4.21 0.99 4.38 0.90 4.23 0.66 4.23 0.69 4.35 0.51
2014
2008 2009 2010 2011 2012 2013
Table 3: Descriptive Statistics for Individual Islamic Banks
Qatar Mean Std Dev Mean Std Dev Mean Std Dev Mean Std Dev Mean Std Dev Mean Std Dev Mean Std Dev
Qatar Islamic Bank 3.86% 1.28% 14.67% 6.12% 19.16% 2.97% 0.99% 0.21% 0.69% 0.08% 3.56% 0.83% 15.60% 1.55% 4.43 0.24
International Islamic bank 2.02% 0.85% 20.03% 3.38% 8.85% 3.46% 0.77% 0.15% 0.23% 0.09% 1.72% 0.54% 8.45% 4.89% 4.30 0.44
Bahrain
Ithmar -1.18% 2.06% -11.51% 11.78% 12.13% 6.00% 7.49% 2.32% 1.16% 0.22% 2.56% 1.05% 22.16% 13.32% 2.86 0.45
Bahrain Islamic bank 1.53% 1.52% -12.79% 25.77% 11.89% 4.01% 18.25% 15.19% 1.19% 0.11% 3.82% 0.50% 10.73% 2.70% 5.47 0.55
Kuwait
Boubyan -0.29% 2.26% -4.76% 23.78% 13.87% 3.16% 2.45% 1.83% 1.24% 0.55% 4.06% 2.27% 74.12% 3.73% 4.07 0.38
Saudi Arabia
Bank al Jazira 0.64% 0.44% 5.51% 4.49% 13.31% 3.04% 4.07% 2.60% 1.38% 0.21% 3.53% 0.60% 78.79% 3.26% 4.28 0.42
Bank al Bilad 0.97% 1.22% 8.39% 9.80% 15.15% 2.65% 3.45% 1.89% 1.98% 0.26% 4.30% 1.12% 78.78% 4.79% 5.21 0.46
Arab National Bank 1.84% 0.19% 14.52% 2.59% 12.95% 1.24% 1.76% 1.02% 0.85% 0.03% 2.72% 0.27% 76.18% 2.26% 3.84 0.23
United Arab Emirates
Dubai Islamic bank 1.45% 0.52% 12.66% 3.92% 11.98% 1.67% 6.13% 1.80% 1.00% 0.05% 4.27% 0.39% 72.96% 3.32% 3.85 0.34
Abu Dhabi Islamic Bank 2.47% 0.59% 10.48% 4.99% 11.98% 1.52% 6.56% 2.30% 1.14% 0.04% 4.92% 0.57% 73.76% 1.38% 3.77 0.43
Sharjah Islamic Bank 3.18% 0.66% 6.37% 0.90% 23.88% 3.42% 5.16% 1.69% 1.29% 0.07% 4.89% 1.32% 59.11% 2.98% 4.23 0.43
Z-Score Earnings Ability Liquidity
ROA ROE Capital Adequacy Asset Quality Management
High asset quality ratio is indicative of lower asset quality. As per AIA’s criteria, the asset quality ratio should be less than or equal to 1%, and a ratio above 1% suggests an increase in non-performing loans (NPL) (Dang, 2011). Measuring against this criteria, the average asset quality (graph1) for 2008-2014 shows a steep increase from 2008 (1.89%) to 2011 (8.26%), marginal decline in 2012 (6.27%) to 2014 (3.04%). The increase in asset quality over the period mentioned can be related to the recent financial turmoil, and the decrease in the asset quality ratio from 2012 to 2014 suggests a positive outlook indicating the recovery of banks from the financial crisis. However, the entire annual ratios are very high, indicating higher NPLs in the period of study. Moreover, the standard deviation (Table 2) over the period of study varies from 1.13% to 12.85% indicating a greater deviation from its mean.
The bank-wise average asset quality ratio (Table 3))is highest for Bahrain Islamic bank (18.25%) and lowest for the International Islamic bank (0.77%), which are higher than the AIA’s rate of 1%, except for International Islamic bank, indicating higher risks of bad loans and the requirement of more capital to survive default loans for all Islamic banks considered in the study.
The management quality plays a substantial role in the success of the banks (Grier, 2007). AIA’s approach to bank analysis emphasizes that good management quality leads to better reputation of the company. An important factor affecting the profitability is the ratio of salaries and benefits to average assets, which indicates the management capabilities and the ratio is approximately 1.5% of high efficiency banks (Hays, Lurgio, and Gilbert Jr., 2009). The average management capability ratio (graph 1) over the years 2008-2014 is decreasing from 1.34% to 1,01%, which is less than 1.5% and not in line with Hays, Lurgio, and Gilbert Jr. (2009) study. Management quality remained almost same in all the five years of analysis with low standard deviation ranging from 0.39% to 0.63% (Table 2).
The bank-wise management, quality ratio (Table 3)) is highest for Bank Al Bilad (1.98%) and lowest for the International Islamic bank, Qatar (0.23%). The bank-wise standard deviation is low, ranging from 0.08 to 0.26 indicating insignificant deviation from its mean. However, Sarker (2006) has pointed out that it is difficult to draw any conclusion on management capabilities based on monetary indicators as management capabilities are qualitative and subjective.
The average NIM bank-wise (Table 3))shows that International Islamic bank (1.72%), Ithmar (2.56%) and Arab National bank (2.72%) have a low earning ability, whereas all the banks in the UAE have very strong earning ability that varies from 3.56% to 4.92%. The standard deviation of the earnings ability ratio varies from 0.27% to 2.27% that suggests that over the period of five years the earnings ability of the banks have deviated from the mean indicating different earning ability of the banks considered in the study.
Liquidity measures the ability of a bank to transfer the financial assets, such as investment securities at a short notice to the owners (Sangmi and Nazir, 2010). The liquidity ratio depends on the customer deposits to total assets, which should be greater than or equal to 75% as per the AIA standards. The average annual liquid ratios (graph 1) ranged between 50.49% to 52.10% in the period of study from 2008 to 2014. This exhibit that although average liquidity is improving marginally, it has not yet reached the AIA standards of 75%. The annual standard deviation (Table 2) ranges between 29.20% and 32.76% during the period of analysis, which suggests wider dispersion in liquidity in the industry.
The liquidity position (Table 3) shows that Qatar Islamic bank (15.60%), International Islamic bank (8.45%), Ithmar bank (22.16%), Bahrain Islamic bank (10.73%) has a very low liquidity ratio. The majority of the banks considered in the study that are located in Kuwait, UAE and Saudi Arabia have greater than 75% liquidity ratio, suggesting that these banks will not be adversely affected in the short run by the lack of liquidity. The standard deviation for the banks varies from 1.38% to 13.32%, suggesting that the liquidity of all the banks are not the same. The need to maintain high liquidity in Islamic banks can be attributed to the nature of the transactions that the Islamic banks enter. The transactions are based on profit and loss sharing basis and unlike conventional banks, Islamic banks share the risk of failure equally with the borrower. Moreover, since the transactions are associated with real economic activity, the cash flows are expected to be generated in the long run (Errico and Farahbaksh, 1999; Izhar, 2010). Hence the Islamic banks should maintain high liquidity levels to provide a buffer against adverse situations. High liquidity in Islamic banks (considered in the study) of the UAE, Kuwait and Saudi Arabia can also be attributed to the unavailability of Shariah compliant investment opportunities (Ali, 2011).
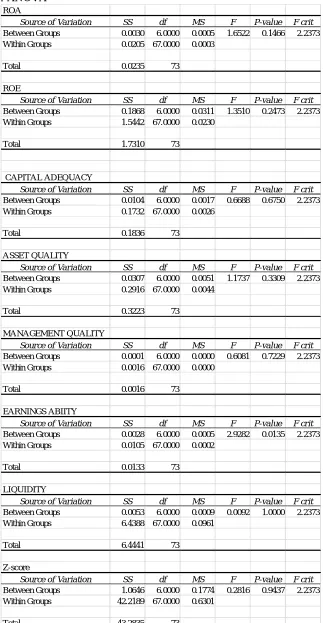
ANOVA (Table A in the appendix) suggests that there are insignificant variations between the overall annual performances of GCC Islamic banks with respect to capital adequacy, asset quality, management capability, and liquidity ratios. However, earning ability is statistically significant at 5% whereby the p-values are close to 0. This suggests that the earning ability fluctuated over the period of analysis.
To confirm the results of the CAMEL model, further analysis is performed using the EM Z-Score. Firms are considered to be in the safe zone if the EM Z-score if greater than 2.6 (Altman 2002). The average EM Z-Score of the all the 11 Islamic banks (graph 2) in the five year period of analysis is greater than 2.6, indicating that the performance of all the Islamic banks in the sample is satisfactory and they will not face bankruptcy in the near future. Bahrain Islamic bank (5.47) has the highest EM Z-score and Ithmar (2.86) has the lowest EM Z-score. However, none of the banks seem to be in financial distress.
5. Conclusion
The empirical analysis carried out with the help of the CAMEL parameters clearly indicates that the Islamic banks in the GCC were able to shield themselves from the recent global financial crisis. Chazi and Syed, (2010) attribute this resilience to inherent factors within Islamic banking such as prohibition of interest (riba) and prohibition of excessive uncertainty transactions (Gharar). The annual CAR is very strong in the period of study, which indicates the internal strength of the banks and a platform to increase their credit undertakings and lower its unexpected risks. The asset quality ratio of the selected GCC Islamic banks is much higher than the criteria laid by the AIA’s CAMEL approach, indicating a risky portfolio after crisis, although some improvement in the ratio is witnessed from 2012 onwards. Risk sharing attributes of Islamic finance contributes to this element and the Islamic banks may end up carrying greater risk with respect to the quality of the assets and cash flows associated with long-term investments in assets (Errico and Farahbaksh, 1999; Izhar, 2010). The overall earnings ability worsened during the period of analysis. Since the period of analysis entails crisis, it is appropriate to link the performance of banks and industry to the financial crisis. It appears that some Islamic banks suffered more than others during the time of turmoil. The management capability ratio indicates a marginal decrease over the years, which can also be linked to the earning ability for the Islamic banks. The liquidity ratio for all the Islamic banks have more or less remained the same, indicating the banks’ ability to sustain adverse situations. However, high standard deviation clearly indicates wider dispersion in the liquidity ratios across GCC Islamic banks. ANOVA suggests that the differences in the earning ability were found to be statistically significant during the period of analysis. Other performance indicators of the CAMEL model were found to be statistically insignificant. To substantiate the results, it was found that all the GCC Islamic banks have a Z-score higher than 2.6, exhibiting their resilience to the global crisis.
The findings of the study have implications for the investors to facilitate their decision-making. In addition, it is of importance to existing shareholders who delegate the stewardship responsibility to the management of the company. Insight into these elements provides a focus for management of the bank, by identifying areas that need attention. Moreover, the information is of interest to other stakeholders who are concerned about the soundness of the banking sector in general, as any negative impact on the financial sector may have enormous implications for the country, which was indeed evident in the recent financial crisis.
Appendix
Table A: Single Factor ANOVA
ROA
Source of Variation SS df MS F P-value F crit
Between Groups 0.0030 6.0000 0.0005 1.6522 0.1466 2.2373 Within Groups 0.0205 67.0000 0.0003
Total 0.0235 73
ROE
Source of Variation SS df MS F P-value F crit
Between Groups 0.1868 6.0000 0.0311 1.3510 0.2473 2.2373 Within Groups 1.5442 67.0000 0.0230
Total 1.7310 73
CAPITAL ADEQUACY
Source of Variation SS df MS F P-value F crit
Between Groups 0.0104 6.0000 0.0017 0.6688 0.6750 2.2373 Within Groups 0.1732 67.0000 0.0026
Total 0.1836 73
ASSET QUALITY
Source of Variation SS df MS F P-value F crit
Between Groups 0.0307 6.0000 0.0051 1.1737 0.3309 2.2373 Within Groups 0.2916 67.0000 0.0044
Total 0.3223 73
MANAGEMENT QUALITY
Source of Variation SS df MS F P-value F crit
Between Groups 0.0001 6.0000 0.0000 0.6081 0.7229 2.2373 Within Groups 0.0016 67.0000 0.0000
Total 0.0016 73
EARNINGS ABIITY
Source of Variation SS df MS F P-value F crit
Between Groups 0.0028 6.0000 0.0005 2.9282 0.0135 2.2373 Within Groups 0.0105 67.0000 0.0002
Total 0.0133 73
LIQUIDITY
Source of Variation SS df MS F P-value F crit
Between Groups 0.0053 6.0000 0.0009 0.0092 1.0000 2.2373 Within Groups 6.4388 67.0000 0.0961
Total 6.4441 73
Z-score
Source of Variation SS df MS F P-value F crit
Between Groups 1.0646 6.0000 0.1774 0.2816 0.9437 2.2373 Within Groups 42.2189 67.0000 0.6301
Table B: Asset and Loan growth rate; ROA and ROE
Bank Ye ar
As s e ts growth rate Loans growth rate ROA ROE
2010 29.41% 20.66% -2.17% -21.32% 2011 2.25% -59.81% -0.87% -10.73% 2012 -60.52% 14.18% -0.28% -4.57% 2013 2.46% 0.73% -1.05% -14.92%
2008 - - 4.37% 13.41%
2009 4.35% -9.78% 0.77% -13.81% 2010 2.60% 29.82% -0.14% -39.69% 2011 -10.32% -53.21% 0.79% -17.12% 2012 -0.76% 12.77% 0.58% -51.88% 2013 9.30% 12.42% 1.89% 7.82% 2014 -3.85% 20.57% 2.43% 11.75%
2008 - - 0.23% 1.40%
2009 14.79% 9.06% -5.39% -58.37% 2010 36.43% 43.02% 0.46% 2.50% 2011 17.54% 24.92% 0.51% 3.21% 2012 21.82% 23.29% 0.51% 3.72% 2013 16.31% 16.43% 0.58% 4.72% 2014 20.80% 22.07% 1.08% 9.47%
2008 - - 0.81% 4.72%
2009 8.93% 5.05% 0.09% 0.58% 2010 10.15% 21.66% 0.09% 0.59% 2011 17.81% 23.65% 0.78% 6.14% 2012 31.00% 27.56% 0.98% 9.65% 2013 17.70% 14.01% 1.08% 11.36%
2008 - - 0.78% 3.89%
2009 8.47% 36.30% -1.43% -8.27% 2010 21.28% 13.31% 0.44% 2.98% 2011 31.30% 13.47% 1.19% 9.65% 2012 7.39% 31.96% 1.91% 21.55% 2013 21.98% 25.64% 2.01% 14.29% 2014 24.52% 20.03% 1.91% 14.67%
2008 - - 2.06% 19.62%
2009 -9.08% -12.35% 2.14% 16.35% 2010 5.20% 0.03% 1.63% 12.39% 2011 1.33% 13.68% 1.83% 12.98% 2012 16.22% 18.00% 1.71% 13.24% 2013 0.95% 1.67% 1.80% 13.16% 2014 19.38% 17.24% 1.73% 13.94%
2008 - - 1.83% 19.39%
2009 -0.85% -3.49% 1.45% 13.50% 2010 6.92% 6.36% 0.62% 7.72% 2011 0.50% -7.17% 1.17% 10.38% 2012 5.27% 5.77% 1.29% 11.29% 2013 18.79% 43.35% 1.52% 10.51% 2014 9.36% 30.47% 2.28% 15.83%
2008 - - 3.31% 15.10%
2009 25.14% 18.85% 1.65% 1.09% 2010 17.44% 10.32% 2.75% 12.62% 2011 -1.23% 4.08% 2.75% 13.48% 2012 15.24% 1.43% 2.35% 9.49% 2013 20.42% 17.09% 2.02% 11.09%
2008 - - 4.26% 5.57%
2009 2.82% -27.15% 3.74% 6.10% 2010 4.34% -17.41% 3.48% 6.13% 2011 6.40% 12.01% 2.90% 5.70% 2012 3.29% 17.20% 2.60% 6.12% 2013 18.65% -14.67% 2.46% 6.77% 2014 19.70% 17.20% 2.80% 8.22% Abu Dhabi Islamic Bank
Sharjah Islamic Bank Ithmar
Bahrain Islamic bank
Boubyan
Bank al Jazira
Bank al Bilad
Arab National Bank
References
Ahmad, H. (2009). Financial Crisis: Risks and Lessons for Islamic Finance. Available on http://www.kantakji.com/fiqh/Files/Markets/c47.pdf (Accessed on 10 July 2013).
Alam, H. M., Noreen, H., Karamat, M., & Ilyas, M. (2011). Islamic Banking: Insulation against US Credit Crisis. International Journal of Business and Social Science, 2, 193-201.
Alani, F., Yacoob, H., & Hamdan, M. (2013). The Comparison of Financial Analysis tools in Conventional and Islamic Banking: Evidence from Kuwait. International Journal of Business and Management, 8, 85-103. AlGindi, T., Said, M., & Salevukaris, J. W. (2009). Islamic Alternatives to Purely Capitalist Modes of Finance: A study
of Malysian Banks from 1999 to 2006. Review of Radical Political Economics, 41, 516 - 538. Ali, S. S. (2011). Islamic Banking in the MENA Region. The World Bank.
Al-Kassim, F. A. (2005). The profitability of Islamic and conventional banking in the GCCcountries: a comparative study. Journal of Review of Islamic Economics, 13, 5030.
Altman, E. I. (2002). Corporate Distress Prediction Models in a Turbulent Economic and Basel II Environment Credit Rating: Methodologies, Rationale, and Default Risk. London, UK: London Risk Books.
Al-Zaabi, O. S. H. (2011). Potential for the application of emerging market Z-score in UAE Islamic banks. International Journal of Islamic and Middle Eastern Finance and Management, 4, 158 - 173.
Banker. (2011). Islamic finance's growth story is only just beginning [Online]. Available: http://www.thebanker.com/Markets/Islamic-Finance/Islamic-finance-s-growth-story-is-only-just-beginning. (Accessed 15 July 2013).
Berger, A. N., Kyle, M. K., & Scalise, J. M. (2001). Did U.S. bank supervision get tougher during the credit crunch? Did they get easier during the banking boom? Did it matter to bank lending? In M. Frederic (Ed.), Prudential supervision: What works and what doesn’t? Chicago, IL: University of Chicago Press.
Bongini, P., Laeven, L., & Majnoni, G. (2002). How good is the market at assessing bank fragility? A horse race between different indicators. Journal of Banking & Finance, 26, 1011-1028.
Carcello, J. V., Hermanson, D. R., & Huss, H. F. (1995). Temporal changes in bankruptcyrelated reporting. Audit Journal of Practice and Theory, 14, 133 - 143.
Chazi, A., & Syed, L. A. M. (2010). Risk exposure during the global financial: the case of Islamic banks. International Journal of Islamic and Middle Eastern Finance and Management, 3, 321-333.
Chen, C. W., & Wei, K. C. (1993). Creditors’ decisions to waive violations of accountingbased debt covenants. Accounting Review, 68, 218-232.
Chen, K. C., & Church, B. K. (1996). Going concern opinions and the market’s reaction to bankruptcy filings. Accounting Review, 71, 117 - 128.
Cole, R., & White, L. (2012). Déjà Vu All Over Again: The Causes of U.S. Commercial Bank Failures This Time Around. Journal of Financial Services Research, 42, 5-29.
Cole, R. A., & Gunther, J. W. (1995). Separating the likelihood and timing of bank failure. Journal of Bank Finance, 19, 1073 - 1089.
Cole, R. A. (1998). Predicting bank failures: A comparison of on- and and Off-Site Monitoring Systems. Journal of Financial Services Research, 13, 103.
Dang, U. (2011). The CAMEL Rating System in Banking Supervision: A Case Study. Available on: http://scholar.google.ae/scholar?q=The+CAMEL+Rating+System+In+Banking+Supervision+A+Case+St udy&btnG=&hl=en&as_sdt=0%2C5 (Accessed on 10 July 2013).
Derviz, A., & Podpiera, J. (2008). Predicting Bank CAMELS and S&P Ratings. Emerging Markets Finance & Trade, 44, 117-130.
DeYoung, R. (1998). Management quality and x-inefficiency in national banks. Journal of Financial Services Research, 13, 5.
Eljelly, M. A., & Elobeed, A. A. (2013). Performance Indicators of Banks in a Total Islamic Banking System: The Case of Sudan. International journal of Islamic and Middle Eastern Finance and Management, 6, 142-155.
Errico, L., & Farrahbaksh, M. (1999). Islamic Banking. Paper presented at the Second Harvard University Forum on Islamic Finance: Islamic Finance into the 21st century, Cambridge, Massachusetts.
Grice, J. S., & Ingram, R. W. (2001). Tests of the generalizability of Altman’s bankruptcy prediction model. Journal of Business Research, 54, 53 - 61.
Grier, W. A. 2007. Credit Analysis of Financial Institutions. Euro money. 2 ed.: Euro money Institution Investor PLC. Groh, A. P., & Wich, M. (2012). Emerging economies' attraction of foreign direct investment. Emerging Markets
Review, 13, 210-229.
Hamilton, J. D. (2003). What is an oil shock? Journal of Econometrics, 113, 363-398.
Hammoudeh, S. & Choi, K. (2006). Behavior of GCC stock markets and impacts of US oil and financial markets. Research in International Business and Finance, 20, 22-44.
Hanc, G. (1998). The Banking Crises of the 1980s and Early 1990s: Summary and Implications. Banking Review, 11, 1 - 55.
Hays, F. H., De Lurgio, S. A. & Gilbert Jr, A. H. (2009). Effeciency Ratios and Community Bank Performance. Available: http://jupapadoc.startlogic.com/manuscripts/09227.pdf (Accessed on 10 July 2013).
Hidayat, S. E., & Abduh, M. (2012). Does Financial Crisis Give Impacts on Bahrain Islamic Banking Performance? A Panel Regression Analysis. International Journal of Economics and Finance, 4, 79-89.
Izhar, H. (2010). Identifying Operational Risk Exposures in Islamic Banking. Kyoto Bulletin of Islamic Area Studies, 3, 17 - 53.
Jaffar, M., & Manarvi, I. (2011). Performance Comparison of Islamic and Conventional Banks in Pakistan. Global Journal of Management and Business Research, 11, 60-66.
Kaleem, A. (2000). Modelling monetary Stability under Dual Banking System: The case of Malaysia. International Journal of Islamic Services, 2, 21-42.
Kassim, S. H., & Majid, M. S. A. (2010). Impact of Financial Shocks on Islamic banks: Malaysian Evidence During 1997 and 2007 Financial Crises. International Journal of Islamic and Middle Eastern Finance and Management, 3, 291-305.
Kerstein, J., & Kozberg, A. (2013). Using Accounting Proxies of Proprietary FDIC Ratings to Predict Bank Failures and Enforcement Actions During the Recent Financial Crisis. . Journal of Accounting, Auditing & Finance, 28, 128-151.
Khouaja, D., & Lotfi Boumediene, S. (2014). Regulation and Bank Deficiency: Evidence from Europe. International Journal of Business & Finance Research, 8, 23-33.
Maghyereha, A. I., & Awartani, B. (2014). Bank distress prediction: Empirical evidence from the Gulf Cooperation Council countries. Research in International Business and Finance 30, 126 - 147.
Merchant, I. P. (2012). Empirical Study of Islamic Banks Versus Conventional Banks of GCC. Global Journal of Management and Business Research, 12, 32-41.
Ng, J. & Roychowdhury, S. (2013). Loan loss reserves, regulatory capital, and bank failures: Evidence from the 2008–
2009 economic crises, Available:
http://www.lse.ac.uk/accounting/news/MAFG/RoychowdhuryMAFGpaper2011.pdf (Accessed on 10 June 2014).
Olson, D., & Zoubi, T. A. (2008). Using Accounting Ratios to Distinguish between Islamic and Conventional Banks in the GCC region. The International Journal of Accounting, 43, 45-65.
Olson, D., & Zoubi, T. A. (2011). Efficiency and bank profitability in MENA countries. Emerging Markets Review, 12, 94-110.
Peek, J., Rosengren, E., & Tootell, G. M. B. (2003). Identifying the macroeconomic effect of loan supply shocks. Journal of Money, Credit, and Banking, 35, 931-946.
Rahman, S., Tan, L. H., Hew, O. L., & Tan, Y. S. (2004). Identifying financial distress indicators of selected banks in Asia. Asian Economic Journal, 18, 45 - 57.
Sangmi, M., & Nazir, T. (2010). Analyzing financial performance of commercial banks in India: Application of CAMEL model. Pakistan Journal of Commerce and Social Sciences, 4, 40-55.
Sarker, A. A. (2006). CAMELS rating System in the context of Islamic Banking: A propsed 'S' for Shariah framework. Available on http://ibtra.com/pdf/journal/v2_n2_article4.pdf (Accessed on 10 July 2013).
Subramanyan, K. R., & Wild, J. J. (1996). Going-concern status, earnings persistence, and informativeness of earnings. Contemporary Accounting Research, 13, 251– 273.
Thomson, J. B. (1992). Modeling the bank regulator’s closure option: a two-step logit regression approach. Journal of Financial Services Research, 6, 5-23.
Wang, Y., & Campbell, M. (2010). Do bankruptcy models really have predictive ability? Evidence using China publicly listed companies. International Management Review, 6, 77-82.
Wasiuzzaman, S., & Gunasegavan, U. N. (2013). Comparitive study of the performance of Islamic and conventional banks. Humanomics, 29, 43-60.