Research Paper:
Objective Peak-Detection in Complex
Auditory Brainstem Response to /ba/, /da/, /ga/: A Novel
Technique
Negar Amirian1 , Farhad Tabatabai Ghomsheh2 , Mohsen Vahedi3 , Nematollah Rouhbakhsh4 , Amir Salar Jafarpisheh5*
1. Department of Biomedical Engineering, Faculty of Technology and Engineering, Central Tehran Branch, Islamic Azad University, Tehran, Iran. 2. Pediatric Neurorehabilitation Research Center, University of Social Welfare and Rehabilitation Sciences, Tehran, Iran.
3. Department of Biostatistics, University of Social Welfare and Rehabilitation Sciences, Tehran, Iran. 4. Department of Audiology, School of Rehabilitation, Tehran University of Medical Sciences, Tehran, Iran. 5. Department of Ergonomics, University of Social Welfare and Rehabilitation Sciences, Tehran, Iran.
* Corresponding Author: Amir Salar Jafarpisheh, PhD
Address: Department of Ergonomics, University of Social Welfare and Rehabilitation Sciences, Tehran, Iran. Tel: +98 (21) 22180119
E-mail: [email protected]
Objectives: The result of auditory brainstem response is used worldwide for detecting hearing impairments or hearing aids. This study aimed to introduce the superiority of mathematical innovation algorithm toward subjective evaluation by an audiologist. The automatic algorithm method is encouraged for detecting the waves of Auditory Brainstem Response (ABR), because it can reduce subjective evaluation biases and visual analysis errors. This article portrays another technique for automatic detection of the peaks. Finally, by obtaining the standard pattern with this automatic algorithm for Persian speakers, we will compare it with the English speakers whose information was obtained by subjective method in Northwestern University. This article describes the effect of different factors on brainstem responses by performing a new automatic method. Methods: Auditory evoked potentials of brainstem activity were recorded by Electro encephalogram (EEG) of 27 Persian speaker adults with normal hearing. Three stimulus /ga/, / da/, and /ba/ were presented. This strategy depends on the utilization of reference wave forms, time latencies, and peaks adjusted and comparison with the ABR. Brainstem response latencies of brainstem peaks were extracted by the automatic method in temporal and spectral domains. This step provides language patterns for Persian speakers. Finally, the results of Persian speakers were compared with the results of a previous study done in Northwestern University by the same recording protocol as our own study on 22 English speaker children. Intraclass correlation coefficients and paired t test were used for evaluating and comparing the results.
Results: According to the results, the performance of automatic method is high and reliable. Automatic and visual analysis methods had significant interaction. Latency of auditory brainstem response to the same stimulus in the two study groups was different and had a significant latency. The significance of these discoveries and clinical outcomes of this target strategy are featured in this paper.
Discussion: This simple innovative algorithm could find the correct location of ABR peaks. Because of different acoustic signs and symptoms in the brainstem, the time latencies for all three stimulus used in this study are completely different.
A B S T R A C T
Article info: Received: 10 Jan 2018
Accepted:25 May 2018
Available Online: 01 Sep 2018
Keywords:
Auditory evoked potentials, Stimulus-specific adaptation, Linguistic effect, Speech perception, Hearing loss, Auto peak detection
Citation: Amirian N, Tabatabai Ghomsheh F, Vahedi M, Rouhbakhsh N, Jafarpisheh AS. Objective Peak-Detection in Com-plex Auditory Brainstem Response to /ba/, /da/, /ga/: A Novel Technique. Iranian Rehabilitation Journal. 2018; 16(3):219-232. http://dx.doi.org/10.32598/irj.16.3.219
:
: http://dx.doi.org/10.32598/irj.16.3.219
Use your device to scan and read the article online
Highlights
● Automatic central auditory brainstem response (cABR) peak detection is possible.
● Responses to different stimuluses have different time scale patterns.
● There is a significant correlation between automatic and experts peak detection method.
Plain Language Summary
The Auditory Brainstem Response (ABR) is used worldwide for hearing screening purposes. This study is about complex auditory brainstem responses to /da/, /ba/, /ga/. This assessment is normally done manually by an audiolo-gist. The utilization of programmed techniques for peak detection can improve procedure performance. Latency is an important factor for evaluating the activity of neural networks in brainstem for each stimuli. Using automatic peak detection algorithm instead of visual peak marking could reduce errors and increase precision of the analysis. Based on marked peaks with experts, automatic peak detection algorithm was developed and examined.
1. Introduction
he Auditory Brainstem Response (ABR) is the electrical activity of the auditory nerve generated in the brainstem. It is recorded by electrodes of non-invasive tools such as EEG. ABR is associated with similar response to non-verbal and verbal stimuli
[1,2]. The use of verbal stimuli is preferable to other
stimuli as verbal or speech stimuli provide biological processes underpinning normal auditory processing and auditory processing disorders [2].
ABRs are represented in temporal and spectral phases of stimulus by different neural population in different regions of the brainstem. The signals of ABRs are clas-sified in two parts; non-periodic brief stimuli evoked by transient responses and periodic long-term stimuli evoked
by sustained responses [2,3]. More specifically, speech or
the complex Auditory Brainstem Response (cABR) can preserve pitch, formants, and the timing of speech stimuli, crucial in speech understanding both in calm and within the sight of foundation commotion [1-3].
Different factors such as different languages according to each racial, music or speech experience, the period of auditory training (short-term or long-term) and hearing
loss disorders can influence ABRs [2,3]. These factors
shape the morphology of ABR signals and could reflect (induce) the plasticity of the neural networks at the level of brainstem [1]. In addition, differences in age, complex speech stimuli elements and the frequency of stimuli can
evoke different responses [3,4].
Consonant-Vowel (CV) combinations have rich con-sonant structures, dynamic abundance adjustments, and fast spectrotemporal vacillations due to changes in the filter function of the vocal tracts in source-filter model. Different types of CVs influence neural phase locking and cause changes in latency time. Stimuli with high fre-quencies has short latency time and process in cochlea, but stimuli with low frequencies has long latency time
and process in apical of cochlea [2,4,5].
The source of the human voice is the vocal fold vibra-tion. It vibrates at the fundamental voice pitch and the filter is the function of passages above larynx which shapes the voice coming up from the vocal chords. The source-filter model could be represented by a spectro-graph. For example, different synthesized CVs such as /ba/, /da/, and /ga/ create various spectrograms [3]. The duration of CVs vary in phonation length from 40 to 500 ms. The duration of phonation affects pitch and other acoustic features such as harmonics, formants,
and formant transition [1,3,4]. The formant transition
of vowels involve F1, F2, and F3 components and F0 is the fundamental frequency, also the vibration rate of vocal chords could determine the formant transition [1, 3]. The particular segments of the brainstem reaction mirror the acoustic attributes of pitch and formants in-dependently. High frequencies and lower frequencies are responded by basal regions of the cochlea and api-cal regions, respectively [1].
Different methods of processing were used for analysis and extracting the main ABR waveform elements from ABR signals through detecting major and minor peaks and valleys. Generally, ABR signal analysis is performed
in temporal and frequency domains [2,3]. Extracting fea-tures of brainstem response and consonant-vowel stimuli are implemented through the linear and non-linear auto-matic methods. Using autoauto-matic methods could increase the quality of response assessment, peak detection, and improve the quality of the assessment of processing, i.e. automatically stopping averaging sand could ignore re-cording of unnecessary sweeps in ABRs [6-8].
Numerous automatic methods such as zero crossing
method [5, 9], adaptive signal enhancement [5, 10],
multi-filters [5,11], single-trial covariance analysis [5,
12], and automatic peak picking are presented so far
[5, 13, 14]. The most common reported strategies of
automatic ABR analysis is the correlation coefficient
between two consecutive ABR signals [5,15]. A
sub-jective evaluation by audiologists is the most common method of analysis for assessing the ABR response. This evaluation may differ from one audiologist to an-other [9,14, 16,17].
Automatic methods could solve representational bias and increase assessment accuracy. Automatic methods of identification promote objective methods. Although a number of objective methods have been developed in automatic evaluation of ABR, a few have been imple-mented in commercial devices. This article aimed to provide another target strategy for the automatic assess-ment of the nature of ABR signals and evident proof of the peaks in view of the utilization of templates waves. Also this article examines the synthetic use of prepro-cessing methods like Signal-to-Noise Ratio (SNR) of the response, correlation coefficient between grand average signal and each stimuli (/da/,/ba/,/ga/) responses signal, and stimuli signal and each response signal of cABR in Persian speakers by MATLAB software.
By using this innovative method, recording unnecessary sweeps and detecting each unnecessary and non-standard peaks are avoided. Finally, thanks to this method,
lan-guage patterns of Persian speakers could be extracted and compared with the studies on English speakers [2].
2. Methods
This part describes a simple novel objective technique of extracting cABR features such as amplitude, width, latency, as well as automatic detection of peaks.
Participants
A total of 27 adult (13 female and 14 male) students with the Mean±SD age of 24.34±1.95 years (age range: 22-29 years) from Tehran University of Medical Scienc-es participated in this study. All participants were native monolingual speakers of Persian with normal hearing and no neurological disorders. The hearing thresholds of participants were 20 dB HL or higher at octave frequen-cies (250–8000 Hz).
Stimuli and presentation
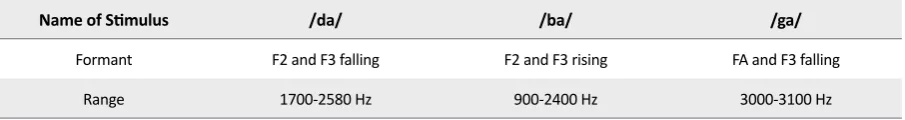
Three diotic synthesized consonant-vowel combina-tions including /da/, /ba/, and /ga/ with 170 ms duration at the rate of 20 kHz were presented to each person. Stimuli were obtained from the study of Kraus and et al. [2]. For-mant transition with duration of 50 ms and linearly rising included formant number 1 (400–720 Hz), flat formant number 4 (3300 Hz), formant number 5 (3750 Hz), and formant number 6 (4900 Hz) (Figure 1). Initial frication were centered at frequencies around formant number 4 (F4) and formant number 5 (F5) in 10 ms.
After 50 ms of formant transition period, formant num-ber 2 (F2) and formant numnum-ber 3 (F3) remained consis-tent at their progression endpoint in 1240 Hz and 2500
Hz, respectively [2,18]. The starting point of F2 and F3
were the portions of different stimuli. For [ba], F2 and F3 rose from 900 Hz and 2400 Hz, respectively. For [da], F2 and F3 tumbled down from 1700 and 2580 Hz, individu-ally. For [ga], F2 and F3 reduced from 3000 and 3100
Figure 1. left: /ga/ Schematic, center: /da/ Schematic, right: /ba/ Schematic stimuli in ms [2]
Time (ms)
[ga] [da] [ba]
3500
1500
0
F3
F2
F1
0 80 160 0 80 160 0 80 160
Fr
eque
Hz, individually. These blended boost have an identical
and consistent F0 in whole length [2,18].
The details of formant transition related to these three
stimuli are presented in Table 1. After passing 50 ms of
formant transition period, F2 and F3 in 1240 to 2500 Hz, respectively remained constant at their transition end-point frequencies of 1240 and 2500 Hz. The dissimilari-ties reflected in F2 and F3, for [ba], F2 and F3 rose from 900 Hz and 2400 Hz. For [da], F2 and F3 descent from 1700 and 2580. For [ga], F2 and F3 decreased from 3000 and 3100, respectively.
The F0 of these three diotic stimulus were identical and
constant in the entire duration [2,10]. The diotic stimuli
was presented at the rate of 4.65/s, and both stimulus polarities (build-up and rarefaction) were exhibited. The trial of stimulus was introduced to the correct ear through Etymotic’s ER-3 headphones (Etymotic Research, Elk Grove Village, IL), at the force of 83 db SPL. Video-taped program were presented to all subjects to promote their cooperation and stillness [2, 10].
Recording parameters
Continuous g.tec EEG was used for recording evoked potentials synchronized with auditory stimuli. Elec-trodes were located from Cz to ipsilateral earlobe, with forehead served as ground, band pass filtered from 0.05 Hz to 3000 Hz, and digitized at 20000 Hz. All elec-trodes were made with Ag/AgCl and their impedance was lower than 5 kΩ. For each stimuli, EEG was pro-cessed offline for creating average signals. An EEG was divided into 230 ms epochs (45 ms pre stimulus onset to 185 ms post stimulus) and each epoch was band pass filtered from 70 to 2000 Hz for isolating the brainstem response frequencies.
An artifact criterion of ±35 mV was applied in reject myogenic artifacts. The processed epochs were sepa-rately averaged for each stimuli according to their po-larity, then they were summed up to isolate the neural
response [2, 10,19]. Final averaged for each stimuli
ranged between 4000 to 4100 sweeps per subject for each stimulus [2].
Analysis
Formant transition period analysis
The formant transition is a part of response that cor-responds to the onset with duration of 0-70 ms. Accord-ing to different stimuli, latency is altered in this portion.
To isolate formant transition part and eliminate low-fre-quency activity that could obscure variation of latency, response waveform was additionally high-pass filtered at 300 Hz. First 70 ms of transition waveform of grand average response was selected for temporal analysis. For Fast Fourier Transform analysis (FFT), 18-58 ms of for-mant transition average was calculated in 50 Hz wide bins surrounding F0 and next 10 harmonics.
The range of 400-720 Hz referring to F0 frequency was chosen, then all 10 harmonic peaks marked for each stimulus by MATLAB software via Intraclass Correla-tion Coefficients (ICC), and Paired t test for evaluating frequency bin difference were performed in each stimu-lus. ABRs of each subject had 16 peaks in this portion, and peaks 1, and 2 were the starting point and called on-set response. Peaks 3, 5, 6, 7, 9, 10, 12, 13, 15, and 16 were the major peaks, and peaks 5, 8, 11, and 14 were the minor peaks. The peaks 15 and 16 were the end point of transient response where the acoustic properties of the three stimulus were identical.
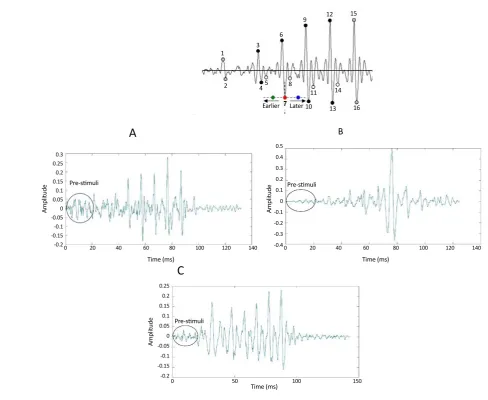
The grand-average signal marked by manual method is shown in Figure 2. The grand average signal for each stimulus with the use of the reference lookup Table is
shown in Figure 2.A, 2.B,2.C. As per the visual analysis
report of an audiologist, the onset of response revealed in 9 ms, with every ~10 ms major peaks of activity oc-curring around 23 ms. According to this theory, we es-timated the grand average of each of three stimuli re-sponse and divided it into 7 epochs with duration of 10 ms. Starting epoch of this portion included 2 peaks (1, 2) that was called the starting point of response. Also, end-point included 2 peaks (15, 16), called as the offset, but other epochs included 3 peaks (positive, negative major peaks and minor peaks). In this technique, after estimat-ing positive and negative major peaks, maximum and minimum amplitude of each signal were evaluated by calculating f(c). In this phase, we set limitation periods for identifying direction curvature and detection peaks in each epoch, according to Equation (1).
(1) f(c)={ y'=0 y'<0y'=0 y'>0
step, the response signal shifted to grand average signal and produced template signal.
Coefficient correlation between template signal and stimuli signal was then applied to minimize the effect of artifacts. Finally, using earlier described periodic limi-tation and using pre-processing technique, all response signals of each subject were marked automatically. The values of latencies and amplitude were tabulated in dif-ferent lookup Table for each stimulus and each subject.
We set individual variance for marking peaks, due to brainstem jittering in this automatic method, which means that the tolerance of each epoch was ±2ms. ICC analyses were performed utilizing the non-normalized latencies on 4 gatherings of peaks, onset peaks 1 and 2, major peaks 3, 4, 6, 7, 9, 10, 12, and 13, minor peaks 5, 8, 11, and 14, and end-point peaks 15 and 16. A 3 x K repeated measures ICC (where 3 is the quantity of stimulus conditions and K is the quantity of peaks) was led on each gathering. For gatherings of peaks which the stimulus×peak connection was critical, repeated mea-sures ICC and Paired t test were performed to examine contrasts between stimulus latency.
Frequency domain measures
A Fast Fourier Transform (FFT) analysis was used for evaluating the spectral domain of response. We selected 18-58 ms of formant transition response time and 2000 Hz range of frequency. The average response was calculated in 50 Hz wide bins surrounding F0 and next 10 harmon-ics. The range of 400-720 Hz referring to F0 frequency was chosen and then all 10 harmonic peaks were marked for each stimulus by MATLAB software. Repeated mea-sures ICC and Paired t test were used for evaluating the significance of frequency bins for each stimulus.
3. Results
We compared automatic and manual methods and then compared individual differences in Persian speakers and English speakers. The automatic algorithm could cor-rectly detect the locations of each peak in ABR signals. Additionally, the performance of this objective method
is estimated 90% for all peaks, but overlooking peak 16 of /da/ response, the performance rate is 95% and
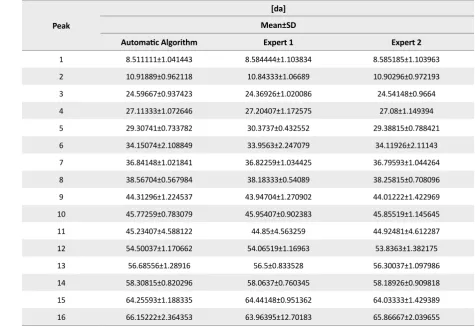
fur-ther details are presented in Tables 2, 3, and 4. The mean
score and standard deviation of the non-normalized la-tencies for 16 peaks picked for each stimulus condition
by automatic and manual methods are described in Table
5, 6,7. The response waveform of the first 70 ms of
tran-sition portion, were used for comparing objective and
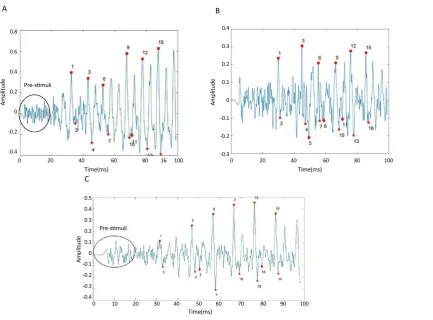
subjective method in Persian speakers. Figures 3, 3a, and
3b illustrate automatic method, and Figures 4, 4a, and 4b
illustrate manual method.
The within-subject main effect of stimulus (F2,52=6.888,
P=0.002) was significant and stimulus X peak
interac-tion (F2,53=0.863, P=0.428) for the end point was
non-significant. Also, English speakers had the same signifi-cant result for within-subject main effect of stimulus. In onset peaks 1 and 2, no significance within-subject main
effect of stimulus (F1.45, 37.54=2.144, P=0.147) was found,
and stimulus X peak interaction (F2,52=2.339, P=0.107)
was non-significant. Same result was obtained for Eng-lish speakers. Also minor peaks have greater between-stimulus latency differences than major peaks and their latency time is longer than major peaks. The same is true in English speakers.
Frequency domain
For analysis of transient portion in frequency domain, a range of 18-58 ms transition part was chosen. Grand averaged signal was plotted. Significant and non-signifi-cant differences were seen in this range for each stimu-lus. Figure 5 shows grand averaged signal and the next 10 harmonics marked by the manual method [3]. Figures
5, 5a, 5b show peak detection in 10 harmonics
wave-form for each stimulus by the automatic method. There is no significance between stim X peak interaction and the main within-subject effect of stimulus for each bins, because P values are greater than 0.05.
The results were the same for English speakers but the results of the Paired t test for follow-up scores be-tween these two groups were different for each har-monic. The follow-up Paired t tests for Farsi speakers harmonic were performed to assess between-stimulus
Table 1. Three Stimulus in Different Formants
Name of Stimulus /da/ /ba/ /ga/
Formant F2 and F3 falling F2 and F3 rising FA and F3 falling
differences. The results are displayed in Table 8. This study revealed that in harmonics 1, 3, 6, 9, 10, each stimulus is not significant. In harmonic 2, only /da/ and /ba/ are significant. In harmonic 4, two pairs of stimuli / da/+/ga/ and /ba/+/ga/ are significant. In harmonic 5, all stimuli are significant. In harmonic 7 only /ba/ and /ga/ are significant, and in harmonic 8, two pairs of stimuli / ba/+/ga/ and /da/+/ga/ are significant.
4. Discussion
The purpose of this study was to describe new sim-ple automatic peak detection for extracting features of cABR. In this study, a cross-correlation between grand average signal of all subject response and response sig-nal was used for shifting sigsig-nals of each subject across the grand average signal and producing template
sig-Table 2. Comparing manual and automatic method in all peaks
ICC
Stimulus
/ga/ /ba/
/da/ General
0.999 0.999
0.995 0.998
A
B10 11
13 14
16 8
5 4 2
1 3
6
9 12 15
C
Figure 2. All 16 peaks for each stimuli in manual (visual) method [2]
A: Schematic of automatic /ba/ Grand average; B: Schematic of automatic /ga/ Grand average; C: Schematic of automatic/ da/ grand average
Time (ms) Time (ms)
Time (ms)
Pre-stimuli Pre-stimuli
Pre-stimuli
Amplitude Amplitude
Amplitude
0.3 0.25 0.2 0.15 0.1 0.05 0 -0.05 -0.1 -0.15 -0.2
0.25 0.2 0.15 0.1 0.05 0 -0.05 -0.1 -0.15 -0.2
0 20 40 60 80 100 120 140 0 20 40 60 80 100 120 140
0 50 100 150 0.5
0.4 0.3 0.2 0.1 0 -0.1 -0.2 -0.3 -0.4
nal. With the use of limitation periodic time, this au-tomatic quality evaluation method was compared to a subjective evaluation by two experts of audiology and electro physiology. The results indicated that au-tomatic method presents a 90% correlation coefficients averaged with the visual assessment. It means that our first hypothesis (automatic algorithm used for detecting peaks) is similar to visual analysis.
The figures show an important bias among experts in the subjective method, which means that visual
judg-ment is not really exhaustive [15,16,18]. Comparing
the subjective and objective method showed that au-tomatic methods are uniform, worldwide, useful, and eliminate human bias. There is no limitation for the
number of data [11]. Therefore, automatic algorithm
could extract latency time in high accuracy and im-prove fractional milliseconds.
Table 3. Performance rate of comparing manual and automatic method in each peak separately
16 15 14 13 12 11 10 9 8 7 6 5 4 3 2 1 Peak 0.64 0.948 0.917 0.879 0.908 0.99 0.848 0.967 0.885 0.969 0.989 0.888 0.959 0.982 0.98 0.96 ICC
Table 4. Comparing manual and automatic methods in each peak for each stimulus
p16 P15 P14 p13 p12 p11 p10 P9 P8 P7 P6 P5 P4 P3 P2 P1 0.131-0.866 0.945 0.573 0.796 0.998 0.776 0.834 0.829 0.995 0.997 0.670 0.968 0.981 0.987 0.986 I da 0.913 0.950 0.761 0.834 0.838 0.655 0.797 0.985 0.671 0.950 0.956 0.871 0.941 0.915 0.983 0.994 C ba 0.797 0.991 0.983 0.982 0.975 0.862 0.979 0.854 0.975 0.895 0.965 0.948 0.926 0.961 0.929 0.959 C ga
Figure 3.a. Peak detection of /da/ in automated ABR; b: Peak detection of /ba/ in automated ABR
A B C Time(ms) Time(ms) Time(ms) Pre-stimuli Pre-stimuli Amplitude Amplitude Amplitude 0.8 0.6 0.4 0.2 0 -0.2 -0.4 0.4 0.3 0.2 0.1 0 -0.1 -0.2 -0.3 0.5 0.4 0.3 0.2 0.1 0 -0.1 -0.2 -0.3 -0.4
0 20 40 60 80 16 100 0 20 40 60 80 100
Figure 4.a: Peak detection of /da/ in manual; b: Peak detection of /ba/ in automated ABR
A B
C
Time (ms) Time (ms)
Amplitude
Amplitude
Time (ms)
Amplitude
0.8
0.6
0.4
0.2
0
-0.2
-0.4
0.4
0.3
0.2
0.1
0
-0.1
-0.2
-0.3
0.5 0.4 0.3 0.2 0.1 0 -0.1 -0.2 -0.3 -0.4
-10 0 10 20 30 40 50 60 70 80 -10 0 10 2 30 40 50 60 70 80
-10 0 10 20 30 40 50 60 70 80
Table 5. Mean±SD for /da/ responses
[da]
Peak Mean±SD
Expert 2 Expert 1
Automatic Algorithm
8.585185±1.103963 8.584444±1.103834
8.511111±1.041443 1
10.90296±0.972193 10.84333±1.06689
10.91889±0.962118 2
24.54148±0.9664 24.36926±1.020086
24.59667±0.937423 3
27.08±1.149394 27.20407±1.172575
27.11333±1.072646 4
29.38815±0.788421 30.3737±0.432552
29.30741±0.733782 5
34.11926±2.11143 33.9563±2.247079
34.15074±2.108849 6
36.79593±1.044264 36.82259±1.034425
36.84148±1.021841 7
38.25815±0.708096 38.18333±0.54089
38.56704±0.567984 8
44.01222±1.422969 43.94704±1.270902
44.31296±1.224537 9
45.85519±1.145645 45.95407±0.902383
45.77259±0.783079 10
44.92481±4.612287 44.85±4.563259
45.23407±4.588122 11
53.8363±1.382175 54.06519±1.16963
54.50037±1.170662 12
56.30037±1.097986 56.5±0.833528
56.68556±1.28916 13
58.18926±0.909818 58.0637±0.760345
58.30815±0.820296 14
64.03333±1.429389 64.44148±0.951362
64.25593±1.188335 15
65.86667±2.039655 63.96395±12.70183
The second purpose of this study was to compare the relationship between the automatic and manual method. Each method showed that brainstem response among manufactured voiced stop consonants /ga/, /da/, and /ba/ recurrence advances are extraordinary only in F2 and F3. Since the scope of F2 and F3 are over the phase-locking capacities of the brainstem recurrence, they would be shown as latency contrasts among re-sponses. It implies responses to /ga/ and would have the most punctual latencies. As it contains the most astounding F2 and F3 frequencies, responses to /ba/ would have the most recent latencies because of having the least F2 and F3 frequencies, and responses to [da] would have middle latency responses [2].
Skoe et al. used the fast Fourier analysis and men-tioned that F2 and F3 recurrence ranges are higher than the phase-locking of the brainstem response, conse-quently recurrence contrasts are characterized as la-tency differences due to responses. Harmonics figure illustrated that the most similarities are between /da/
and /ga/ neural encoding, and the most dissimilarities are between /ba/ and /ga/ of their neural encoding. This explains that the formant frequency of each stimulus causes dissimilarity or similarity in auditory response [2]. The same results were obtained for our third hy-pothesis that automatic algorithm could be used as a co-observer in clinics. The latency time of onset re-sponse of /ba/, /da/ and /ga/ for Persian speakers, are later than English speakers. We hypothesized that these differences of latency time between Persian speakers and English speakers are related to differences in age, language training, and plasticity of brainstem in these two groups.
Language experience
Language experience plays a critical role in the de-velopment of neural encoding in auditory system at the place of cortical and subcortical levels [20]. Evidence has shown that when native people listen to their native
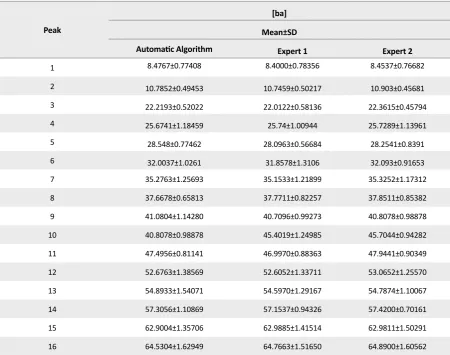
Table 6. Mean±SD of Persian speakers by automatic and manual method
[ba]
Peak Mean±SD
Expert 2 Expert 1
Automatic Algorithm
8.4537±0.76682 8.4000±0.78356
8.4767±0.77408 1
10.903±0.45681 10.7459±0.50217
10.7852±0.49453 2
22.3615±0.45794 22.0122±0.58136
22.2193±0.52022 3
25.7289±1.13961 25.74±1.00944
25.6741±1.18459 4
28.2541±0.8391 28.0963±0.56684
28.548±0.77462 5
32.093±0.91653 31.8578±1.3106
32.0037±1.0261 6
35.3252±1.17312 35.1533±1.21899
35.2763±1.25693 7
37.8511±0.85382 37.7711±0.82257
37.6678±0.65813 8
40.8078±0.98878 40.7096±0.99273
41.0804±1.14280 9
45.7044±0.94282 45.4019±1.24985
40.8078±0.98878 10
47.9441±0.90349 46.9970±0.88363
47.4956±0.81141 11
53.0652±1.25570 52.6052±1.33711
52.6763±1.38569 12
54.7874±1.10067 54.5970±1.29167
54.8933±1.54071 13
57.4200±0.70161 57.1537±0.94326
57.3056±1.10869 14
62.9811±1.50291 62.9885±1.41514
62.9004±1.35706 15
64.8900±1.60562 64.7663±1.51650
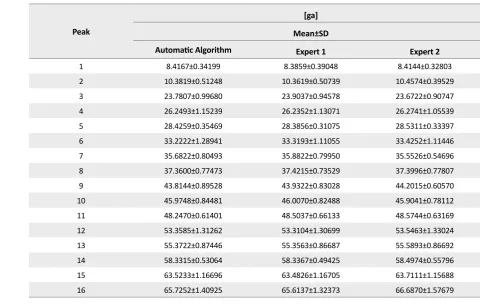
Table 7. Mean±SD of Persian speakers by automatic and manual method
[ga]
Peak Mean±SD
Expert 2 Expert 1
Automatic Algorithm
8.4144±0.32803 8.3859±0.39048
8.4167±0.34199 1
10.4574±0.39529 10.3619±0.50739
10.3819±0.51248 2
23.6722±0.90747 23.9037±0.94578
23.7807±0.99680 3
26.2741±1.05539 26.2352±1.13071
26.2493±1.15239 4
28.5311±0.33397 28.3856±0.31075
28.4259±0.35469 5
33.4252±1.11446 33.3193±1.11055
33.2222±1.28941 6
35.5526±0.54696 35.8822±0.79950
35.6822±0.80493 7
37.3996±0.77807 37.4215±0.73529
37.3600±0.77473 8
44.2015±0.60570 43.9322±0.83028
43.8144±0.89528 9
45.9041±0.78112 46.0070±0.82488
45.9748±0.84481 10
48.5744±0.63169 48.5037±0.66133
48.2470±0.61401 11
53.5463±1.33024 53.3104±1.30699
53.3585±1.31262 12
55.5893±0.86692 55.3563±0.86687
55.3722±0.87446 13
58.4974±0.55796 58.3367±0.49425
58.3315±0.53064 14
63.7111±1.15688 63.4826±1.16705
63.5233±1.16696 15
66.6870±1.57679 65.6137±1.32373
65.7252±1.40925 16
A B
Figure 5. Automatic/da/ FFT peak detection in 10 harmonics
a: Automatic /ba/ FFT peak detection in 10 harmonics; b: Automatic /ga/ FFT peak detection in 10 harmonics
Single-sided amplited spectrum of y (t)
Single-sided amplited spectrum of y (t) Single-sided amplited spectrum of y (t)
Frequency (Hz)
Frequency (Hz) Frequency (Hz)
|Y(f
)|
|Y(f
)|
0.18 0.16 0.14 0.12 0.1 0.08 0.06 0.04 0.02 0
1.2
1
0.8
0.6
0.4
0.2
0
1.2
1
0.8
0.6
0.4
0.2
0
0 1000 2000 3000 4000 5000 6000 7000 8000 9000 10000
0 1000 2000 3000 4000 5000 6000 7000 8000 9000 10000
stimuli, the F0 of brainstem response are larger than the non-native speakers [20-22].
According to their early learning, the formation and functional properties of neural organization means high
skills in detecting and predicting native language [20].
Neural representation of pitch reveals that language ex-perience can affect the behavior of action potential and
sound processing in brainstem and cortex [22,23].
Cellu-lar adaptations lead to plasticity in brainstem and cortex, which implies vast somatic synapses, quick discharge time course, quick AMPA receptor energy, plasticity prompts brief synaptic responses that advances insignifi-cant worldly summation, balanced flagging,
short-laten-cy spikes, and a short hard-headed period [23,24].
Age
Maturation influences the transmission time. It influ-ences the peripheral auditory pathway maturity amid the initial 2 months of life, while the central transmission time abbreviates up to the age of 5 to 8 years. The III-II and V-IV inter peak latencies demonstrated maturational changes like those of V-I IPLs, interestingly, II-I and IV-III indicated little changes. An unmistakable increment of the amplitude of peak V up to age of 4 and a conse-quent decreasing tendency was observed. In this study, Persian speakers were between 22 and 28 years old, and English speakers between 8 and 12 years. This age
dif-ference leads to difdif-ferences in morphology of V-I peaks
and amplitude of response [25, 26]. Results indicated
that separate latency and amplitude norms for English speakers and Persian speakers have worthwhile signifi-cance to cABR measures [25].
By overviewing the result of this study, it seems that using more professional audiologists in speech ABR field could increase the precision of grand average in the visual method and facilitates comparing the methods. By reducing the time of recording, artificial noise and men-tal fatigue could decrease. Future studies could use Lin-ear Discriminant Analysis (LDA) classifier for analyzing or extracting the effect of mental fatigue on latency time.
Gender
Gender is a physiological factor that can affect brain-stem auditory, evoked potential responses, and latencies. Head size and Body Mass Index (BMI) in different age and genders are different; these differences could show up in latencies of peaks I-III [26].
5. Conclusion
The automatic algorithm could detect all 16 peaks in brainstem response signals, and extract latency time with high accuracy. There is no visual bias in this al-gorithm. Time limitation including individual variance
Table 8. Follow-up paired t test results for harmonics in Persian speakers
P Paired t-Test
SD Mean
Pair Stimuluses Harmonics
0.585 0.553
0.0078506 0.0008358
1 ba_H4 - da_H4
0.001 3.961
0.0072078 0.0054945
2 ba_H4 - ga_H4
0.002 3.375
0.0071720 0.0046587
3 da_H4 - ga_H4
0.085 1.789
0.0049252 0.0016954
4 ba_H5 - da_H5
0.000 5.443
0.0045544 0.0047706
5 ba_H5 - ga_H5
0.013 2.679
0.0059645 0.0030753
6 da_H5 - ga_H5
0.483 0.711
0.0023994 0.0003285
7 ba_H7 - da_H7
0.017 2.551
0.0021118 0.0010368
8 ba_H7 - ga_H7
0.097 1.721
0.0021384 0.0007083
9 da_H7 - ga_H7
0.310 1.035
0.0018044 0.0003592
10 ba_H8 - da_H8
0.007 2.934
0.0016689 0.0009422
11 ba_H8 - ga_H8
0.052 2.037
0.0014867 0.0005829
provides higher precision for calculating latency time. The high dissimilarity between different experts and automatic algorithm is in peaks 15 and 16, because there are offset and the endpoint of signals and down-ing in most artifacts.
Ethical Considerations
Compliance with ethical guidelines
Prior to study, all participants signed a written informed consent, approved by the Ethics Committee of Tehran University of Medical Sciences. They were rewarded for their participation.
Funding
This research did not receive any specific grant from funding agencies in the public, commercial, or not-for-profit sectors.
Conflict of interest
No irreconcilable interest were identified with this re-search. The authors certify that they have no affiliation with or involvement in any organization or entity with any financial, or non-financial interest in the subject mat-ter or mamat-terials dismissed in this manuscript.
Acknowledgments
This study was a part of master's thesis of Negar Amirian, supported by Islamic Azad University, Cen-tral Tehran Branch. The authors gratefully acknowledge Dr. Bram Van Dun for his unforgettable support during this study and marking the peaks of brainstem response waves, Dr. Zahra Shirjiyan for her kind assistance, Dr. Mohsin Reza Heydari, Dr. Ali Akbar Tahaei, and Dr. Mohsen Ahadi for their guidance regarding neurosci-ence and auditory system during this study.
References
[1] Jewett DL, Williston JS. Auditory-evoked far fields aver -aged from the scalp of humans. Brain. 1971; 94(4):681-96.
[DOI:10.1093/brain/94.4.681] [PMID]
[2] Johnson KL, Nicol T, Zecker SG, Bradlow AR, Skoe E, Kraus N. Brainstem encoding of voiced consonant–vowel stop syllables. Clinical Neurophysiology. 2008; 119(11):2623-5.
[DOI:10.1016/j.clinph.2008.07.277] [PMID]
[3] Blumstein SE, Isaacs E, Mertus J. The role of the gross spec-tral shape as a perceptual cue to place of articulation in
ini-tial stop consonants. The Journal of the Acoustical Society of America. 1982; 72(1):43-50. [DOI:10.1121/1.388023] [PMID]
[4] Ballachanda BB, Moushegian G, Stillman RD. Adaptation of the auditory brainstem response: Effects of click intensity, polarity, and position. Journal of the American Academy of Audiology. 1992; 3(4):275-82. [PMID]
[5] Valderrama JT, de la Torre A, Alvarez I, Segura JC, Thornton ARD, Sainz M, et al. Automatic quality assessment and peak
identification of auditory brainstem responses with fitted para -metric peaks. Computer Methods and Programs in Biomedicine. 2014; 114(3):262-75. [DOI:10.1016/j.cmpb.2014.02.015] [PMID]
[6] Don M, Elberling C. Use of quantitative measures of audi-tory brainstem response peak amplitude and residual back-ground noise in the decision to stop averaging. The Jour-nal of the Acoustical Society of America. 1996; 99(1):491-9.
[DOI:10.1121/1.414560] [PMID]
[7] Sparacino G, Milani S, Arslan E, Cobelli C. A Bayesian ap-proach to estimate evoked potentials. Computer Methods and Programs in Biomedicine. 2002; 68(3):233-48. [DOI:10.1016/ S0169-2607(01)00175-4]
[8] Sadeghian A, Dajani HR, Chan ADC. Classification of
speech-evoked brainstem responses to English vowels. Speech Communication. 2015; 68:69-84. [DOI:10.1016/j. specom.2015.01.003]
[9] Fridman J, John E, Bergelson M, Kaiser J, Baird H.
Appli-cation of digital filtering and automatic peak detection to
brain stem auditory evoked potential. Electroencephalog-raphy and Clinical Neurophysiology. 1982; 53(4):405-16.
[DOI:10.1016/0013-4694(82)90005-0]
[10] Chan FHY, Lam FK, Poon PWF, Qiu W. Detection of
brain-stem auditory evoked potential by adaptive filtering. Medical
and Biological Engineering and Computing. 1995; 33(1):69-75.
[DOI:10.1007/BF02522949] [PMID]
[11] Grönfors T. Peak identification of auditory brainstem re
-sponses with multifilters and attributed automaton. Comput -er Methods and Programs in Biomedicine. 1993; 40(2):83-7.
[DOI:10.1016/0169-2607(93)90002-3]
[12] Galbraith GC. Enhanced brainstem and cortical evoked
response amplitudes: Single-trial covariance analysis. Per-ceptual and Motor Skills. 2001; 92(3):659-72. [DOI:10.2466/ pms.2001.92.3.659] [PMID]
[13] Sundaramoorthy V, Pont MJ, Degg C, Cook JA. A
com-puterized database of ‘normal’auditory brainstem re-sponses. British Journal of Audiology. 2000; 34(3):197-201.
[DOI:10.3109/03005364000000129] [PMID]
[14] Vannier E, Adam O, Motsch JF. Objective detection of
brain-stem auditory evoked potentials with a priori information
from higher presentation levels. Artificial Intelligence in Medi -cine. 2002; 25(3):283-301. [DOI:10.1016/S0933-3657(02)00029-5]
[15] Weber BA, Fletcher GL. A computerized scoring procedure for
auditory brainstem response audiometry. Ear and Hearing. 1980; 1(5):233-6. [DOI:10.1097/00003446-198009000-00001] [PMID]
[16] Arnold SA. Objective versus visual detection of the
audi-tory brain stem response. Ear and Hearing. 1985; 6(3):144-50.
[DOI:10.1097/00003446-198505000-00004] [PMID]
[17] Kakiashvili T, Koczkodaj WW, Woodbury-Smith M.
comparisons method: Evidence from a clinical data study. Computer Methods and Programs in Biomedicine. 2012; 105(3):210-6. [DOI:10.1016/j.cmpb.2011.09.011] [PMID]
[18] Jafarpisheh AS, Jafari AH, Abolhassani M, Farhadi M,
Sadjedi H, Pourbakht A, et al. Nonlinear feature extraction
for objective classification of complex auditory brainstem
responses to diotic perceptually critical consonant-vowel syl-lables. Auris Nasus Larynx. 2016; 43(1):37-44. [DOI:10.1016/j. anl.2015.06.003] [PMID]
[19] McMath RC. Engineering the New South: Georgia Tech,
1885-1985. Athens: University of Georgia Press; 1985.
[20] Skoe E, Kraus N. Auditory brainstem response to
com-plex sounds: A tutorial. Ear and Hearing. 2010; 31(3):302-4.
[DOI:10.1097/AUD.0b013e3181cdb272] [PMID] [PMCID]
[21] Galbraith GC, Bhuta SM, Choate AK, Kitahara JM,
Mul-len TA. Brain stem frequency‐following response to dichotic vowels during attention. Neuroreport. 1998; 9(8):1889-93.
[DOI:10.1097/00001756-199806010-00041] [PMID]
[22] Krishnan A, Gandour JT, Bidelman GM.
Experience-de-pendent plasticity in pitch encoding: From brainstem to audi-tory cortex. Neuroreport. 2012; 23(8):498-502. [DOI:10.1097/ WNR.0b013e328353764d] [PMID] [PMCID]
[23] Zounopoulos T, Kraus N. Learning to encode timing:
Mecha-nisms of plasticity in the auditory brainstem. Neuron. 2009; 62(4):463-9. [DOI:10.1016/j.neuron.2009.05.002] [PMID] [PMCID]
[24] Trussell LO. Synaptic mechanisms for coding timing
in auditory neurons. Annual Review of Physiology. 1999; 61(1):477-96. [DOI:10.1146/annurev.physiol.61.1.477] [PMID]
[25] Mochizuki Y, Go T, Ohkubo H, Tatara T, Motomura T.
Developmental changes of Brainstem Auditory Evoked Po-tentials (BAEPs) in normal human subjects from infants to young adults. Brain and Development. 1982; 4(2):127-36.
[DOI:10.1016/S0387-7604(82)80006-5]
[26] Stockard JE. Brainstem auditory-evoked responses: Normal
![Figure 1. left: /ga/ Schematic, center: /da/ Schematic, right: /ba/ Schematic stimuli in ms [2]](https://thumb-us.123doks.com/thumbv2/123dok_us/8886809.1822963/3.609.102.509.641.745/figure-left-schematic-center-schematic-right-schematic-stimuli.webp)