Published by the
Iranian Chemical Society
Anal. Bioanal. Chem. Res., Vol. 1, No. 1, 38-49, June 2014.
Simultaneous Determination of Disinfection By-products in Water Samples from
Advanced Membrane Treatments by Headspace Solid Phase Microextraction and
Gas Chromatography-Mass Spectrometry
C. Martínez
a, V. Gómez
b, F. Borrull
a,*, E. Pocurull
aa
Department of Analytical Chemistry and Organic Chemistry, Universitat Rovira i Virgili, Marcel·lí Domingo s/n, Sescelades Campus,
43007, Tarragona, Spain
bDow Water & Process Solutions, Dow Chemical Ibérica S.L, Autovia Tarragona-Salou s/n, 43006, Tarragona, Spain
(Received 18 February 2014, Accepted 3 May 2014)
A headspace-solid phase microextraction (HS-SPME) and gas chromatography-mass spectrometry (GC-MS) method has been developed
for the simultaneously determination of 20 disinfection by-products (DBPs) in water samples from reverse osmosis (RO) membranes. Selected compounds belong to different families including: trihalomethanes (THMs), halogenated acetonitriles (HANs), halogenated
nitromethanes (HNMs), halogenated ketones (HKs) and other halogenated DBPs. Four commercial fibres with different polarities were tested for the extraction of the compounds and the main variables affecting HS-SPME such as extraction time, extraction temperature and
pH of the samples were optimized by applying a central composite design.
The method showed good detection limits in the range of 0.003 g l-1 up to 0.010 g l-1 for most of the compounds with reasonable
linearity with r2 higher than 0.991. Moreover, the repeatability of the method, expressed as relative standard deviation (RSD) was lower than 13% (n = 5, 1 g l-1) in brackish and wastewater samples.
The validated method has been applied for the determination of the target DBPs in RO water samples from application research units, which treated water from various origins (wastewater, brackish water and sea water), showing good performance in the different types of
studied samples. The analysis revealed the presence of several DBPs regarding different families, such as trichloromethane (with concentrations up to 0.36 μg l-1), chloroiodomethane (0.5-1.44 μg l-1), dibromochloromethane (found at concentrations up to 0.76 μg l-1)
and tribromoacetaldehyde (at concentrations up to 11 μg l-1 in the influent samples). The tendency of most of them indicated a trend of removal by reverse osmosis treatments, especially the total concentration of THMs which decreased below the limit of detection.
Keywords: Advanced membrane water treatment, Disinfection by-products, Gas chromatography-mass spectrometry, Solid-phase
microextraction, Trihalomethanes, Water samples
INTRODUCTION
Water is a scarce commodity and a fundamental resource for the human being since it plays a decisive role in health. Its scarcity is driving the increased use of recycled water and removal of contaminants from treated wastewater that is now an important research issue, particularly for potable
*Corresponding author. E-mail: francesc.borrull@urv.cat
micropollutants. Moreover, UF membrane processes are used as a pretreatment of the reverse osmosis, improving the efficiency of these advance membrane treatments becoming into an overall increase in the efficiency of the process [3].
For decades, municipalities have used chlorine as a primary disinfectant for brackish water sources in order to inactive microbial pathogens. While the benefits of chlorination are well documented [4], a side effect of chlorination is that the residual chlorine can react with naturally occurring organics in water, oxidizing them to form disinfection products (DBPs) [5-7]. These by-products may lead to increased health risks if present at μg l -1
levels. A generation ago, when these contaminants were first discovered in drinking water [8-9], concentrations of several hundred μg l-1 were common. Nowadays, after many years of actively avoiding trihalomethanes (THM) production, most water-works supply tap water with less than 20 μg l-1. THMs have been considered probable human carcinogens (kidney, liver, bladder cancers) [10] and have been regulated in drinking water by the United States Environmental Protection Agency (EPA or sometimes USEPA) with a mandatory Maximum Contaminant Level (MCL) of 100 g l-1 of total THM [11]. However, recently a new level of 80 μg l-1 has been proposed by the government as a cause of miscarriages. In the actual European and therefore Spanish Legislation [12] the limit of the total THM concentration is 100 μg l-1.
Next in prominence after THMs are the halogenated acetonitriles (HANs) [13], the halogenated nitromethanes (HNMs) [14] and the halogenated ketones (HKs) [15]. Most of these compounds are made from two-carbon fragments. They are found in chlorinated waters at levels one-third to one-half of the THM levels. When they are eventually regulated explicitly, it is expected that they will receive MCLs in the 30-80 g l-1 range. Epidemiological studies have suggested a link between consumption of drinking waters containing elevated levels of DBPs and adverse human health outcomes, particularly bladder cancer and reproductive effects [16-17].
One goal of the water treatment processes is to control these compounds produced when a disinfectant reacts with ubiquitous dissolved organic matter (DOM), chemicals in water which may be of natural origin such as bromide and iodide and anthropogenic pollutants. Therefore, the
development of a highly sensitive method for their simultaneously determination has become a priority. Several extraction techniques can be used for the extraction of disinfection by-products from water samples such as
liquid-liquid extraction (LLE), headspace solid phase
microextraction (HS-SPME) and headspace single drop microextraction (SDME) [5,13,18]. In this study HS-SPME has been selected because it allows complete elimination of organic solvents in the pretreatment step and decreases the number of steps needed for sample preparation becoming an accepted technique for the determination of volatile and semi-volatile substances, as well as it could be a totally automated technique. Another advantage of HS techniques when volatile compounds are analyzed is that the extraction is highly selective and the matrix effect becomes lower than submerged techniques [19].
In this study a method based on HS-SPME and GC-MS for the simultaneous characterization of 20 disinfection by-products belonged to different families with various chemical properties has been developed. The DBPs studied included trihalomethanes, haloacetonitriles, halonitro-methanes, haloketones, haloaldehydes and other chlorine, bromine and iodinated disinfection by-products. Table 1 lists the different compounds. The method has been applied to determine these DBPs in aqueous samples from different application research units using RO membranes which treated water from secondary effluents of wastewater, sea and brackish water.
EXPERIMENTAL
Solvents and Reagents
The 4 THMs (chloroform, bromodichloromethane, dibromochloromethane and bromoform) were obtained from a mixture of EPA 501/601 Trihalomethanes Calibration Mix provided by Sigma-Aldrich (Supelco, Madrid, Spain), all of them in a concentration of 2000 mg l‐1 in methanol (MeOH).
A mixture of 7 disinfection by-products of different groups (bromochloroacetonitrile, trichloronitromethane, dichloroacetonitrile, dibromoacetonitrile,
trichloroaceto-nitrile, 1,1-dichloropropanone and
Volatiles Mix provided by Sigma-Aldrich, all of them in a concentration of 2000 mg l‐1 in acetone.
1,2-dibromo-3-chloropropane (90-95%), bromonitro-methane (90%), tribromoacetaldehyde (97%), 2-chloro-2-methylpropane (>99%), 2-bromo-2 2-chloro-2-methylpropane (98%), 2-chloro-2-nitropropane (95%), 1-iodo-2-methylpropane (97%), chloroiodomethane (97%) and iodoform (99%) were purchased from Sigma-Aldrich. A working solution of all compounds (except tribromoacetaldehyde) was prepared at 10 mg l-1 in GC grade methanol with purity >99.9% (from Prolabo, Barcelona, Spain) from the individual standards or
mixtures. Moreover, tribromoacetaldehyde was prepared individually at 10 mg l-1 in acetone because of its low stability in MeOH [20]. Solutions were prepared daily in brackish water samples for the calibration curves and stored under refrigeration (2-6 ºC).
Sodium chloride (NaCl) (ACS reagent ≥ 99 %) was
supplied by Sigma-Aldrich. GC grade acetone with purity 99.8% and sulphuric acid (H2SO4) with purity 98% were supplied by Merck (Darmstadt, Germany). Helium gas with 99,999% purity was supplied from Praxair (Barcelona, Spain).
Table 1. Target Compounds, Quantification and Identification Ions and Main Validation Data Obtained by Analyzing Effluents of Reverse Osmosis of Brackish Water (BW) and Waste Water (WW) Advance Membrane Treatments Spiked at 1 g l-1 (n = 5)
Compounds tR (min) Q1 Q2
LOD
(g l-1) WW
LOD
(g l-1) BW
BW Linear Range*
(g l-1) BW r2
BW RSDa
(%)
BW RSDb
(%)
Propane, 2-chloro-2-methyl- 5.38 57 41, 77 0.010 0.010 0.030-10 0.991 10 14
Propane, 2-bromo-2-methyl- 5.85 57 41 0.010 0.010 0.030-10 0.998 6 12
Trichloromethane 7.00 83 85, 47 0.030 0.010 0.030-10 0.999 4 12
Acetonitrile, trichloro- 8.65 108 110 0.50 0.30 1.0-10 0.991 6 15
Bromonitromethane 8.91 91 45, 43 0.50 0.50 1.0-10 0.994 8 10
Methane, bromodichloro- 9.45 83 85, 129 0.010 0.003 0.010-10 0.999 4 5
Acetonitrile, dichloro- 9.60 74 82, 76, 47 0.010 0.010 0.030-10 0.994 4 5
Chloroiodomethane 9.90 49 176, 127 0.010 0.010 0.030-10 0.995 4 7
2-Propanone, 1,1-dichloro- 10.17 43 83, 63 0.010 0.010 0.030-10 0.994 7 13
2-chloro-2-nitropropane 11.40 41 77, 79 0.030 0.010 0.030-10 0.995 13 15
Trichloronitromethane 11.55 119 117, 82 0.010 0.010 0.030-10 0.999 2 8
Propane, 1-iodo-2-methyl- 11.63 57
184, 127,
41 0.003 0.003 0.010-10 0.992 10 14
Methane, dibromochloro- 11.89 129 127, 48 0.010 0.003 0.010-10 0.999 2 14
Acetonitrile, bromochloro- 12.15 74 155, 118 0.050 0.030 0.10-10 0.991 13 17
2-Propanone, 1,1,1-trichloro- 13.24 43 125, 82 0.010 0.010 0.030-10 0.996 6 18
Methane, tribromo- 14.50 173
91, 79,
252 0.030 0.010 0.030-10 0.999 4 15
Acetonitrile, dibromo- 14.93 118 79, 81 0.100 0.100 0.50-10 0.995 6 12
Acetaldehyde, tribromo- 17.38 173 93, 91 0.100 0.100 0.50-10 0.999 7 11
Propane,
1,2-dibromo-3-chloro- 18.64 75 157, 41 0.010 0.003 0.010-10 0.999 13 16
Methane, triiodo- 21.22 127 394, 267 0.300 0.100 0.50-10 0.991 7 9
Instrumentation and Procedures
HS-SPME. The four commercial extraction fibres including, 65 m Polydimethylsiloxane/Divinylbenzene
(PDMS/DVB), 50/30 m Polydimethylsiloxane/
Divinylbenzene/Carboxen (PDMS/DVB/CAR), 85 m
Polyacrylate (PA) and 60 m Polyethylene Glycol (PEG), were purchased from Supelco (Madrid, Spain).
For the extraction procedure, 30 ml of sample was introduced into a 50 ml PTFE/silicone screw-cap glass vial. Then, 12 g of NaCl was added as a solid salt to obtain the stated concentration (saturated solution, 0.4 Kg l-1); the vial was closed and put over a magnetic stirrer (of 1 cm) in a water thermostatic bath at 45 ºC. The fibre of PDMS/DVB/CAR was exposed to the headspace above the aqueous solution and the magnetic stirring was applied at 1000 rpm during the 15 min of extraction. After the extraction, the fibre was inserted into the injection port of the gas chromatograph for the thermal desorption and analysis. Fibre was desorbed at 250 ºC during the chromatographic analysis in splitless mode. Although the analytes desorption occurred within the first five minutes of the desorption process, leaving the fibre in the injector prevent it from the contamination and carryover effects. Blanks of the fibres were analyzed daily in order to verify the absence of interfering compounds. The fibres were used at least 50 times for sample analysis.
GC-MS. The gas chromatography analysis was performed with a GCMS-QP2010 Ultra/GCMS-QP2010 SE from Shimadzu (Kyoto, Japan), equipped with a split/splitless injector and coupled to a mass spectrometer detector. Helium was employed as a carrier gas at constant column flow of 1 ml min-1. Analytes were separated with TRB-5MS column (60 m × 0.32 mm i.d., 1 m) from Tecknokroma (Barcelona, Spain). The split/splitless injection port was equipped with a 0.75 mm ID liner from Supelco and operated at 250 ºC, allowing direct injection of the fibre. The oven temperature program was started at 35 ºC, maintained for 5 min; then increased by 10 ºC min-1 up to 100 ºC, maintained for 2 min; and then increased by 15 ºC·min-1 up to 260 ºC, and maintained for 3 min. The total run time was 27 min. The MS analyses were conducted in SIM mode with a single quadrupole. Table 1 shows the quantifier and the qualifier selected ions for the SIM mode. Ionization was carried out in the electron impact (EI) mode
at 70 eV. The transfer line temperature was maintained at 300 ºC and the ion source temperature at 280 ºC.
Sample Collection
The analytical method has been developed to analyse different types of water samples belonging to the influent and effluent of tertiary advanced RO membrane treatments. These treatments have been applied using application research units, which were pilot plants of reverse osmosis processes, connected to the effluent of conventional treatment plants which treat water from brackish water (Ebro River, Tarragona, Spain), effluents of secondary treatment of an urban waste water treatment plant (Vila-Seca, Spain) and sea water (Mediterranean Sea, Tarragona, Spain).
Water samples were collected in 100 ml amber glass containers, they were acidified at pH 2 with sulphuric acid, filtered through 0.45 m filter, and stored in the dark at 4 ºC until analysis, within 48 h.
RESULTS AND DISCUSSION
In this study a method based on HS-SPME and GC-MS for the determination of 4 THMs, 4 HANs, 2 HNMs, 2 HKs, 3 iodinated DBPs, 2 chlorinated DBPs and 3 brominated DBPs has been developed. The 20 disinfection by-products pertain into different families and have different chemical properties.
After obtaining the GC column temperature
programming, good resolution was obtained for all compounds in less than 27 min and the 20 DBPs showed good responses. A chromatogram related to injection of standard solution at 5 g l-1 is depicted in Fig. 1. Moreover, the most abundant ion of each compound, the quantification ion, was selected as well as the two or three qualification ions which are summarised in Table 1.
Optimization of HS-SPME
selected according to the literature [21-23].
Optimization of solid-phase microextraction conditions for the selected DBPs was accomplished analyzing aliquots of the brackish water application research unit at 1 g l-1 level. The optimization was carried out at different extraction conditions using the chromatographic areas of the compounds analyzed.
Initial extraction conditions were selected according to the literature for some families of DBPs [21-23]. Thus, 30 ml of sample was introduced into a 50 ml PTFE/silicone screw-cap glass vial. Then, 0.4 Kg l-1 of NaCl (saturated solution) was added, the vial was closed and put over a magnetic stirrer in a thermostatic water bath at 40 ºC. The magnetic stirring was applied at 1000 rpm during the 20 min of extraction and the fibre was exposed to the headspace above the aqueous solution. After the extraction,
the fibre was inserted into the injection port of the gas chromatograph for the thermal desorption and analysis. Fibre was desorbed at 250 ºC during the chromatographic analysis in the splitless mode.
Due to the different properties of the compounds studied, four fibre coatings (PDMS/DVB, PDMS/DVB/ CAR, PA and PEG) were selected for evaluation. Differences between the coatings in terms of peak area were observed. Figure 2 shows the peak areas of the different selected compounds for the four fibres coatings. Although PDMS/DVB and PDMS/DVB/CAR (the less polar fibres) gave higher areas for all the studied target DBPs, PDMS/DVB/CAR was selected as the best coating for the extraction of these micropollutants from the water because the regulated compounds (the THMs group) such as chloroform and bromodichloromethane had high peak areas
with this type of fibre.
Once the fibre coating was chosen, the best extraction temperature, extraction time and pH were optimized applying a central composite design for each compound. The software used for the central composite design was SAS JMP 10.0.2 (SAS Institute Inc.). The variables assessed in the experiment were extraction temperature, extraction time and pH. Solution temperature was studied in the range of 30 ºC to 50 ºC, extraction time was evaluated from 10 to 30 minutes and pH was studied from 2 to 10.
In Figure 3a it could be observed the response surface of some representative groups of DBPs. HKs present higher areas at higher temperatures and HNMs manifest higher areas at temperatures between 35-40 ºC. Higher extraction temperatures increase vapour pressure for volatile analytes in the headspace. However, higher temperatures might also have created a less favourable coating-headspace (air) partition. Therefore, 45 ºC has been selected as the best extraction temperature as a compromise between all the families studied.
The areas of the DBPs were also checked for extraction times defined in the design. Figure 3b shows the behaviour of one of the representative THMs group, chloroform, with 20 min as the best extraction time. Moreover, the trend of
another compound, the 2-chloro-2-methyl-propane as a representative DBP, is also shown. This compound showed higher areas at extraction times between 15-20 min. As agreement between the different disinfection by-products, 15 min was selected as the best extraction time, considering that responses were sensible enough and time of analysis was acceptable.
As a part of the central composite design, the pH was also studied in the range between 2-10. Most compounds were preferably extracted at pH 2, being presented in Fig. 3c, where the highest areas of the HANs and the HKs are at pH 2.
To summarize, optimized extraction conditions concluded from this study were: headspace in a 50 mL vial, 30 mL sample volume, PDMS/DVB/CAR fibre, temperature 45 ºC, 0.4 Kg l-1 of NaCl addition, 15 min of extraction time, stirring at 1000 rpm and finally desorption of the analytes at 250 ºC throughout the entire analysis time. An exception occurs on sea water samples because of their high salt content. In this case, the addition of sodium chloride was 0.3 Kg l-1.
Method Validation
The method has been validated with the effluent of
3a) Extraction Temperature: Representative Examples
3b) Extraction Time: Representative Examples
3c) Extraction pH: Representative Examples
reverse osmosis from the brackish water application research unit. Previous to the validation parameters, a sample of effluent was analyzed and three of the target compounds were identified: chloro-methyl-propane, 2-bromo-2-methyl-propane and trichloromethane. Therefore, the average responses (n = 5) of these compounds were considered when validation parameters were calculated.
Linear range was investigated with increasing concentrations of the analytes at six different concentration levels from 0.03 to 10.0 g l-1. An acceptable linear range, with determination coefficients (r2) higher than 0.991, was obtained for all compounds. Table 1 also shows the validation data. No saturation effect of the fibre has been observed at the described concentration range.
The limits of detection (LODs) of the compounds which did not appear in the samples were defined as the concentrations giving a response corresponding to a signal-to-noise ratio 3:1. The LODs of the compounds found in the samples were estimated as the concentration which gave a signal average plus three times the standard deviation of the sample signal. LODs ranged from 0.003 g l-1 to 0.50 g l-1, being slightly lower than those found in the literature [14, 24,25] related to those which have been using other analytical methods were based on liquid-liquid extraction (LLE) followed by GC-MS, LLE followed by gas chromatography electron capture detection (GC-ECD) and headspace single drop microextraction (HS-SDME) prior to GC-MS. On the other hand, some papers have reported slightly lower LODs for the specific halonitriles group [13,21], due to using higher extraction volumes of samples and higher extraction times.
Limits of quantification (LOQs) were defined based on the concentrations giving a response corresponding to a signal-to-noise ratio 10:1 and they correspond to the lowest calibration level. LOQ ranged from 0.010 g l-1 up to 1.00
g l-1.
The precision of the method was evaluated by spiking replicates of a sample at 1g l-1 level. Repeatability and reproducibility between days were calculated as the percentage of the relative standard deviation (RSD) and were mostly lower than 13% and 18% respectively (n = 5).
In order to evaluate the accuracy, the different water samples were also spiked at two different concentration levels (0.5 g l-1 and 5g l-1) to check the recovery. For
these two levels, the calculated concentrations of the target DBPs were in agreement with those obtained with the water used for the validation, taking into account the repeatability of the method used. Quantification of the samples was performed by external calibration using the calibration curves obtained by spiking the standards in reverse osmosis effluent of brackish water. Exceptionally, waste water samples presented matrix effect and were quantified with the matrix match calibration curve. Method validation parameters of waste water samples, as the LODs are also shown in the Table 1 while the linear range, the repeatability and reproducibility between days were similar to the brackish water effluents.
Application of the Method
By the proposed method, a total of 14 of the 20 disinfection by-products were detected and quantified in the different analyzed samples. Due to the previous chlorination by the distributors in the sea and brackish water lines, the concentration of the compounds found in the influents of the application research unit of brackish water and seawater samples were higher than those found in the influents of application research units of waste water. In both water application research units, the level of total THMs in the influent is higher than 100 μg l-1, which is the maximum concentration regulated in Europe for drinking water applications. However, after the reverse osmosis processes, the concentration of the total THMs decreases below the limit, which is indicating that RO is decreasing them.
Table 2 shows the concentration of the DBPs found in all studied samples, influents and effluents of the studied application research units having a tertiary treatment with RO membranes. Dibromoacetonitrile, bromonitromethane,
triiodomethane, 1-iodo-2-methylpropane,
2-chloro-2-nitropropane and 1,2-dibromo-3-chloropropane did not appear in the table because their concentration was lower than the limit of detection in all analyzed samples. On the other hand, trichloromethane, bromodichloromethane, dibromochloromethane, tribromomethane and tribromo-acetaldehyde were giving signals out of the calibration curve, showing an estimated concentration.
found belong to different families: trihalomethanes, haloacetonitriles, and iodine, chlorine and bromine disinfection by-products. It is worth mention that the THMs group, which is the regulated one, the concentration was 95% lower than the regulated.
In the sea water application research unit, the DBPs found were from same families as those found in the waste water. 9 DBPs have been found in the influent of the application research unit of sea water with higher concentrations than in waste water secondary effluents, mainly because of the chlorine addition to the distribution
lines from the supplier. Tribromomethane and
tribromoacetaldehyde exceeded the linear range, indicating an estimated concentration. However, their concentration is lower in the effluent of the RO demonstrating reverse osmosis could decrease their level.
In the brackish water application research unit, the seven families of the DBPs studied were found including the
halonitromethanes and the haloketones. 14 DBPs have been found in the influent. Concentrations of trichloromethane,
bromodichloromethane and dibromochloromethane
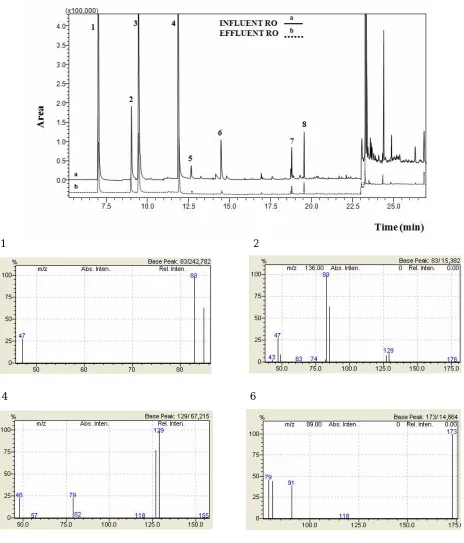
exceeded the linear range, being detected at concentrations higher than 40 μg l-1. Figure 4 shows a chromatogram of two samples of the application research unit of reverse osmosis membranes treating brackish water, one of them is from the influent of RO and the other belongs to the effluent of RO. As expected, the influent sample contained higher concentration than the effluent sample and it was observed that the majority of the compounds were reduced more than the 70% by the RO membrane treatments due to the capacity of these advance tertiary treatments to eliminate organic compounds. These results also confirmed those reported in some other papers [22-23].
As a general trend, it seemed the majority of the disinfection by-products were removed by using reverse osmosis membrane treatments. There are few references Table 2. Concentrations of the DBPs Found in Different Water Application Research Units Treating Different Types of Water, Expressed in g l-1 (n = 5; RSD < 15%)
Sea Water Waste Water Brackish Water
Compound Family Influent RO Effluent RO Influent RO Effluent RO Influent RO
Effluent
RO
Trichloromethane 0.36 0.066 4.95 2.50 59* 33*
Methane, bromodichloro- 0.72 0.34 <LOQ <LOQ 77* 38*
Methane, dibromochloro- 5.5 1.55 <LOQ <LOQ 40* 15.9*
Methane, tribromo- 95* 16.3* <LOQ <LOQ 4.2 1.18
Regulated Total THMs THMs 102 18.3 4.95 2.5 176 88
Acetonitrile, trichloro- n.d. n.d. n.d. n.d. <loq n.d.
Acetonitrile, dichloro- 0.23 n.d. 0.095 0.090 2.07 0.59
Acetonitrile, bromochloro- HANs n.d. n.d. n.d. n.d. 2.49 0.59
Trichloronitromethane HNMs n.d. n.d. n.d. n.d. 0.12 n.d.
2-Propanone, 1,1-dichloro- n.d. n.d. n.d. n.d. 0.52 n.d.
2-Propanone, 1,1,1-trichloro- HKs n.d. n.d. n.d. n.d. 0.37 n.d.
Chloroiodomethane I-DBPs 1.44 1.06 0.077 0.076 0.20 0.18
Propane, 2-chloro-2-methyl- Cl-DBPs 0.11 0.11 <LOQ <LOQ 0.11 0.11
Propane, 2-bromo-2-methyl- 0.18 <LOQ <LOQ <LOQ <LOQ <LOQ
Acetaldehyde, tribromo- Br-DBPs 59* 8.3 n.d. n.d. 11.8 n.d.
Fig. 4. GC-MS Chromatograms of influent and effluent samples belonging to the brackish water application research unit. Peak numbers refer to (1) trichloromethane, (2) bromodichloromethane, (3) dichloro-
acetonitrile, (4) dibromochloromethane, (5) bromochloroacetonitrile, (6) tribromomethane, (7) tribromoacetaldehyde, (8) 1,2-dibromo-3-chloro-propane. Inserts show the spectra of the regulated DBPs present in the effluent (1, 2, 4, 6).
1 2
focused on the determination of DBPs during advanced
membrane treatments [2,9,22,23]. Some of those
specifically applied to drinking water applications in which the concentrations of the DBPs are in agreement with our current methodology.
CONCLUSIONS
In the present study, headspace solid phase microextraction with a PDMS/DVB/CAR fibre combined with gas chromatography-mass spectrometry was used to determine simultaneously 20 disinfection by-products in water including trihalomethanes, haloacetonitriles, halonitro-methanes, haloketones and other iodine, chlorine and bromine DBPs.
The method developed is sensible, shows good linear range, reproducibility, repeatability and low detection limits (at low ng l-1 levels). The validated method has been used for the determination of the target organic DBPs in aqueous samples belonging to influents and effluents of membrane treatments (sea water, waste water and brackish water) from different application research units. The results indicated the proposed method could be used to analyze the 20 DBPs in water samples, which does not use solvent and allows characterization of a large variety of compounds simultaneously, showing a good performance.
Some DBPs were found in the samples, due to the fact that sea water and brackish water is constantly being chlorinated for pipe disinfection by the suppliers. The tendency of most of them indicates a trend of removal by reverse osmosis treatments.
ACKNOWLEDGMENTS
The authors wish to acknowledge the financial support provided to this study by the Dirección General de Investigación of the Spanish Ministry of Science and Innovation and the Direcció General de Recerca of the Government of Catalonia through the projects ITACA-INNPRONTA IPT-20111020.
They also wish to thank the personnel of the Dow Water and Process Solutions in Tarragona, for their cooperation in all aspects of this study.
REFERENCES
[1] V. Gómez, K. Majamaa, E. Pocurull, F. Borrull, Water Sci. Technol. 66 (2012) 61.
[2] B. Lyon, A. Dotson, K. Linden, H. Weinberg, Water
Res. 45 (2012) 4653.
[3] C. Bellona, J.E. Drewes, P. Xu, G. Amy, Water Res.
38 (2004) 2795.
[4] X. Yang, C. Shang, J.C. Huang, Water Res. 39 (2005) 4755.
[5] R.J. Miltner, T.F. Speth, S.D. Richardson, S.W. Krasner, H.S. Weinberg, J.E. Simmons, J. Toxicol. Environ. Health A 71 (2008) 1133.
[6] S.W. Krasner, H.S. Weinberg, S.D. Richardson, S.J. Pastor, R. Chinn, M.J. Sclimenti, G.D. Onstad, A.D. Thurston, Environ. Sci. Technol. 40 (2006) 7175. [7] J.C. Pressman, S.D. Richardson, T.F. Speth, R.J.
Miltner, M.G. Narotsky, Hunter, G.E. Rice, L.K. Teuschler, T.A. McDonald, Environ. Sci. Technol. 44 (2010) 7184.
[8] E. Gasia-Bruch, P. Sehn, V. García-Molina, M. Busch, O. Raize, M. Negrin, Desal and Water Treat. 31 (2011) 178.
[9] V. Uyak, I. Koyuncu, I. Oktem, I. Toroz, J. Hazard Mater. 152 (2008) 789.
[10] M. Villanueva, K.P. Cantor, J.O. Grimalt, N. Malats, D. Silverman, A. Tardon, R. Garcia-Closas, C. Serra, A. Carrato, G. Castaño-Vinyals, R. Marcos, N. Rothman, X. Real, M. Dosemeci, M. Kogevinas, J. Epidemiol. 165 (2007) 148.
[11] U.S. Environmental Protection Agency. National Primary Drinking Water Regurations: Statge 2 Disinfectants and Disinfection Byproducts Rule. Fed. Reg. 71 (2006) 387.
[12] (REAL dectreto 1400/2003) (DIRECTIVE
2008/105/EC OF THE EUROPEAN PARLIAMENT AND OF THE COUNCIL of 16 December 2008. (http://eurlex.europa.eu/, accessed 3th April 2012). [13] I. Kristiana, C. Joll, A. Heitz, J. Chromatogr. A 1225
(2012) 45.
[14] I. Montesinos, M.J. Cardador, M. Gallego, J. Chromatogr. A 1218 (2011) 2497.
1218 (2011) 8295.
[16] K. Cantor, C.R. Lynch, M.E. Hildesheim, M.
Dosemeci, J. Lubin, M. Alavanja, G. Craun, J. Epidemiol. 9 (1998) 21.
[17] J.C. Loper, D.R. Lang, R.S. Schoeny, B.B.
Richmond, P.M. Gallagher, C.C. Smith, Toxicol. Environ. Health 4 (1978) 919.
[18] P. Gostelow, S.A. Parsons, R.M. Stuetz, Water Res. 35 (2001) 579.
[19] Z. Mester, R. Sturgeon, J. Pawliszyn,
Spectrochimica. Acta Part B 56 (2001) 233.
[20] B.K. Koudjonou, G.L. Lebel, Chemosphere 64
(2006) 795.
[21] C.V. Antoniou, E.E. Koukouraki, E. Diamadopoulos,
J. Chromatogr. A 1132 (2006) 310.
[22] C. Martínez, N. Ramírez, V. Gómez, E. Pocurull, F. Borrull, Talanta 116 (2013) 937.
[23] N. Sadao, D. Shigeki, Anal. Chim. Acta 548 (2005) 79.
[24] D. Liew, K.L. Linge, C.A. Joll, A. Heith, J.W.A. Charrois, J. Chromatogr. A 1241 (2012) 117.