An Enrichment Method for Mapping
Ambiguous Reads to the Reference Genome for
NGS Analysis
Yuan Liu
1,2, *, Yongchao Ma
1,*, Evan Salsman
2, Frank A. Manthey
2, Elias
M. Elias
2, Xuehui Li
2, and Changhui Yan
1,†1 Department of Computer Science, North Dakota State University, Fargo, ND, 58102, U.S., 2 Department of Plant Sciences, North Dakota State University, Fargo, ND, 58102, U.S.
Abstract
Mapping short reads to a reference genome is an essential step in many next-generation sequencing (NGS) analysis. In plants with large genomes, a large fraction of the reads can align to multiple locations of the genome with equally good alignment scores. How to map these ambiguous reads to the genome is a challenging problem with big impacts in the downstream analysis. Traditionally, the default method is to assign an ambiguous read randomly to one of the many potential locations. In this study, we explore an enrichment method that assigns an ambiguous read to the location that has produced the most reads among all the potential locations. Our results show that the enrichment method produced better results than the default random method in the discovery of single nucleotide polymorphisms (SNPs). Not only did it produce more SNP markers, but it also produced markers with better quality, which was demonstrated by higher trait-marker correlation in genome-wide association studies (GWAS).
1
Introduction
Next-generation sequencing (NGS) technologies enable researchers to conduct high-throughput DNA sequencing with low costs (Nielsen et al., 2011). NGS has been widely used in various applications, such as whole-transcriptome sequencing (RNA-seq), chromatin immunoprecipitation followed by sequencing (ChIP-seq) and methylated DNA sequencing (methyl-seq) (Treangen and Salzberg, 2012). NGS is very important for the discovery of single nucleotide polymorphisms (SNPs) (Metzker, 2010), which is the fundamental and most abundant genetic variation (Kaur et al., 2012).
Volume 60, 2019, Pages 48–54
NGS provides efficient methods to discover large-scale SNPs to support high-density linkage map construction, genome-wide association studies (GWAS) and genomic selection in plants (Kaur et al., 2012). Genotyping-by-sequencing (GBS) is a widely used SNPs discovery method, in which restriction enzymes are used to cut genome into fragments and then sequencing is performed using NGS technologies (Poland and Rife, 2012). In most applications of GBS, sequencing reads are aligned to a reference genome and genotypes are assigned to individuals based on the alignment. Thousands of SNP markers have been revealed by GBS in many species, including maize, wheat, barley, rice, potato and cassava (He et al., 2014).
The alignment of short reads to the reference genome is a key step in various NGS analyses (Mielczarek and Szyda, 2016). Many programs have been developed for this task, such as Bowtie2 (Langmead and Salzberg, 2012), BWA (Li and Durbin, 2009), SOAP2 (Li et al., 2009) and Stampy (Lunter and Goodson, 2011). These alignment algorithms are either based on hashing or Burrow-Wheeler transform. For plants with large genomes, mapping short reads to the reference genome is very challenging. Due to polyploidy and numerous repetitive sequences in the genome, many reads can align to multiple locations with equally good alignment score and quality. Simply discarding these ambiguous reads will be a waste of valuable resources and result in low coverage, which will in turn cause problems in the downstream analysis. Existing aligners like Bowtie2 resolve ambiguity by randomly reporting one of the best hits. Given the large amount of ambiguous reads, wrongly mapping them to sites other than their true locations will result in significant errors in the subsequent SNP calling and genotyping. This issue becomes even more severe when the coverage level is low.
Here, we propose an innovative method to map ambiguous reads to the reference genome. When a read can be mapped to multiple locations with equal scores, for each of the potential hits this method counts the number of reads mapped to the neighborhood of the hit, and choses the hit that has the most reads in its neighborhood. Due to experimental and instrumental biases, different regions of the genome have different levels of coverage during sequencing. When a read can be mapped to multiple locations, we presume that the read more likely belongs to a region that has generated more reads. We evaluated our approach using GBS data from durum wheat and compared it with the default method that randomly picked a hit. The results show that our approach was able to identify more SNP markers that had higher association levels with various traits in GWAS.
2
Materials And Methods
2.1
Plant Materials, Phenotyping And GBS Library Construction
2.2
Methods To Handle Ambiguous Mapping
In Bowtie2, minimal alignment score threshold was set to -12, with mismatch penalty -6, and gap opening penalty -5 and extension penalty -3. We compared two different ways to handle ambiguous mapping. In the random mode, Bowtie2 randomly selected a hit when there were multiple hits that satisfied the alignment criteria. This is the default mode in Bowtie2. In the enrichment mode, when there were multiple hits for a read, we considered at most 20 hits to reduce computational time. For each of the hits, we looked at an interval of 1000 bp centered at the hit location and counted the total number of reads mapped to that interval. Then, the hit with most reads in its interval was chosen.
2.3
SNPs Discovery And Genotyping
SNPs discovery and genotype calling were conducted using TASSEL-GBS pipeline (Glaubitz et al., 2014) with Triticum aestivum IGWSC RefSeq v1.0 as reference genome. Reads with quality score less than 20 were discarded. Barcode of raw reads was trimmed off, and 80-bp sequences were retained. Reads with identical sequence were collapsed into one unique tag for reducing computational time. Unique tags with at least 10 count of reads were mapped to the reference genome using Bowtie2. Default criteria of SNP discovery in TASSEL were used, specifically, locus coverage > 0.1, minor allele frequency > 0.01. Genotype calling was conducted based on the results from SNP discovery. Markers with less than 50% missing values were retained for GWAS.
2.4
Genome-Wide Association Studies (GWAS)
GWAS was conducted for each trait using SNP markers obtained from the previous step using TASSEL V.5 (Bradbury et al., 2007). The linear mixed model including population structure and kinship matrix (PK model) was used. The false discovery rate (FDR) was calculated from p-values using the p.adjust function in R package (Benjamini and Hochberg, 1995). For markers and trait association analysis, the significant threshold was determined by FDR with q value less than 0.01.
3
Results
3.1
Reads Alignment
The sequencing produced an average of 1.8 million reads per line, ranging from 0.6 to 4.9 million. A total of 2,440,550 unique tags were produced after trimming off barcode adaptor and collapsing identical reads. When Bowtie2 was used to aligned them to the reference genome (Triticum aestivum IGWSC RefSeq v1.0), 759,204 tags (31% of the total) were unmapped, 796,213 (33% of the total) were uniquely mapped, meaning each tag was mapped to only one location, and 885,133 (36% of the total) were ambiguously mapped, meaning each tag could map to more than one location. When the enrichment mode was used, 778,882 (that is, 88.0%) of the ambiguous tags were mapped to locations different than when the random mode was used.
3.2
SNP Markers Discovery
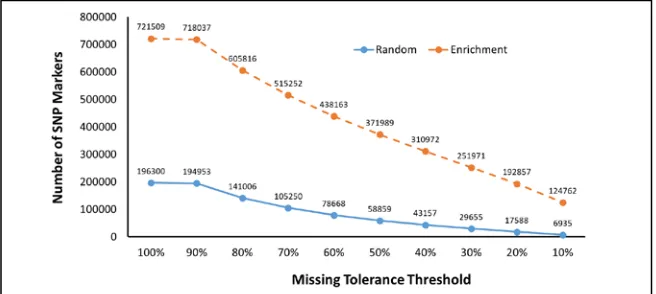
stringent criteria. Fig. 1 shows that as the missing tolerance threshold decreases, more and more SNP markers are filtered out. Over the whole range, the enrichment mode was able to discover substantially more SNP markers than the random mode. When 10% missing tolerance threshold was used, the enrichment mode discovered 124,762 markers, resulting in an 18-fold increase comparing with the 6,935 markers discovered by the random mode.
3.3
Genome-wide Association Studies (GWAS)
In an effort to evaluate the quality of the SNP markers discovered in the previous step, we used them to conduct GWAS for five traits, including test weight (TW), semolina extraction rate (SER), semolina protein content (SPC), semolina color (SC), and sedimentation volume (SV). For this purpose, we used 50% as the missing tolerance threshold to filter the SNPs. Under this threshold, 371,989 and 58,859 SNP markers were discovered by the enrichment mode and random mode, respectively. There was an overlap of 32,419 between the SNPs discovered by the two modes. Marker-trait association with q value less than 0.01 was considered significant association. Table 1 shows the results. No significant association was observed between the SNPs and semolina protein content (SPC) under both alignment modes. For all other traits, the enrichment mode was able to discover more SNP markers associated with the traits than the random mode did. Moreover, the SNP markers discovered by the enrichment mode had stronger correlation (i.e. with lower q values) with the traits. For example, the random mode did not discover any SNP markers correlated with trait SER, while the enrichment mode found 44. The random mode only found 5 SNP markers associated with trait TW, with the best SNP marker having q value of 5.30×10⁻³. In comparison, the enrichment mode discovered 377 SNP markers, with the best
marker having q value of 9.70×10⁻⁵.
These results indicate that the enrichment mode was better than the random mode in SNP discovery. Not only did it discover more SNP markers, but it also discovered better markers that were more strongly associated with the traits.
Table 1 Genome-wide association studies (GWAS) between SNP Markers and five traits: semolina color (SC), semolina extraction rate (SER), sedimentation volume (SV), semolina protein content (SPC), and test weight (TW).
Trait
s Alignment mode
Number of markers with significant correlation
Best q value of the markers
SC Random 111 4.44×10⁻¹¹
Enrichment 197 1.06×10⁻¹³
SER Random 0 NA
Enrichment 44 1.06×10⁻¹³
SV Random 131 3.41×10⁻¹⁴
Enrichment 267 5.81×10⁻²³
SPC Random 0 NA
Enrichment 0 NA
TW Random 5 5.30×10⁻³
Enrichment 377 9.70×10⁻⁵
4
Discussion
The alignment of short reads to the reference genome is a critical step in many NGS analyses. In plants with large genomes, a large fraction of the reads can be aligned to multiple locations with equally good scores. How to assign these ambiguous reads to genome locations is a challenging problem that have great impacts in the downstream analyses. Up to date, the default way to handle these ambiguous reads is to assign them randomly to one of the many potential locations. In this study, we explore an enrichment method to map ambiguous reads to the genome. When a read can align to multiple locations with equal score, we evaluate the possibility of the read being generated by each of these regions. Due to experimental and instrumental biases, different regions of the genome may have different levels of coverage during sequencing. The possibility of a read being generated by a region is approximately proportional to the total amount of reads that the region has produced. Based on this principle, the enrichment method assigns an ambiguous read to a region that has produced the most reads among all potential regions. In this study, for each of the hit location, we looked at an interval of 1000 bp. This interval size was picked arbitrarily for the sake of simplicity. Ideally, the interval size should be chosen based on the cutting sites of the restriction enzymes, the length of the reads, and sequencing depth. A thorough evaluation of this parameter is beyond the scope of this paper.
GBS often suffers from a high amount of missing data (Poland and Rife, 2012). Too much missing data will reduce the quality of the discovered SNPs. Therefore, in practical study, researchers often use a stringent criterion (that is, lower missing tolerance threshold) to remove SNPs that have too much missing data. However, this will significantly reduce the number of SNP markers. Results from Fig. 1 confirm that as the missing tolerance threshold decreases, the number of SNPs decreases rapidly. However, when we compared the SNPs decreasing rates of the two alignment modes, we can find that the enrichment mode decrease at a slower pace. For example, when the missing tolerance threshold decreased from 100% to 50%, 70% of the total markers were removed (that is, the number of SNP markers reduced from 196,300 to only 58,859). In comparison, only 48.5% of the total markers were discarded in the enrichment mode over the same interval (that is, a decrease from 721,509 to 371,989). When missing tolerance threshold decreased to 10%, the random mode has lost 96.5% of the markers (i.e. a decrease from 196,300 to 6,935), while the enrichment mode only lost 82.7% (i.e. a decrease from 721,509 to 124,762). Therefore, the enrichment mode not only discovered more SNP markers than the random mode, it also produce higher fraction of markers that has less missing data. This will in turn help improve the quality of the discovered SNP markers.
References
Benjamini,Y. and Hochberg,Y. (1995) Controlling the False Discovery Rate: A Practical and Powerful Approach to Multiple Testing. J. R. Stat. Soc. Ser. B Methodol., 57, 289–300.
Bradbury,P.J. et al. (2007) TASSEL: software for association mapping of complex traits in diverse samples. Bioinformatics, 23, 2633–2635.
Brown,N.L. and Smith,M. (1977) Cleavage specificity of the restriction endonuclease isolated from Haemophilus gallinarum (Hga I). Proc. Natl. Acad. Sci., 74, 3213–3216.
Fiedler,J.D. et al. (2017) Genome-Wide Association and Prediction of Grain and Semolina Quality Traits in Durum Wheat Breeding Populations. Plant Genome, 10, 0.
Forsblom, sven et al. (1977) Kinetic studies on the cleavage of adenovirus DNA by restriction endonuclease Eco Rl. Nucleic Acids Res., 3, 3255–3270.
Gingeras,T.R. and Brooks,J.E. (1983) Cloned restriction/modification system from Pseudomonas aeruginosa. Proc. Natl. Acad. Sci., 80, 402–406.
Glaubitz,J.C. et al. (2014) TASSEL-GBS: A High Capacity Genotyping by Sequencing Analysis Pipeline. PLoS ONE, 9, e90346.
He,J. et al. (2014) Genotyping-by-sequencing (GBS), an ultimate marker-assisted selection (MAS) tool to accelerate plant breeding. Front. Plant Sci., 5.
Kaur,S. et al. (2012) Identification, characterization and interpretation of single-nucleotide sequence variation in allopolyploid crop species: Sequence variation in allopolyploids. Plant Biotechnol. J., 10, 125–138.
Langmead,B. and Salzberg,S.L. (2012) Fast gapped-read alignment with Bowtie 2. Nat. Methods, 9, 357–359.
Li,H. and Durbin,R. (2009) Fast and accurate short read alignment with Burrows-Wheeler transform. Bioinformatics, 25, 1754–1760.
Li,R. et al. (2009) SOAP2: an improved ultrafast tool for short read alignment. Bioidnformatics, 25, 1966–1967.
Lunter,G. and Goodson,M. (2011) Stampy: A statistical algorithm for sensitive and fast mapping of Illumina sequence reads. Genome Res., 21, 936–939.
Nielsen,R. et al. (2011) Genotype and SNP calling from next-generation sequencing data. Nat. Rev. Genet., 12, 443–451.
Poland,J.A. and Rife,T.W. (2012) Genotyping-by-Sequencing for Plant Breeding and Genetics. Plant Genome J., 5, 92.