Ames Laboratory Publications
Ames Laboratory
2006
Versatile and compact capacitive dilatometer
G. M. Schmiedeshoff
Occidental CollegeA. W. Lounsbury
Occidental CollegeD. J. Luna
Occidental CollegeS. J. Tracy
Occidental CollegeA. J. Schramm
Occidental CollegeSee next page for additional authors
Follow this and additional works at:
http://lib.dr.iastate.edu/ameslab_pubs
Part of the
Condensed Matter Physics Commons
The complete bibliographic information for this item can be found at
http://lib.dr.iastate.edu/
ameslab_pubs/213
. For information on how to cite this item, please visit
http://lib.dr.iastate.edu/
howtocite.html
.
Versatile and compact capacitive dilatometer
Abstract
We describe the design, construction, calibration, and operation of a relatively simple differential capacitive
dilatometer suitable for measurements of thermal expansion and magnetostriction from 300 to below 1K with
a low-temperature resolution of about 0.05Å. The design is characterized by an open architecture permitting
measurements on small samples with a variety of shapes. Dilatometers of this design have operated
successfully with a commercial physical property measurement system, with several types of cryogenic
refrigeration systems, in vacuum, in helium exchange gas, and while immersed in liquid
helium(magnetostriction only) to temperatures of 30mK and in magnetic fields to 45T.
Keywords
Physics and Astronomy, Capacitors, Capacitance, Copper, Thermal expansion, Magnetostriction
Disciplines
Condensed Matter Physics
Comments
The following article appeared in
Review of Scientific Instruments
77 (2006): 123907 and may be found at
http://dx.doi.org/10.1063/1.2403088
.
Authors
G. M. Schmiedeshoff, A. W. Lounsbury, D. J. Luna, S. J. Tracy, A. J. Schramm, S. W. Tozer, V. F. Correa, S. T.
Hannahs, T. P. Murphy, E. C. Palm, A. H. Lacerda, Sergey L. Bud'ko, Paul C. Canfield, J. L. Smith, J. C.
Lashley, and J. C. Cooley
Versatile and compact capacitive dilatometer
G. M. Schmiedeshoff, A. W. Lounsbury, D. J. Luna, S. J. Tracy, A. J. Schramm, S. W. Tozer, V. F. Correa, S. T.
Hannahs, T. P. Murphy, E. C. Palm, A. H. Lacerda, S. L. Bud’ko, P. C. Canfield, J. L. Smith, J. C. Lashley, and
J. C. Cooley
Citation: Review of Scientific Instruments 77, 123907 (2006); doi: 10.1063/1.2403088
View online: http://dx.doi.org/10.1063/1.2403088
View Table of Contents: http://scitation.aip.org/content/aip/journal/rsi/77/12?ver=pdfcov
Published by the AIP Publishing
Articles you may be interested in
A compact and miniaturized high resolution capacitance dilatometer for measuring thermal expansion and magnetostriction
Rev. Sci. Instrum. 83, 095102 (2012); 10.1063/1.4748864
High resolution miniature dilatometer based on an atomic force microscope piezocantilever Rev. Sci. Instrum. 80, 116101 (2009); 10.1063/1.3258143
Three terminal capacitance technique for magnetostriction and thermal expansion measurements Rev. Sci. Instrum. 75, 2192 (2004); 10.1063/1.1753088
Development of a dilatometer based on diffractometry Rev. Sci. Instrum. 73, 3271 (2002); 10.1063/1.1497504
A miniature capacitance dilatometer for thermal expansion and magnetostriction Rev. Sci. Instrum. 69, 2742 (1998); 10.1063/1.1149009
Versatile and compact capacitive dilatometer
G. M. Schmiedeshoff, A. W. Lounsbury, D. J. Luna, S. J. Tracy, and A. J. Schramm
Department of Physics, Occidental College, Los Angeles, California 90041
S. W. Tozer, V. F. Correa,a兲S. T. Hannahs, T. P. Murphy, E. C. Palm, and A. H. Lacerda
National High Magnetic Field Laboratory, Florida State University, Tallahassee, Florida 32310
S. L. Bud’ko and P. C. Canfield
Ames Laboratory, Iowa State University, Ames, Iowa 50011 and Department of Physics and Astronomy, Iowa State University, Ames, Iowa 50011
J. L. Smith, J. C. Lashley, and J. C. Cooley
Los Alamos National Laboratory, Los Alamos, New Mexico 87545
共Received 14 October 2006; accepted 4 November 2006; published online 28 December 2006兲 We describe the design, construction, calibration, and operation of a relatively simple differential capacitive dilatometer suitable for measurements of thermal expansion and magnetostriction from 300 to below 1 K with a low-temperature resolution of about 0.05 Å. The design is characterized by an open architecture permitting measurements on small samples with a variety of shapes. Dilatometers of this design have operated successfully with a commercial physical property measurement system, with several types of cryogenic refrigeration systems, in vacuum, in helium exchange gas, and while immersed in liquid helium 共magnetostriction only兲 to temperatures of 30 mK and in magnetic fields to 45 T. © 2006 American Institute of Physics.
关DOI:10.1063/1.2403088兴
INTRODUCTION
It would be difficult to overstate the importance of ther-mal expansion measurements to the study of solids. The in-timate relationship between thermal expansion and specific heat first explored by Grüneisen1has blossomed into a com-prehensive theoretical structure2while the characterization of phase transitions using Ehrenfest and Maxwell relations helps coordinate our understanding of the many interesting states exhibited by novel materials. First-generation samples of such materials are frequently millimeter sized or smaller. The intense interest in studying these samples at low tem-peratures 共where the thermal expansion can also be small兲 calls for dilation measurements with subangstrom resolution. Such small length changes represent a significant challenge for the experimentalist. Smith who likes to say that “experi-ments are either easier than they should be or harder than they should be” suggests the de Haas–van Alphen effect and specific heat as examples of the former and latter categories. In this article we describe a relatively simple differential ca-pacitive dilatometer which we hope will contribute to the movement of the dilation measurements underlying thermal expansion 共and magnetostriction兲 from the latter to the former category.
In a capacitive dilatometer the dilation⌬Lof a sample of lengthL manifests as a change in the gapDbetween a pair of capacitor plates. For an ideal parallel-plate capacitive dilatometer in vacuum the relationship between the measured capacitanceC andDis simply
C= ⑀oA
D , 共1兲
where ⑀o= 8.854 19 pF/ m is the permittivity of free space
andA is the area of the capacitor plates. Central issues for the researcher include corrections to this simple relationship, the appropriate value of A, the temperature and magnetic field dependences of the dilatometer, and any necessary cor-rections associated with the environment surrounding the dilatometer共liquid helium, for example兲. Measurements with respect to temperatureTyield either the thermal expansivity
⑀=关L共T兲−L共0兲兴/L共0兲or the coefficient of linear thermal ex-pansion ␣=d⑀/dT=共1 /L兲dL/dT=d共lnL兲/dT whereas iso-thermal measurements with respect to magnetic fields H
yield the linear magnetostriction=关L共H兲−L共0兲兴/L共0兲. Researchers considering a capacitive dilatometer design should consult the papers by Pott and Schefzyk,3Swenson,4 and Rotter et al.5 for recent discussions of the history and capabilities of this approach to dilatometry and for details of capacitive dilatometer design共both in the papers themselves and the extensive references therein兲. The principle differ-ence between our design and those described in the refer-ences above is in the open architecture of the sample mount-ing arrangement which permits a wide range of sample shapes and sizes as well as the ability to observe and共to a limited degree兲 adjust the orientation of the sample in the dilatometer.
In the following sections we discuss the design and con-struction of the dilatometer, details of its calibration and op-eration, the corrections we do共and do not兲apply to our data, and some measurements on polycrystalline aluminum and nickel samples. Unless otherwise noted, all experimental
re-a兲Present address: Comisión Nacional de Energía Atómica, Centro Atómico Bariloche, 8400 S. C. de Bariloche, Argentina.
REVIEW OF SCIENTIFIC INSTRUMENTS77, 123907共2006兲
0034-6748/2006/77共12兲/123907/8/$23.00 77, 123907-1 © 2006 American Institute of Physics
sults presented in this article were determined using a copper dilatometer mounted, in vacuum, on the cold finger of a3He refrigerator. The capacitance was measured with a digital, self-balancing, three terminal, commercial capacitance bridge6 operating at 1 kHz whose 10−7pF resolution corre-sponds to a dilation limit of about 0.003 Å when our dilatometer is operating near 18 pF. The temperature was determined using commercial resistive thermometers with the manufacturers calibration.7,8
THE DILATOMETER
We constructed our dilatometer of oxygen-free high-conductivity 共OFHC兲 copper because of its high thermal conductivity, machinability, relative insensitivity to high magnetic fields, and well known thermal expansion charac-teristics.共A titanium dilatometer of the same general design has been constructed for use in very high magnetic fields, and we know of no reason why other materials could not be used instead.兲All copper parts were cleaned with dilute nitric acid 共5%–10% by volume in tap water兲 and annealed at 300 ° C for about 3 h at a pressure of about 6 Pa 共using a rotary pump兲 to reduce internal strains from the machining process.
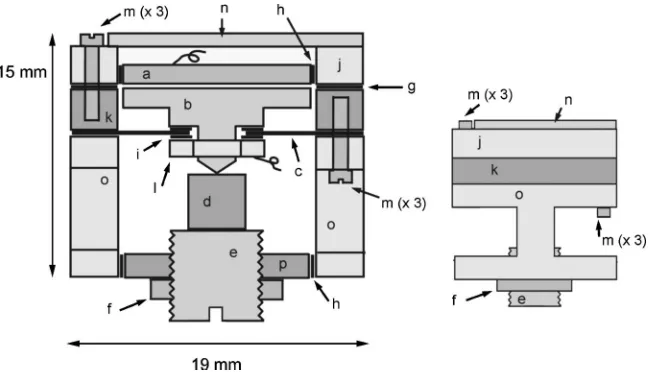
A schematic of the dilatometer is shown in Fig. 1; the left panel shows a front “cut-away” view of the dilatometer in which its components are identified, and the right panel represents the dilatometer viewed from the side.
Assembly procedure
We discuss the individual parts in the context of their assembly. While the order of assembly described below need not be rigorously followed some steps must preceed or fol-low others as noted in the text. All part designations refer to Fig.1.
共1兲 We soldered short Manganin wires共represented by the curled lines in Fig.1兲to the upper capacitor plateaand nut l to act as electrical contact points for the center conductors of slender, flexible coaxial cables for connec-tion to the capacitance bridge. We used 60–40 lead-tin solder with Manganin wire about 1 cm in length and
0.6 mm in diameter. The soldering of parta must pre-ceed its attachment to the upper guard ring j as de-scribed in the following step.
共2兲 The upper capacitor plate a is attached to the upper guard ring j with Stycast 2850FT after a thin strip of 25m thick Kapton is slipped into the gap between them. During the gluing process, partsaandjare placed on a flat glass plate to ensure that their lower surfaces remain coplanar. Following Swenson,9the Stycast is al-lowed to cure for 24 h at room temperature folal-lowed by 24 h at about 90 ° C. The curing process is followed by a light sanding of the lower surfaces of partsaand jto ensure that they remain coplanar.
共3兲 The lower flangepis attached to the main flangeousing Stycast 2850FT and a thin Kapton strip in a similar fash-ion to the previous step.
共4兲 The springc, made of 0.13 mm thick Be–Cu, is bolted to the lower capacitor platebbetween two 25m thick Kapton washers using the nutl. An aluminum jig is used to hold the spring and lower capacitor plate concentric during this operation. Three small holes 共not shown兲 penetrate the spring to ventilate the capacitor gap. We used unannealed commercial “Alloy 25” 共or C17200兲; the magnetic susceptibility of this material is somewhat higher than other Be–Cu alloys but the temperature de-pendence of the susceptibility is smaller.10
共5兲 The spring c is positioned between the main flange o
and lower guard ringkas shown in Fig.1; the assembly is bolted together with three “0–80” OHFC copper screws passing through the main flange and spring be-fore threading into the lower guard ring. The screws are evenly torqued to about 0.035 N m共5 in. OZ兲.
共6兲 An appropriate number of copper shimsgare positioned between the upper guard ringa and lower guard ringk
[image:5.612.52.377.49.235.2]as shown in Fig.1; the assembly is bolted together with three 0–80 copper screws passing through the upper guard ring and shims before threading into the lower guard ring. The screws are evenly torqued to about 0.035 N m. The number and thickness of the shims are chosen to give a “zero-force” capacitance 共the capaci-tance of the dilatometer with no force applied to the
FIG. 1. A schematic of the capacitive dilatometer. The left panel shows a front “cut-away” view identifying parts:共a兲upper共fixed兲capacitor plate,
共b兲 lower 共movable兲 capacitor plate,
共c兲 BeCu spring, 共d兲 sample, 共e兲 sample platform,共f兲lock ring,共g兲 cop-per shims,共h兲electrical isolation共 Sty-cast 2850 FT and Kapton兲,共i兲 electri-cal isolation 共Kapton washers兲, 共j兲 upper guard ring,共k兲lower guard ring,
共l兲nut,共m兲0-80 copper screws共six in total兲, 共n兲 mounting plate, 共o兲 main flange, and共p兲lower flange. The right panel represents a side view of the dilatometer.
123907-2 Schmiedeshoffet al. Rev. Sci. Instrum.77, 123907共2006兲
lower capacitor plate b兲 near 10– 13 pF, this value is discussed below.
共7兲 The center conductors of two coaxial cables, eventually leading to the capacitance bridge, are soldered to the two Manganin stubs on parts a and l. The shields of the coaxial cables, stripped back from the center conductors, are soldered to a small tab of copper foil; the foil is slipped between the upper guard ringjand the mounting platento ground the shields at the body of the dilatom-eter共this step may be modified depending upon the re-quirements of the capacitance bridge used兲. The connec-tion to the upper capacitor plateapasses through a small notch machined into the top of the upper guard ring j. The connection to the nut l passes through a series of concentric holes machined through the upper guard ring
j, the copper shimsg, the lower guard ringk, the spring
c, and the main flangeo. The mounting platenis bolted to the upper guard ringjwith three 0–80 copper screws.
共8兲 Finally, the sample and the sample platformeare posi-tioned appropriately共see discussion below兲and fixed in place with the lock ring f. We have three sample plat-forms with incrementally varying lengths to accommo-date different sample sizes in different dilatometer mounting orientations. Our longest sample platform can be secured in place by the lock ring while pushing the lower capacitor plate in far enough to close the gap共and short the capacitor兲. For the adjustments discussed be-low, it is helpful to use a very fine thread; we are cur-rently using 3.15 threads/ mm 共80 threads/ in.兲 but a finer thread would be even better.
The dilatometer may now be tested at room temperature either on the bench or after mounting on an experimental probe or refrigerator via a bolt circle in the mounting plate. The dilatometer can be mounted in any orientation depend-ing upon experimental requirements 共and has operated suc-cessfully in a cryostat designed to rotate itin situ兲.
Testing and calibration
Our task is to find an appropriate functional relationship between the capacitor gapD and the measured capacitance
C. Here we describe an approach that may be implemented with the dilatometer either mounted on a cold finger or clamped on a laboratory bench while using a sample plat-formelong enough to adjust the capacitor gap from its larg-est共zero-force兲to its smallest共shorted兲value.
For the calibration data presented below we bolted a dilatometer to a small sheet of aluminum which rested on a flat surface, in air, at room temperature and attached a pro-tractor共with an appropriately sized hole in its center兲to the main flangeo. The dilatometer was inverted with respect to its orientation in Fig.1. The sample platformeis then rotated
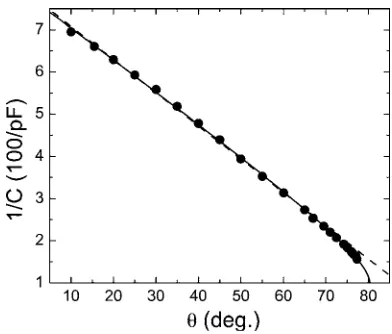
共tightened兲in small steps; after each step the angular position of the sample platform 共read off the protractor兲 and the capacitanceCare measured. The results plotted as 1 /Cvs are shown in Fig.2. The capacitor gapDis related to by
D=c1共M−兲, 共2兲
whereMis the angle at which the dilatometer shorts and the
constantc1is related to the thread pitch on the sample
plat-form. 共For our sample platform with 3.15 threads/ mm c1
= 882 nm/ deg兲. If the simple parallel plate capacitor model of Eq. 共1兲 holds then 共neglecting the dielectric constant of air兲
1
C= c1 ⑀oA
共M−兲. 共3兲
Thus, a plot of 1 /C vs should be a straight line whose slope yields the effective area of the capacitor plates共a tra-ditional means of incorporating the edge effects of the ca-pacitive geometry兲.
Typical calibration data and a linear fit to the data with 14 pF艋C艋43 pF are shown as the solid symbols and dashed line, respectively, in Fig. 2. The linear fit yields an effective capacitor area within 1% of the “bare” capacitor plate area measured directly before assembly Ao= 1.27
⫻10−4m2共the uncertainty inAoitself is also about 1%兲. The
uncertainty in the effective area calculated from the fit, in-corporating the uncertainties in the fit parameters andc1, is
less than 2%. This agreement is consistent with estimates of the edge effects expected for our capacitive geometry共two identical, circular capacitor plates separated by a small gap from a grounded, concentric shield兲based on exact solutions for a related geometry11 that can be adapted to ours, esti-mates suggesting that deviations fromAoshould be less than
1%. Additional corrections associated with the roughness and curvature of the capacitor plates are discussed by Swenson4and are deemed small enough to ignore.
[image:6.612.338.534.47.214.2]Note that at high capacitances the data in Fig.2 deviate from linearity. We believe that this is due to the fact that the capacitor plates are not perfectly parallel to each other. Pott and Schefzyk3found an expression for a tilted circular “par-allel” plate capacitor which Swenson4expresses as
FIG. 2. Typical dilatometer calibration data:represents the angular posi-tion of the sample platform as it is rotated共decreasing the capacitor gap and increasing the capacitance兲in small steps;Cis the capacitance after each step. The dashed line is a linear fit to the data with⬍90°. The solid line is a fit to the data incorporating the “tilt correction”共see text兲. Both lines are extrapolated beyond the fit range for clarity.
123907-3 Simple capacitive dilatometer Rev. Sci. Instrum.77, 123907共2006兲
D=⑀oA
C
冋
1 +冉
C Cmax冊
2
册
, 共4兲whereD represents the distance from the center of the flat capacitor plate to the center of the tilted plate andCmaxis the
capacitance just as the capacitor shorts, a quantity which can be estimated as part of the procedure described above. For the calibration data of Fig.2,Cmaxwas larger than 65 pF共our
bridge overloaded beyond this value, but the capacitor plates did not immediately short兲. Disassembling and reassembling the dilatometer, even with the same parts, can significantly affect the value of Cmax 共one dilatometer we are currently
using, for example, reached 105 pF before the bridge over-loaded兲.
All of the data shown in Fig. 2, expressed as =共C兲, can be fitted to a functional form found by equating Eq.共2兲
with Eq. 共4兲. If the effective area and Cmax are allowed to
vary in the fit we findCmax= 102 pF and an effective capaci-tor area 6% larger thanAo共larger than the 2% uncertainty in
the calculated effective area兲. This fit is represented by the solid line in Fig. 2. However, a fit to the data in which the effective area is fixed and equal to Ao yieldsCmax= 155 pF
which is not physically unreasonable共though the fit is not as good兲. For the data on aluminum described below we will useAo and Eq. 共1兲to convert our measured capacitances to
capacitor gaps. The agreement between our results and those in the literature, discussed in detail below, leads us to suspect that we may be accessing a lower bound onCmax with this
calibration procedure and analysis because, for the condi-tions under which the aluminum data were acquired, Eq.共4兲
requires Cmax= 180 pF for a 1% deviation in the effective
area. However, after carrying out this calibration procedure and estimatingCmax, one could simply choose a capacitance
for data acquisition such that Eq. 共4兲 yielded an effective area within 1% ofAo.
SAMPLE INSTALLATION AND DATA ACQUISITION
Generally speaking, to determine either the temperature dependent thermal expansion or the field dependent magne-tostriction of a sample, two sets of data are required: one with the sample installed in the dilatometer and one with a known reference material installed in the dilatometer共we use OFHC copper兲. An expression relating these two data sets to the thermal expansion of the sample can be derived assuming that the distance between the inner flat surface of the fixed capacitor plateaand the outer flat surface of the lower flange
pdepends upon temperature but is independent of the length or nature of the sample installed in the dilatometer. If the sample is of lengthLand the reference material is copper共or, more generally, the same material as the dilatometer兲, then one can show that
␣= 1
L dL dT= 1 L d
dT关Dc−Ds兴+␣Cu
冋
1 +Ds−Dc
L
册
, 共5兲whereDc is the capacitor gap when the copper standard is
mounted in the dilatometer,Dsis the gap when the sample is
mounted, and␣Cuis the thermal expansion of copper taken from the literature.12First note that this result is independent of the length of the standard material used 共which follows
from the standard being made of the same material as the dilatometer兲. Second, for our cell operating near 18 pF and a sample of lengthL= 1 mm,Ds/L⬃Dc/L⬃0.06 which may
not be small enough to ignore, but if the two capacitances remain near 18 pF and differ by 1 pF then 共Ds−Dc兲/L
⬃0.003 which may be small enough to ignore. If we drop the final term, Eq.共5兲can be expressed as
␣=1
L dL dT=
冏
1
L dL
dT
冏
cell+sample−冏
1
L dL
dT
冏
cell+Cu+␣Cu, 共6兲since dL= −dD. The first term on the right side of Eq. 共6兲
represents measurements with the sample installed in the dilatometer. The second term represents measurements with a copper standard installed in the dilatometer, this term is also known as the “cell effect.”
Although a conventional OFHC copper sample can be used as a standard, we use the sample platform itself by rotating it until its upper surface is pressed against the rounded point of the lower capacitor plate, and the platform is then fixed in position with the lock ring. We generally operate with the dilatometer set at about 5 pF greater than the zero-force capacitance共about 18 and 13 pF, respectively, for the dilatometer used for most of the data presented in this article兲.
If the sample has two appropriately positioned parallel faces it can be placed in the center of the sample platform which is then rotated until the sample is pressed against the rounded point of the lower capacitor plate as illustrated in Fig. 1. Once the sample platform is secured with the lock ring the sample may be gently rotated with tweezers. We have successfully mounted platelike samples with only a single flat edge by grasping the sample with tweezers, hold-ing the flat edge against the sample platform, and then rotat-ing the sample platform until the irregular upper surface of the sample is lodged against the rounded point of the lower capacitor plate.共This sample mounting scheme was devised to accommodate thin, platelike, rare-earth nickel-borocarbide crystals,13–15 crystals that frequently have irregularities on one or more surfaces.兲
One can use the dilatometer itself to measure the length of irregularly shaped samples after they have been loaded: the sample length L will always be the distance that the sample platform is withdrawn relative to its position for the cell effect measurement. This distance can be measured with calipers or a micrometer. The precision of this measurement method can, in principle, be improved by incorporating the capacitances of the dilatometer for the two configurations, though we do not think that this approach will always be better than using high quality calipers or micrometers.
The open architecture of the dilatometer means that the sample will be exposed to any blackbody radiation illuminat-ing the dilatometer from the side and that a portion of the capacitance circuit, connected to the lower capacitor plate, will not be completely shielded from electrical interference. We address both of these issues by surrounding the dilatom-eter 共and the cold finger on which it is mounted兲 with a copper can that acts as both an electrical and a thermal shield. Thermometers mounted on the cold finger of our3He refrigerator have always agreed with thermometers mounted
123907-4 Schmiedeshoffet al. Rev. Sci. Instrum.77, 123907共2006兲
on the bottom of the dilatometer within experimental resolu-tion if the temperature is not changing too rapidly.
We generally take isothermal magnetostriction data with the field changing at a maximum rate of 0.4 T / min. A small field and sample dependent hysteresis is generally observed in isothermal magnetostriction data 共about ±8 Å near 9 T and 10 K when sweeping the field at 0.3 T / min in measure-ments of the field dependent cell effect, see below兲. We at-tribute the hysteresis to magnetic forces acting on the eddy currents generated in the dilatometer and sample共unless the sample is insulating兲 by the changing magnetic field. The magnetic moments associated with these currents change sign as the field increases or decreases. Forces arise because the field of our superconducting magnet is not perfectly uni-form. The size of the hysteresis is therefore reduced as the field sweep slows; slower field sweeps also reduce eddy cur-rent heating in the dilatometer. Averaging isothermal data taken with the field increasing and decreasing yields a field dependence of the capacitor gap less than 1 Å over 9 T, a value consistent with data taken after changing the field and waiting a few seconds for the hysteretic signal to vanish.
For temperatures from about 20– 300 K we usually take temperature-dependent data with T increasing continuously at a rate of about 0.4 K / min or less. For our system, data taken while warming are generally less noisy than while cooling in this temperature range. However, Lashley, running an identical dilatometer in a commercial physical property measurement system, finds that data taken while the experi-mental region is continuously pumped and while cooling at 0.2 K / min are less noisy. The optimal data acquisition pro-tocol in this temperature range can, as one might expect, vary from system to system. Below about 20 K we keep to this rate共or slower兲, but the warming and cooling data ex-hibit comparable levels of noise. We generally take data while the temperature is varying rather than stabilizing the temperature and then making the measurement because it requires less time to acquire and avoids small displacements that appear occasionally in the raw data. We believe that these displacements are caused by the sudden relaxation of small strains in the dilatometer or sample being studied or from building vibrations, these events manifest as abrupt changes in the size of the capacitor gapD 共on the order of 1 – 10 Å兲. Such “glitches” are uncommon16and do not affect the slope of the nearby data共from which the thermal expan-sion is determined, see below兲. However, should such an event occur between two data points acquired by first stabi-lizing the temperature and then measuring the capacitance
共instead of continuously monitoring the capacitance during the temperature change兲, the resulting slope would errone-ously incorporate the displacement.
The capacitance of the dilatometer is sensitive to thermal gradients: Though constructed of high thermal conductivity copper, the electrical isolation separating parts of the capaci-tor circuit impedes heat flow. The effects of such gradients are apparent, for example, when warming or cooling the dilatometer rapidly. In such circumstances the capacitance data are offset in opposite “directions” from data taken either in equilibrium or with the temperature varying very slowly. The opposite signs of the temperature gradient across the
dilatometer when warming or cooling causes an apparent shift in capacitance, qualitatively proportional to both the sign and magnitude of the thermal gradient. In steady state situations, however, the slopes of capacitance with respect to temperature are identical within experimental uncertainty as long as the warming or cooling is not too rapid. These effects can be mitigated, somewhat, if the dilatometer is surrounded by helium exchange gas共though the dielectric constant of the exchange gas may have to be incorporated in the analysis兲. Operating the dilatometer under liquid helium provides ex-cellent thermal contact to the sample and dramatically re-duces the thermal gradients across the dilatometer. However, the thermal expansion of the liquid helium共either3He,4He, or 3He–4He, mixtures兲 dominates the temperature depen-dence of the capacitance through the dielectric constant of the liquid. We have not yet made reliable thermal expansion measurements under liquid helium.
To characterize the resolution of the dilatometer under various operational conditions we first measured the dilatom-eter capacitance repeatedly over a period of about 30 min with two identical dilatometers, one held at 5.00 K in a com-mercial physical property measurement system17 surrounded by a small amount of helium exchange gas, and another held at 0.300 K in vacuum. In both cases the capacitance bridge averaging time was set to about 8 s. After converting the measured capacitances to capacitor gaps in a manner de-scribed above we found a rms deviation from the mean ca-pacitor gap of 0.03 Å for the former dilatometer and 0.05 Å for the latter. When the latter dilatometer was warming at a rate of 0.4 K / min over a 2 K range near 20 K the rms de-viation from a linear fit to the measurements was 0.04 Å, near 280 K the rms deviation was 0.11 Å 共we believe that this latter uncertainty could be reduced by using a thermom-eter more appropriate for this temperature range兲.
A magnetically anisotropic sample in a magnetic field will experience a torque if its magnetic moment is not par-allel to the field. Any motion of the sample in response to this torque will contribute to the measured capacitance change. We believe we have seen this effect manifest as an irreproducibility in magnetostriction measurements after the sample has been removed from the dilatometer and subse-quently reinstalled. We are exploring the use of thin films of glue or varnish to affix the sample to the sample platform, preventing it from responding to the magnetic torque. Unfor-tunately the glue or varnish will also contribute to the ther-mal expansion, though if it is very thin its effects may be small enough to ignore. Further work is underway on this issue.
DATA REDUCTION AND RESULTS
Once the capacitance of the dilatometer has been mea-sured as a function of temperature关assuming, for example, that our goal is to determine the thermal expansion through evaluation of Eq.共6兲兴the next tasks are to convert the mea-sured capacitances C to capacitor gaps D 共as described above兲 and then to evaluate the derivatives of the resulting data with respect to temperature.
The derivatives required to determine the thermal
expan-123907-5 Simple capacitive dilatometer Rev. Sci. Instrum.77, 123907共2006兲
sion can be evaluated point by point,18 or by algebraic polynomial,19cubic spline,3or Chebychev polynomial20 fits to the data points. Generally speaking the best approach will depend upon the sample under study. Problems will arise for any of these methods if the data set contains glitches inD共T兲
as discussed above. Cycling the temperature共or the magnetic field兲 usually reduces the number and size of the glitches which are easy to identify in simple derivatives of the raw data which for theith data point we usually evaluate as
冏
dDdT
冏
i=1 2
冋
Di+1−Di Ti+1−Ti
+Di−Di−1
Ti−Ti−1
册
. 共7兲 The glitches in D共T兲 occur at apparently random tempera-tures and manifest as delta-function-like featempera-tures in the de-rivative; we delete the points forming these features from our data. A numerical integration is performed on the resultant data prior to function fitting共if required兲. Typical data, show-ing the derivatives associated with the first two terms on the right hand side of Eq. 共6兲 共the cell effect and data on an aluminum sample discussed below兲, are shown in Fig. 3; these derivatives were evaluated using Eq. 共7兲. The inset shows the temperature dependence of the capacitor gap for the cell effect below 5 K, and the solid line is a fit to the form ⌬D=D共T兲−D共0兲=aTn. For the data shown the mean deviation from the fit is 0.025 Å.
Approximately six delta-function-like features were re-moved from each of the data sets shown in Fig.3. A small feature near 240 K, visible in both data sets, is an artifact of the dilatometer that, to first order, is removed from the final data 共discussed below兲 along with the cell effect. We have not found examples of cell effects for other dilatometer de-signs in the literature. That shown in Fig. 3 is larger than most for the half dozen dilatometers of this design that we have constructed and tested, some of which exhibit a cell effect that changes sign with increasing temperature and one or more features similar to that near 240 K in Fig. 3. We continue to explore variations on our annealing and assembly protocols with an eye towards making the cell effect both smaller and smoother.
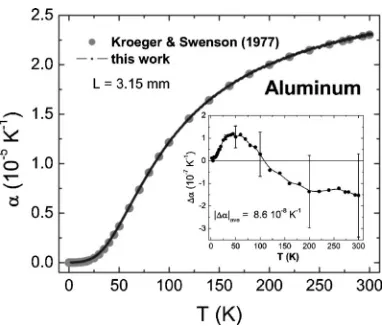
Using the techniques discussed above we measured the thermal expansion and magnetostriction of a high-purity sample of polycrystalline aluminum. The thermal expansion results are shown in Fig.4where they are compared to pub-lished values. The solid circles represent tabulated values of the thermal expansion of aluminum12from 2 to 300 K. The closely spaced results of our measurements, where the de-rivatives were evaluated using Eq.共7兲, appear to be a solid line. The inset shows the difference between our measure-ments and tabulated data in the literature共specifically, Table III in Ref. 12; in this case the derivatives were evaluated from linear fits to our data in the vicinity of the temperatures of the tabulated results in the literature兲. The uncertainty bars in the inset are equal to those of our thermal expansion mea-surements共we take the uncertainty in the literature values to be zero兲. The average absolute value of the deviation of our measurements from those in the literature共兩⌬␣兩ave兲, over the
full temperature range shown, is 8.6⫻10−8K−1. The average
absolute value of the fractional deviation 共兩⌬␣/␣兩兲 of our aluminum measurements from those in the literature is about 1% above 40 K but becomes larger at low temperatures where the thermal expansion of aluminum is sensitive to both sample purity and preparation.12
The longitudinal magnetostriction of our aluminum sample at 10.0 K is shown in Fig.5. The field-dependent cell effect for these measurements关analogous to the second term on the right-hand side of Eq.共6兲兴was less than 1 Å over 9 T and is ignored. The magnetostriction of copper关analogous to the third term on the right-hand side of Eq.共6兲兴 is so small
共as expected for a nonmagnetic metal兲that we are unable to find measurements of it in the literature, making it a natural choice for dilatometers focused on magnetostriction measurements.21The oscillatory magnetostriction, driven by the de Haas–van Alphen effect in the magnetization, is clearly visible. The dominant oscillation period, about 3.1
⫻10−3T−1, is consistent with an ensemble average 共our
[image:9.612.342.533.47.210.2]sample is polycrystalline兲 over the large, high-frequency orbits identified in single crystal measurements.22 The ap-pearance of these oscillations in a polycrystalline sample at
FIG. 3. Typical data showingdD/dT for the dilatometer with a copper standard共solid line, the “cell effect,” see text兲and with an aluminum sample
共dashed line兲. The inset shows the low-temperature dependence of the ca-pacitor gap for the cell effect共see text兲; the solid line is a fit to the form
[image:9.612.77.268.48.206.2]⌬D=D共T兲−D共0兲=aTn.
FIG. 4. The thermal expansion of aluminum, measured by the techniques discussed in this article共“solid line,” see text兲, compared to the published values of Kroeger and Swenson共Ref.12兲 共solid circles兲. The inset shows the difference between our measurements and tabulated values of Kroeger and Swenson; the solid line is a guide to the eyes.
123907-6 Schmiedeshoffet al. Rev. Sci. Instrum.77, 123907共2006兲
such high temperatures suggests that the sample is excep-tionally clean. 共We have never observed such oscillations associated with the OHFC copper of the dilatometer itself, for example.兲
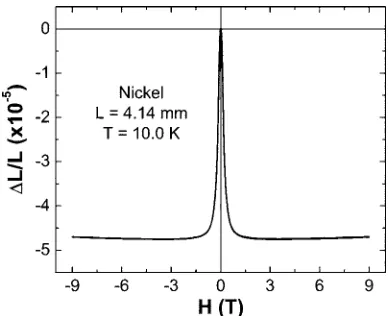
The longitudinal magnetostriction of a cylindrical sample of high purity, polycrystalline nickel is shown in Fig.
6, a pronounced negative Joule magnetostriction 共directly related to the field-dependent magnetization兲 and a slightly positive forced magnetostriction 共the magnetostriction in fields beyond that required to saturate the magnetization兲are observed. Both of these features are consistent with pub-lished results.23,24
Other measurements of thermal expansion and magneto-striction using dilatometers of this design are beginning to appear in the literature. Examples include measurements on the Ising antiferromagnet TbNi2Ge2,25 the nonmagnetic
bo-rocarbide superconductor YNi2B2C,14 the magnetic
borocar-bide superconductor ErNi2B2C,15 the shape-memory alloy
InTl,26 the volume collapse in Ce,27 and the heavy fermion superconductor CeCoIn5.28 To date the dilatometer has
per-formed well in a range of different laboratory environments and on a diverse set of materials.
The dilatometer, as described, can accommodate sample
thicknesses up to about 5 mm, though we know of no reason why the design could not be increased in size to handle larger samples or reduced in size for operation in more con-fined environments. The dilatometer has operated success-fully with a commercial physical property measurement sys-tem 共1.8– 300 K, and in magnetic fields to 14 T兲, an exchange gas cryostat共1.5– 300 K兲, a 3He, refrigerator with the dilatometer mounted in vacuum共300 mK– 300 K, and in fields to 9 T兲, as well as3He, and dilution refrigerators with the dilatometer immersed in liquid helium共0.25 to about 2 K in fields to 18 T, and 30 mK to about 1.3 K in fields to 45 T, respectively, for magnetostriction measurements兲. The open architecture, sample mounting scheme, and straightforward relationship between sample dilation and the capacitance of the dilatometer make this a relatively simple dilatometer to construct and operate.
ACKNOWLEDGMENTS
The authors gratefully acknowledge the craftsmanship of Roy F. Rockage and helpful conversations with J. J. Neu-meier, M. F. Hundley, and E. D. Bauer. Work at Los Alamos National Laboratory was supported under the auspices of the U. S. Department of Energy. Ames Laboratory is operated for the U. S. Department of Energy by Iowa State University under Contract No. W-7405-Eng.-82. Work at Ames Labora-tory was supported by the director for Energy Research, Of-fice of Basic Energy Sciences. Work at the National High Magnetic Field Laboratory was supported under the auspices of the National Science Foundation, the State of Florida, and the U. S. Department of Energy. Work at Occidental College was supported by the National Science Foundation under DMR-0305397.
1E. Grüneisen, Ann. Phys.共N.Y.兲 39, 257共1912兲.
2T. H. K. Barron and G. K. White,Heat Capacity and Thermal Expansion
at Low Temperatures共Kulwer Academic, Dordrecht/Plenum, New York, 1999兲, and references therein.
3R. Pott and R. Schefzyk, J. Phys. E 16, 445共1983兲.
4C. A. Swenson, inThermal Expansion of Solids, edited by R. E. Taylor
共ASM International, 1998兲, Chap. 8, p. 207.
5M. Rotter, H. Müller, E. Gratz, M. Doerr, and M. Loewenhaupt, Rev. Sci.
Instrum. 69, 2742共1998兲.
6Model 2500A digital capacitance bridge manufactured by
Andeen-Hagerling, Inc.
7Cernox thermometer, model CX-1030-SD from Lakeshore Cryotronics,
Inc.
8Ruthenium Oxide thermometer, model RO-600 from Scientific
Instru-ments, Inc.
9C. A. Swenson, Rev. Sci. Instrum. 68, 1315共1997兲.
10J. C. Cooley and M. C. Aronson, J. Alloys Compd. 228, 195共1995兲. 11W. C. Heerens and F. C. Vermeulen, J. Appl. Phys. 46, 2486共1975兲. 12F. R. Kroeger and C. A. Swenson, J. Appl. Phys. 48, 853共1977兲. 13P. C. Canfield, P. L. Gammel, and D. J. Bishop, Phys. Today 51共10兲, 40
共1998兲.
14S. L. Bud’ko, G. M. Schmiedeshoff, G. Lapertot, and P. C. Canfield, J.
Phys.: Condens. Matter 18, 8353共2006兲.
15S. L. Bud’ko, G. M. Schmiedeshoff, and P. C. Canfield, Solid State
Commun. 140, 281共2006兲.
16C. Meingast, B. Blank, H. Bürkle, B. Obst, T. Wolf, H. Wühl, V.
Selva-manickam, and K. Salama, Phys. Rev. B 41, 11299共1990兲.
17Physical Property Measurement System manufactured by Quantum
Design Inc.
18T. H. K. Barron, inThermal Expansion of Solids, edited by R. E. Taylor
共ASM International, 1998兲, Chap. 1, p. 1.
[image:10.612.77.268.50.209.2]19T. H. K. Barron, J. G. Collins, and G. K. White, Adv. Phys. 29, 609
FIG. 5. The longitudinal magnetostriction of our polycrystalline aluminum sample at 10.0 K showing the characteristic oscillatory behavior resulting from the de Haas–van Alphen effect. The inset shows a portion of the high field data plotted as⌬L=L共H兲−L共0兲vs 1 /H.
FIG. 6. The longitudinal magnetostriction of polycrystalline nickel at 10.0 K.
123907-7 Simple capacitive dilatometer Rev. Sci. Instrum.77, 123907共2006兲
[image:10.612.77.271.571.729.2]共1980兲.
20J. J. Neumeier, T. Tomita, M. Debessai, J. S. Schilling, P. W. Barnes, D. G.
Hinks, and J. D. Jorgensen, Phys. Rev. B 72, 220505共2005兲.
21E. Fawcett, Phys. Rev. B 2, 1604共1970兲.
22C. L. Larson and W. L. Gordon, Phys. Rev. 156, 703共1967兲. 23E. Fawcett and G. K. White, J. Appl. Phys. 38, 1320共1967兲. 24V. I. Nizhankovskii, Eur. Phys. J. B 53, 1共2006兲.
25G. M. Schmiedeshoff, S. Hollen, S. L. Bud’ko, and P. Canfield, AIP Conf.
Proc. 850, 1297共2006兲.
26J. C. Lashleyet al., Phys. Rev. B共submitted for publication兲; cond-mat/
0607275.
27J. C. Lashleyet al., Phys. Rev. Lett. 97, 235701共2006兲.
28V. F. Correaet al., Phys. Rev. Lett.共submitted for publication兲; cond-mat/
0609487.
123907-8 Schmiedeshoffet al. Rev. Sci. Instrum.77, 123907共2006兲