Biogeosciences, 3, 69–83, 2006 www.biogeosciences.net/3/69/2006/ © Author(s) 2006. This work is licensed under a Creative Commons License.
Biogeosciences
The effects of biomanipulation on the biogeochemistry, carbon
isotopic composition and pelagic food web relations of a shallow lake
B. M. Bontes1, R. Pel1, B. W. Ibelings1, H. T. S. Boschker2, J. J. Middelburg2, and E. Van Donk1
1Centre for Limnology, Netherlands Institute of Ecology (NIOO-KNAW), Rijksstraatweg 6, 3631 AC Nieuwersluis, The
Netherlands
2Centre for Estuarine and Marine Ecology, Netherlands Institute of Ecology (NIOO-KNAW), Korringaweg 7, 4401 NT
Yerseke, The Netherlands
Received: 21 June 2005 – Published in Biogeosciences Discuss.: 10 August 2005 Revised: 20 December 2005 – Accepted: 9 January 2006 – Published: 2 March 2006
Abstract. In this study we investigated the effects of ex-perimental biomanipulation on community structure, ecosys-tem metabolism, carbon biogeochemistry and stable isotope composition of a shallow eutrophic lake in the Netherlands. Three different biomanipulation treatments were applied. In two parts of the lake, isolated from the rest, fish was removed and one part was used as a reference treatment in which no biomanipulation was applied. Stable isotopes have proved useful to trace trophic interactions at higher food web lev-els but until now methodological limitations have restricted species specific isotope analysis in the plankton community. We applied a new approach based on the combination of fluo-rescence activated cell sorting (FACS) and isotope ratio mass spectrometry (IRMS) to trace carbon flow through the plank-tonic food web. With this method we aimed at obtaining group specificδ13C signatures of phytoplankton and to trace possible shifts inδ13C resulting from fish removal.
Biomanipulation led to an increase in transparency and macrophyte biomass and decrease in phytoplankton abun-dance, but zooplankton numbers did not increase. Fish re-moval also resulted in high pH, high O2, low CO2and more
negativeδ13CDICvalues than expected, which is attributed to
chemical enhanced diffusion with large negative fractiona-tion. Despite high temporal variation we detected differences between the isotopic signatures of the primary producers and between the different treatments. The fractionation values of green algae (∼21‰) and diatoms (∼23‰) were similar and independent of treatment, while fractionation factors of filamentous cyanobacteria were variable between the treat-ments that differed in CO2availability. 13C-labeling of the
phytoplankton groups showed that biomanipulation led to in-creased growth rates of green algae and diatoms at the ex-pense of cyanobacteria. Finally, consumers seemed general-ists to the available food sources.
Correspondence to: B. M. Bontes
(b.bontes@nioo.knaw.nl, bbontes@yahoo.com)
1 Introduction
Over the last decades, biomanipulation of lakes has become a popular tool to assist lake restoration. However, the results of biomanipulation may be variable and biomanipulation does not always lead to the desired improvement of water quality (Jeppesen et al., 1997). The failure of biomanipulation is of-ten attributed to the complexity of lacustrine food web struc-ture. In earlier studies, quantitative effects of fish removal on higher trophic levels have been described in detail (Meijer et al., 1999), but effects of fish reduction on CO2, O2, pH
dy-namics and carbon fluxes in the seston of especially shallow lakes are largely unknown. Schindler et al. (1997) were the first to observe that manipulation of predators and the con-sequent shift in grazers had a dramatic impact on lake CO2
concentrations and the exchange of CO2across the air-water
interface. They also observed that shifts in isotopic compo-sition of algae (seston), zooplankton and fish were linked. Subsequently, Cole et al. (2000) and Carpenter et al. (2001) confirmed the observations regarding the dynamic response of O2and CO2concentrations to biomanipulation. Recently,
Bade et al. (2004) reported that biomanipulation induced not only low CO2concentrations but also may result in depleted
δ13C values of dissolved inorganic carbon due to chemical enhanced diffusion at high pH values.
70 B. M. Bontes et al.: Isotope analysis of a biomanipulated shallow lake
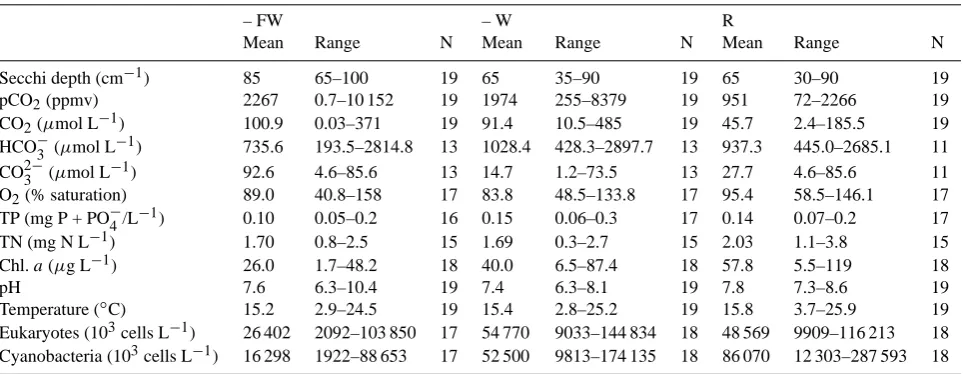
Table 1. Characteristics of the three treatments; water chemistry figures are annual means based on regular measurements from February– December 2003. Ranges are the minimal and maximal values observed during this period.
– FW – W R
Mean Range N Mean Range N Mean Range N
Secchi depth (cm−1) 85 65–100 19 65 35–90 19 65 30–90 19
pCO2(ppmv) 2267 0.7–10 152 19 1974 255–8379 19 951 72–2266 19
CO2(µmol L−1) 100.9 0.03–371 19 91.4 10.5–485 19 45.7 2.4–185.5 19
HCO−3 (µmol L−1) 735.6 193.5–2814.8 13 1028.4 428.3–2897.7 13 937.3 445.0–2685.1 11
CO23−(µmol L−1) 92.6 4.6–85.6 13 14.7 1.2–73.5 13 27.7 4.6–85.6 11
O2(% saturation) 89.0 40.8–158 17 83.8 48.5–133.8 17 95.4 58.5–146.1 17
TP (mg P + PO−4/L−1) 0.10 0.05–0.2 16 0.15 0.06–0.3 17 0.14 0.07–0.2 17
TN (mg N L−1) 1.70 0.8–2.5 15 1.69 0.3–2.7 15 2.03 1.1–3.8 15
Chl.a(µg L−1) 26.0 1.7–48.2 18 40.0 6.5–87.4 18 57.8 5.5–119 18
pH 7.6 6.3–10.4 19 7.4 6.3–8.1 19 7.8 7.3–8.6 19
Temperature (◦C) 15.2 2.9–24.5 19 15.4 2.8–25.2 19 15.8 3.7–25.9 19
Eukaryotes (103cells L−1) 26 402 2092–103 850 17 54 770 9033–144 834 18 48 569 9909–116 213 18
Cyanobacteria (103cells L−1) 16 298 1922–88 653 17 52 500 9813–174 135 18 86 070 12 303–287 593 18
phytoplankton groups (green algae and cyanobacteria) can be used directly to study carbon transfer from primary to sec-ondary consumers, and to assess preferential grazing by zoo-plankton. Boschker et al. (2005) used compounds specific isotope analysis of algal and bacterial biomarkers to trace in-teraction within the microbial domain in the Scheldt estuary. In this study we will investigate the effects of fish removal on community structure, ecosystem metabolism, carbon bio-geochemistry and stable isotope composition of a shallow Dutch lake (Terra Nova). Most Dutch lakes (depth 0.5– 1.5 m) originate from peat extractions in the 19th century and are characterized by peaty sediment and brown, turbid water rich in humic substances. The majority is highly eutrophic and regular reoccurring blooms of cyanobacteria are an im-portant concern for lake management (Scheffer, 1998).
The main perspective behind the present study is that biomanipulation changes the lower food chain relationships, thereby altering the carbon cycling, which is reflected in the C-isotopic values of dissolved inorganic carbon and pri-mary producers. We will use the unique combination of fluorescence-activated cell sorting and IRMS (Pel et al., 2003, 2004a) to determine end memberδ13C values for the main phytoplankton groups, a prerequisite for detailed food-web studies based on stable isotope analysis. Moreover, we expect that changes in the isotopic composition of phyto-plankton, due to fish removal, are reflected in the isotope sig-natures of zooplankton, the main consumers of these algae. Ultimately, the information on carbon isotope ratios (δ13C) of the smaller size classes of the pelagic biota (phytoplank-ton and zooplank(phytoplank-ton), before and after fish removal may in-crease our understanding of ecosystem functioning and im-prove the predictability of the response of lakes to biomanip-ulation. The aim of our study was to reveal potential shifts
in (a) biogeochemical variables e.g. O2 and CO2; (b)δ13C
values of DIC, algae and zooplankton, and (c) trophic inter-actions between seston species, caused by biomanipulation in a eutrophic, shallow lake.
2 Material and methods
2.1 Study site
B. M. Bontes et al.: Isotope analysis of a biomanipulated shallow lake 71
Fig. 1
Terra Nova
Field set up
Fish dam
+ fish
+ wind
(R)
+ fish
- wind
(- W)
- fish
- wind
(- FW)
[image:3.595.71.519.64.202.2]Peat baulk
Treatment
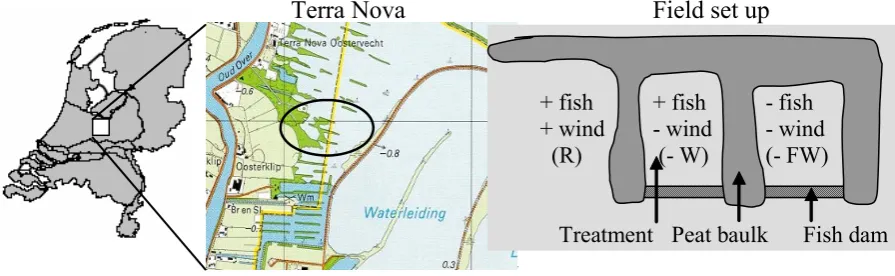
Fig. 1. Location of Terra Nova (Loosdrecht Lakes, the Netherlands) and the design of the biomanipulation experiment in the field.
9.7 kg ha−1)and are both planktivorous fish species with an early benthic life stage. As a result of these characteristics they may have a profound effect on the turbidity of the water column, either by high grazing rates on zooplankton (main consumers of algae) or resuspension of the sediment. For an insight in the dynamics of the seston and abiotic parameters, before the biomanipulation, monitoring data of the reference area (R) during the three years prior to the start of the exper-iment are provided in Appendix A.
In September 2002, two shallow lakes (average area = 0.005 km2; average depth = 0.9 m) in Terra Nova were iso-lated from the rest of the lake by wooden dams, to prevent fish migration (Fig. 1). In January 2003, fish was removed from both lakes using nets and electrical fishing. Effective-ness of fish removal was determined by the mark-recapture method of Petersen (1896) with a total reduction of the plank-tivorous and benthivorous fish stock by almost 75% (source Witteveen & Bos). The southern lake was restocked with a known amount and composition of fish, reflecting the av-erage Terra Nova densities (see earlier), whilst the northern lake was left without fish. For correct interpretation it is es-sential to note that wind, as well as fish, was significantly reduced in both enclosures. The decrease in wind effect may have reduced sediment resuspension and gas exchange across the air-water interface. A reference location adjacent to the two closed lakes and in open contact with the main lake was also monitored; this site was more wind exposed than the biomanipulated enclosures (but less wind exposed than the open water of Terra Nova), and fish conditions were left un-changed. Hereafter we will refer to the different sample lo-cations as – FW (– fish and – wind), – W (+ fish – wind) and R (reference; i.e. + fish + wind). Unfortunately a location without fish, but with wind conditions unchanged (– fish + wind) was not available.
2.2 Monitoring plankton and abiotic variables
Water samples were collected (bi) weekly, from February– December 2003 from the 3 locations, using a 1.5 m long tube
sampler, which enabled us to sample the entire water col-umn. From a mixed 30 L sample, a sub sample of 10 L was brought to the laboratory for analysis. Secchi depth, temper-ature, pH and oxygen concentrations were measured in situ (Multiline-P4 meter, WTW, Germany). To monitor phyto-plankton abundance, Chl.a(µg L−1)of green algae, diatoms and cyanobacteria was measured using a Phyto-PAM (Walz, Germany) and number of cells per algal group was deter-mined using a Coulter Elite flow cytometer. For quantifying pelagic zooplankton, 4L of field sample was filtered (33µm; micro- and meso zooplankton), the residue was dissolved in 50 mL tap water, fixed with glutaraldehyde-formaldehyde (1% solution) and stored cold and dark. Later, zooplankton was counted microscopically (250×) using the sub sampling method of Kott (1953). Macrophytes abundance was ob-tained by monitoring species composition and percentage of surface cover in all three sites (source; bureau Waardenburg). Macrophytes were not sampled and analysed for stable iso-tope composition. Therefore a more detailed explanation of their role in carbon isotope dynamics was not feasible. 2.3 Stable isotope analysis
Concentrations andδ13C values (13C:12C ratio) of DIC (C-source used by algae for primary production) were measured every other week by injecting 1.5 mL of lake water into 8 mL airtight bottles that had been previously flushed with he-lium. To convert all DIC to CO2 the samples were
acidi-fied with 0.2 mL H3PO4(2 M) and after 24 h, 0.4 mL of the
gaseous headspace was manually injected into a Euro Ele-mental Analyzer (Eurovector, Italy) coupled to a Finnigan Delta-S IRMS. A carbonate calibration series was run to-gether with the samples (10, 20 and 40 ppm Na2CO3in
milli-Q, acidified and equilibrated similarly as the lake samples). Next, CO2(aq)and pCO2(ppmv) were derived from DIC and
the in situ lake pH using pK values calculated according to Prieto and Millero (2002). Corrections for the discrimination of the heavy13C isotope (i.e. fractionation orε), due to CO2
72 B. M. Bontes et al.: Isotope analysis of a biomanipulated shallow lake according to Baird et al. (2001), Miyajima et al. (1995) and
Mook et al. (1974).
In addition δ13C values of cellular fatty acids (FA) of the various phytoplankton groups (cyanobacteria, eukaryotes (green algae + diatoms)) and zooplankton species were mon-itored at regular intervals, at the locations – FW, – W and R. Preparation and analysis of the phytoplankton samples oc-curred by cell sorting on a flow cytometer followed by iso-tope measurements of group-specific FA as described in Pel et al. (2004a). In the isotope analyses for diatoms we focused on the C20:5FA (Middelburg et al., 2000), whilst for green
al-gae, cyanobacteria, Microcystis and flab (floating algal beds) we used the C18:n FA. At low algal densities, lake sam-ples were concentrated by centrifugation (Jouan instruments, France) prior to cell sorting by flow cytometer (FACS). Pilot tests showed that cells remained intact and fluorescence was not significantly affected when centrifuged for 2×10 min., at 196 G. Microcystis and filamentous macroalgae (flab) were not sorted on the flow cytometer, but colonies and filaments were handpicked under a microscope. Zooplankton used for isotope analysis was concentrated by filtering lake water over a 33 micrometer filter and selecting the species under a stere-omicroscope (magnification 10×). Depending on size and FA concentration of the different zooplankton species, 1 to 20 individuals were used per sample. The entire sample was pyrolised, but for isotope analyses of zooplankton we only focussed on the C18:nFA.
Isotope analysis of FA was performed by in-situ py-rolytic methylation and IRMS linked gas chromatography. Instead of TMPAH (trimethyl phenyl ammonium hydrox-ide) as derivatisation reagent (Pel et al., 2003, 2004a), we used 0.5–0.7 microlitre TMSH (trimethyl sulfonium hydroxide; 0.25 M solution in methanol) in the present study, because of the much reduced isomerization side-effects of this reagent in the transesterification of poly-unsaturated FA (Blokker et al., 2002). Carbon isotopic composition of the FA is reported in δ-notation: δ13C in parts per thousand (‰)=[(13C/12Csample−13C/12Creference
)-1]×103expressed relative to Vienna Pee Dee Belemnite. Re-producibility was<0.4‰ for FCM-sorted phytoplankton and
≤0.3‰ for handpicked zooplankton (Pel et al., 2003). FA were identified by their retention times using a known sample of Limnothrix sp. strain MR1 (Pel et al., 2004a). As potential end members of the carbon sources of the pelagic food web in Terra Nova, we used the main primary producers (eukary-otes, cyanobacteria and macroalgae).
Isotope discrimination by the different phytoplankton groups, with respect to the CO2(aq)source, will be expressed in terms of epsilon (ε) calculated according to Freeman and Hayes (1992): ε=(δ13C CO2(aq)−δ13Calgae)/(1+(δ13C
CO2(aq)/1000)). In the calculation of the isotope fraction-ation of the phytoplankton groups, we corrected phytoplank-ton δ13C values for an offset of 9‰ between FA and cell carbon biomass (see Pel et al., 2004a). The offset was used only in calculating theεin phytoplankton (Tables 3a, b and
c). All figures are based on rawδ13C values because com-parisons are only made among FAδ13C values.
2.4 Growth rate measurements
In order to relate phytoplankton population dynamics to group-specific isotopic signatures, in-situ specific growth rates (µc (d−1), where c is carbon) of cyanobacteria, green algae and diatoms for the 3 sites of Terra Nova were ob-tained monthly from 31 March till 25 November 2003. The growth rates were estimated from the rate of 13C-CO2
in-corporation into the FA over a 24 h-period using the method of Pel et al. (2004b). To approach the in situ light condi-tions, the cells were exposed to the average light dose they received in the field (PAR), calculated according to Scheffer (1998), using Secchi depth, mixing depth and average light intensity of the previous 10 days. Light was provided by 4 to 8 Philips fluorescent light tubes (24W/840). Samples for obtaining growth rate were taken at t0hand t24hafter
enrich-ment and isotope analysis of the DIC and phytoplankton was performed as described above (sorted by FACS and isotopic composition measured by Py-GC-IRMS). Growth rates were calculated according to Welschmeyer and Lorenzen (1984). Because sample preparation for isotope analysis was labour intensive and GC analysis time relatively long, samples were analyzed in single.
2.5 Statistical analysis
Differences in the isotopic signatures of the main plank-ton groups, within and between treatments, were analyzed for significance using a repeated measurement ANOVA (p<0.05) using Statistica® (Stat Soft, Inc., U.S., 2003). Prior to analysis, data were checked for normality and homo-geneity of variance. Statistical power was rather low because of large temporal variation in isotope data, lack of overlap between treatments and lack of replication. Simple isotope mass balances were used to estimate the dependence of zoo-plankton on prokaryotic and eukaryotic carbon resources.
3 Results
B. M. Bontes et al.: Isotope analysis of a biomanipulated shallow lakeFig.2 73
(a)
Secchi depth (cm
-1) 0
20 40 60 80 100 120 0 25 50 75 100 125 0 20 40 60 80 100 120 0 25 50 75 100 125 0 20 40 60 80 100 120
12 Feb 3 Mar 24 Mar 31 Mar 8 Apr 12 May 19 May 27 May 2 Jun10 Jun 25 Jun 8 Jul 21 Jul 5 Aug 11 Aug 18 Aug 29 Sep 25 Nov
0 25 50 75 100 125 - W R Chl. a ( μ g L -1) Date -FW Fig. 2 (b) O2 satura tion (%) Date 40 60 80 100 120 140 160 0 1 10 100 1000 10000 100000 40 60 80 100 120 140 160 0 1 10 100 1000 10000 100000 40 60 80 100 120 140 160
12 Feb 3 Mar 24 Mar 8 Apr 15 Apr 22 Apr 7 May 19 May 2 Jun25 Jun 8 Jul 21 Jul5 Aug 18 Aug 1 Sep 16 Sep 29 Sep 25 Nov
0 1 10 100 1000 10000 100000 - FW -W R Log pCO 2 (ppmv) (a) (b) Fig. 2 (c) 6 7 8 9 10 11 12 -16 -14 -12 -10 -8 -6 -4 -2 0 2 4 6 7 8 9 10 11 12 -16 -14 -12 -10 -8 -6 -4 -2 0 2 4 6 7 8 9 10 11 12
12 Feb 3 Mar 24 Mar 31 Mar 8 Apr 15 Apr 22 Apr 7 May 19 May 2 Jun 25 Jun 8 Jul 21 Jul 5 Aug 18 Aug 1 Sep 16 Sep 29 Sep 25 Nov
-16 -14 -12 -10 -8 -6 -4 -2 0 2 4 Date pH -W R - FW δ 13C (DIC) (‰ ) (c)
Fig. 2. In the three treatments – FW, – W and R at Terra Nova from 12 February–25 November 2003 (a) transparency as Secchi depth (filled
squares) and algal biomass as total Chl.a(µg L−1)(open triangles) The sum of Chl.aincludes all algae groups present. (b) O2(thin line
with open symbols) and CO2(heavy line with solid symbols) percentage in the water column. Net autotrophy is indicated by levels higher
than by 100% O2saturation (thin horizontal line) and by CO2levels lower than∼370 ppmv) (dashed horizontal line) (c) pH (open circles,
solid line) and stable isotope (δ13C) values of dissolved inorganic carbon (DIC) (solid circles, dotted line).
(Fragilara). In – FW the low algal biomass was equally di-vided over cryptophytes, flagellates, larger diatoms (Aster-ionella) and green algal species (Tetrastrum, Pediastrum), whereas cyanobacteria only played a minor role. Finally, in all locations extremely high numbers of small unicellular green algae were present. Nutrient levels and temperature, did vary in time, but did not vary significantly between treat-ments (Table 1).
Macrophyte monitoring (source bureau Waardenburg) re-vealed that treatment – FW was covered for ∼25% by macroalgae (Melosira, Ulothrix and Spyrogyra) and for
∼25% by floating macrophytes (Nymphae and Nuphar) (from 8 April to 23 July). The largest coverage of flab (40%) occurred from 7 May to 16 June. By the end of August∼95% of – FW was covered by submerged macrophytes (Cerato-phyllum and Elodea) and regularly seedlings of some rare
species (e.g. Chara globularis, Nitella flexilis, Najas marina and Stratiotes aloides) were encountered in – FW. In – W, the cover of the lake by macroalgae also increased to 25%, but during a shorter period (12–19 May). However, for the rest of the year submerged and floating macrophytes (Nymphae and Nuphar) covered∼30% of the lake surface while Elodea and Ceratophyllum biomass remained low compared to – FW. In R, macroalgae and submerged plants were almost absent and the site was dominated by the floating macrophytes Nymphae and Nuphar.
74 B. M. Bontes et al.: Isotope analysis of a biomanipulated shallow lake
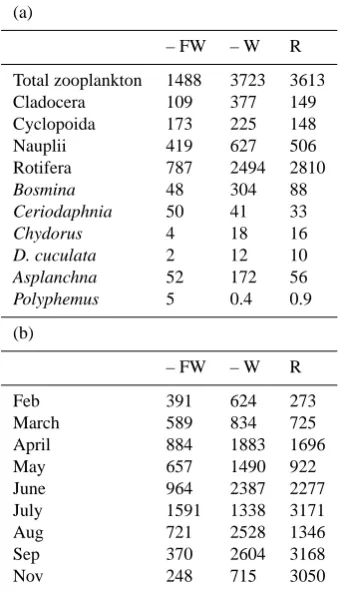
Table 2. Zooplankton densities at the 3 locations during 2003. (a)
Annual mean zooplankton densities (ind.L−1)per group and per
key species. Cladocera include the species Bosmina and Daph-nia. Rotifers include species from the genus Keratella, Filinia, Pol-yarthra and Trichocerca. Cyclopoid nauplli and adult cyclopoids are considered separately, because of their different diet; (b) Mean
dominant zooplankton species density per month (ind.L−1).
(a)
– FW – W R
Total zooplankton 1488 3723 3613
Cladocera 109 377 149
Cyclopoida 173 225 148
Nauplii 419 627 506
Rotifera 787 2494 2810
Bosmina 48 304 88
Ceriodaphnia 50 41 33
Chydorus 4 18 16
D. cuculata 2 12 10
Asplanchna 52 172 56
Polyphemus 5 0.4 0.9
(b)
– FW – W R
Feb 391 624 273
March 589 834 725
April 884 1883 1696
May 657 1490 922
June 964 2387 2277
July 1591 1338 3171
Aug 721 2528 1346
Sep 370 2604 3168
Nov 248 715 3050
Anuraeopsis and Trichocerca outnumbered all other species in all treatments, making up 53, 67 and 78% of the total an-nual zooplankton number in – FW, –W and R, respectively (Table 2a). However, the relative contribution of cladocer-ans, cyclopoids and nauplii and some species of crustaceans (Polyphemus, Ceriodaphnia) was larger in – FW, though Bosmina and Asplanchna contributed relatively similar to the total of zooplankton in all treatments. In the period from 2000 to 2002, before the onset of the biomanipulation (Ap-pendix A, Fig. A1c), rotifers in R contributed on average 72, 91 and 88% to total zooplankton. Furthermore, in 2002 crus-taceans, copepods and nauplii contributed only 1, 2 and 9%, respectively.
3.2 pH, O2and CO2dynamics
The effects of fish removal and the resulting extensive growth of macrophytes on pCO2, O2saturation and pH in the water
column were far-reaching (Fig. 2b and c). In – FW, pH
in-creased from pH 7 to 8.5 between 15 April and 7 May, fol-lowed by a second, equally large increase from pH 8.5 to 10 within a two week period later in May (Fig. 2c). This high pH situation lasted until 2 June, after which pH went down again to≈7. Although no isotope data of macrophytes were available, these high pH values in – FW co-occurred with substantial increases in submerged macrophyte and macroal-gal biomass and O2and decreases in pCO2(Fig. 2b). It
ap-peared that in – FW, between 15 April and 2 June, production outbalanced respiration and the system was periodically net autotrophic (Fig. 2b). This is indicated by O2(aq)surpassing the 100% saturation level and pCO2remaining below
atmo-spheric levels (<370 ppmv) (Fig. 2b). Lower O2levels at the
end of August may indicate increased mineralization of the macrophyte biomass and flab by bacteria and heterotrophic biota (Fig. 2b). Unfortunately this can not be confirmed by an increase in DOC or bacterial abundance because these pa-rameters were not studied. In the treatments – W and R, pH never exceeded 8.6, and values averaged around≈pH 7 throughout the year (Fig. 2c). It seems that CO2production
and O2consumption (net heterotrophy) were the dominant
processes directing the carbon fluxes in – W and R (Fig. 2b), although primary production increased during a short period (25 June–8 August 2003), shown as crossing the O2
satura-tion and CO2depletion lines during that period.
3.3 Stable isotope analysis of DIC, phytoplankton and zoo-plankton
In – FW two large decreases in δ13CDIC were observed;
from 8 April to 2 June (from≈0‰ to−15‰) and from 21 July to 16 September (from −1‰ to −10‰) (Fig. 2c; Ta-bles B1a–c in Appendix B). These lowδ13C values occurred only in the absence of fish and reduction of wind, because δ13CDIC ranged from ≈2‰ to – 4‰ in the treatments -W
and R (Fig. 2c). Furthermore, average seasonalδ13C values of DIC (mean−5.1‰) were more depleted in – FW than – W and R (mean−1‰; Table B1a–c in Appendix B). The de-crease inδ13CDICobserved in – FW during the autotrophic
period, was contrary to what we expected, namely enrich-ment in13CDIC during periods of high primary production
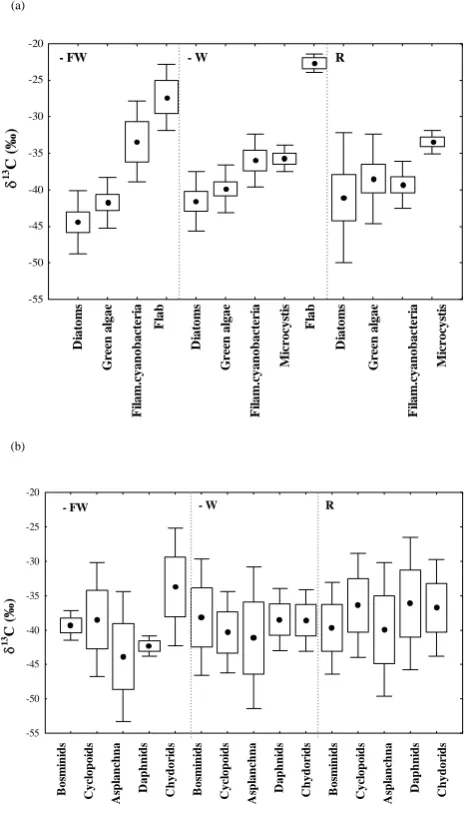
caused by the preferential use of12C during photosynthesis. The isotope signature of diatoms, green algae and cyanobac-teria in – FW, – W and R did not significantly differ from each-other within or between treatments (ANOVA, p>0.05) (Fig. 3a and Appendix B), but theδ13C of flab differed sig-nificantly (p<0.05) from theδ13C of diatoms and green algae in – FW and –W and as well from cyanobacteria and Micro-cystis in – W. Moreover, δ13C of Microcystis significantly differed from other cyanobacteria in R. In – FW and – W meanδ13C of eukaryotic algae (range;−39.9‰ to−44.4‰) were more depleted than cyanobacteria (range; −33.4‰ to
B. M. Bontes et al.: Isotope analysis of a biomanipulated shallow lake 75
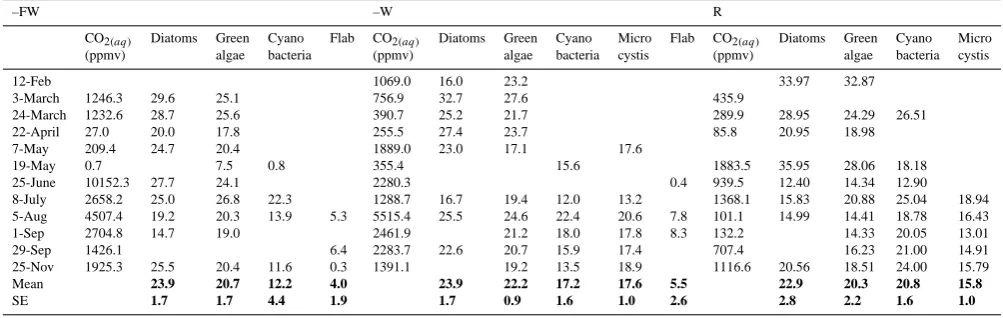
Table 3. Temporal variation (12 February–25 November 2003) in the atmospheric pressure of CO2(aq) (ppmv) per treatment and the
fractionation (ε)of the C20:5FA in diatoms and C18:nFA in green algae, cyanobacteria, Microcystis and flab. Epsilons were calculated with
CO2(aq)as carbon source and corrected for theδ13C-CO2(aq)at the same date as theδ13C measurements of the algae.
–FW –W R
CO2(aq) Diatoms Green Cyano Flab CO2(aq) Diatoms Green Cyano Micro Flab CO2(aq) Diatoms Green Cyano Micro
(ppmv) algae bacteria (ppmv) algae bacteria cystis (ppmv) algae bacteria cystis
12-Feb 1069.0 16.0 23.2 33.97 32.87
3-March 1246.3 29.6 25.1 756.9 32.7 27.6 435.9
24-March 1232.6 28.7 25.6 390.7 25.2 21.7 289.9 28.95 24.29 26.51
22-April 27.0 20.0 17.8 255.5 27.4 23.7 85.8 20.95 18.98
7-May 209.4 24.7 20.4 1889.0 23.0 17.1 17.6
19-May 0.7 7.5 0.8 355.4 15.6 1883.5 35.95 28.06 18.18
25-June 10152.3 27.7 24.1 2280.3 0.4 939.5 12.40 14.34 12.90
8-July 2658.2 25.0 26.8 22.3 1288.7 16.7 19.4 12.0 13.2 1368.1 15.83 20.88 25.04 18.94 5-Aug 4507.4 19.2 20.3 13.9 5.3 5515.4 25.5 24.6 22.4 20.6 7.8 101.1 14.99 14.41 18.78 16.43
1-Sep 2704.8 14.7 19.0 2461.9 21.2 18.0 17.8 8.3 132.2 14.33 20.05 13.01
29-Sep 1426.1 6.4 2283.7 22.6 20.7 15.9 17.4 707.4 16.23 21.00 14.91
25-Nov 1925.3 25.5 20.4 11.6 0.3 1391.1 19.2 13.5 18.9 1116.6 20.56 18.51 24.00 15.79
Mean 23.9 20.7 12.2 4.0 23.9 22.2 17.2 17.6 5.5 22.9 20.3 20.8 15.8
SE 1.7 1.7 4.4 1.9 1.7 0.9 1.6 1.0 2.6 2.8 2.2 1.6 1.0
Note: Epsilon values were corrected for the offset between FA and total cell carbon content, by adding 9‰ to theδ13C values (according to Pel et al., 2004a).
fell in the same range (−38.5‰ to−41.1‰) and Microcystis was similarly enriched (-33.4‰) as in -W. Finally at all sites, mean δ13C of diatoms were usually more depleted (range;
−41.1‰ to−44.4‰) than green algae (range; −38.5‰ to
−41.8‰) (Table B1a–c in Appendix B).
Phytoplankton isotope fractionation factors (ε) showed large variation in all treatments and during the season (Ta-ble 3). However, the mean fractionations for all primary pro-ducers in – FW followed the sequence diatoms (23.9±1.7)> green algae (20.7±1.7)>cyanobacteria (12.2±4.4)>flab (4.0±1.9). The same sequence was observed in the -W treat-ment with diatoms (23.9±1.7)>green algae (22.2±0.9)> cyanobacteria (17.2±1.6) and Microcystis (17.6±1.0)>flab (5.5±2.6). Annual mean fractionation factors in R also fol-lowed a similar sequence with diatoms (22.9±2.8)>green algae (20.3±2.2) and cyanobacteria (20.8±1.6)> Microcys-tis (15.8±1.0). Average fractionation factors (ε)in diatoms and green algae were rather constant between treatments, but a clear shift was detected in filamentous cyanobacteria with low values in –FW and higher values in the other two treat-ments possibly related to changes in dissolved inorganic car-bon speciation. Despite these consistent average fraction-ation patterns across treatments, there were no correlfraction-ations between dissolved inorganic carbon species (CO2, HCO−3,
CO23)and phytoplankton fractionation factors (ε).
Variation in isotope values of the zooplankton was large (Fig. 3b and Table B1a–c in Appendix B) and ANOVA re-vealed that zooplankton isotope signatures did not differ sig-nificantly within or between treatments. It is therefore dif-ficult to conclude that specific algal groups supported the zooplankton diet. However, the isotope signatures of zoo-plankton clearly reveal that most, if not all species were
gen-eralists and probably supported by a mixed diet. Simple iso-tope mass balance equation using prokaryotic and eukary-otic (average of green algae and diatoms) end member values (Fig. 3a) show that in – FW and –W zooplankton derived 64 and 69% of its carbon from eukaryotes, while in R prokary-ote resources were more important (on average only 43% of the carbon was derived from eukaryotes).
3.4 Phytoplankton growth rates
76 B. M. Bontes et al.: Isotope analysis of a biomanipulated shallow lake Fig. 3 (a) -55 -50 -45 -40 -35 -30 -25 -20 G reen a lg a e G reen a lg a e G reen a lg a e D iat om s D iat om s D iat om s Fl a b Mi cro cy st is Mi cro cy st is Fl a b F il a m .c yan ob ac te ri a F il a m .c yan ob ac te ri a F il a m .c yan ob ac te ri a δ 13C (‰ )
- FW - W R
Fig. 3 (b) -55 -50 -45 -40 -35 -30 -25 -20 δ
13C (
‰
)
- FW - W R
B o sm in id s C y cl op oi d s As p la n ch n a D a phni d s C h yd ori d s B o sm in id s C y cl op oi d s As p la n ch n a D a phni d s C h yd ori d s B o sm in id s C y cl op oi d s As p la n ch n a D a phni d s C h yd ori d s
Fig. 3. Mean rawδ13C values (‰) of (a) the main primary pro-ducers and (b) the most abundant primary consumers in the three treatments – FW, – W and R during 2003 in Terra Nova. Dots show
meanδ13C values per functional group, boxes give the 95%
confi-dence intervals and whiskers the standard deviation. Theδ13C for
all organisms is based on the C18:nFA, but for diatoms on the C20:5
FA.
Note: Filamentous cyanobacteria species such as Planktothrix and Limnothrix were separately analyzed from the cyanobacteria species Microcystis.
4 Discussion
Using a combination of fluorescence-activated cell sorting (FACS) and isotope ratio mass spectrometry (Py-GC-IRMS) we have identified differences in isotopic signatures of phy-toplankton groups (Fig. 3a). These differences in isotopes signatures at the base of a lacustrine pelagic food web would in principle have allowed us to obtain detailed information on algal-herbivore food web interactions and the effect of
biomanipulation on these relations. However, most of the examined consumers were generalists; i.e. most zooplankton appeared to rely on both prokaryotic and eukaryotic primary producers (Fig. 3b) and there were only minor differences in zooplankton resource utilisation between treatments. Be-fore discussing in detail the isotope results, it is instructive to evaluate the biomanipulation results in general.
4.1 The effect of biomanipulation on phytoplankton and zooplankton
The decrease in turbidity and Chl. a concentration as a re-sult of the fish removal in – FW has been described in other biomanipulation studies (Gulati and Van Donk, 2002; Van Donk et al., 1994). The dominant filamentous cyanobacteria (e.g. Planktothrix) with a mean Chl.aconcentration of 60µg L−1from 2000 to 2002 (Fig. A1b in Appendix A), almost
B. M. Bontes et al.: Isotope analysis of a biomanipulated shallow lake 77
Fig. 4
Growth rate green alga
e, diatoms, cyanobacteria (
μc
d
-1 )
0,00 0,05 0,10 0,15 0,20 0,25 0,30 0,35
0 10 20 30 40 50 60 70 80
0,00 0,05 0,10 0,15 0,20 0,25 0,30 0,35
12 Feb 3 Mar 24 Mar 31 Mar 15 Apr 7 May 19 May 27 May 2 Jun 10 Jun 25 Jun 8 Jul 21 Jul 5 Aug 11 Aug 18 Aug 16 Sep 25 Nov 0 10 20 30 40 50 60 70 80 0,00
0,05 0,10 0,15 0,20 0,25 0,30 0,35
0 10 20 30 40 50 60 70 80
Chl.
a
(green algae, diatoms, cyanobacteria) (
μ
g L
-1 ) A
B
C
Date
Green algae 0.13 Diatoms 0.06 Cyanobacteria 0.01
Green algae 0.08 Diatoms 0.05 Cyanobacteria 0.04
[image:9.595.132.473.64.329.2]Green algae 0.06 Diatoms 0.05 Cyanobacteria 0.06
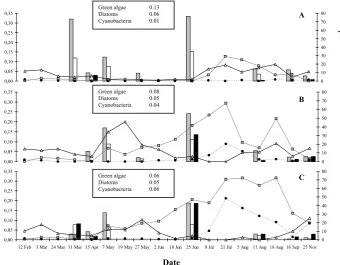
Fig. 4. Growth rates (µCd−1)and abundances of green algae, diatoms and cyanobacteria (µg Chl.aL−1). Mean growth rates∼18 and
∼24 h. after incubation are calculated as the13C incorporation into the C18:n FA of green algae (grey column) and cyanobacteria (black
column) and C20:5FA of diatoms (white column). Abundances of the green algae, diatoms and cyanobacteria are given by; the grey line
with squares, black line with triangles and dotted line with circles, respectively. Boxes represent the average seasonal growth rate (µCd−1),
per algal group, per treatment.
Evidently, nutrient reduction is just one of the key factors for (the initial) restoration to fail or to succeed. Scheffer (1998), Jeppesen et al. (1997) and Søndergaard et al. (2003) also re-ported that at comparable nutrient levels, shallow lakes may be either clear or turbid depending on biological feedbacks in the system. Most food-web interactions involved in these biological feedbacks are poorly understood and our detailed study of carbon cycling based on stable isotopes may provide some insights.
4.2 Effect of biomanipulation on ecosystem metabolism andδ13CDIC
Fish removal in – FW resulted in enormous alterations in primary productivity and carbon cycling, raising the O2and
pH and lowering the CO2level and the biomanipulated lake
shifted towards a CO2sink during some periods.
Biomanip-ulation resulted in pH increases as high as 10.4, while in the years prior to biomanipulation pH never exceeded 9 (2000– 2002; Fig. A1a in Appendix A). This conspicuous response in pH in treatment – FW was accompanied by a large in-crease in O2and a decrease in CO2. At the same time we
observed depletion (more negativeδ13C values) of the in-organic carbon source (DIC), while in treatments – W and R these parameters fluctuated less. Although heterotrophy
dominated ecosystem metabolism in all three treatments for the most part of 2003, autotrophy clearly dominated during periods with high pH, O2 and low CO2 in treatment – FW
(between 22 April and 25 June). Schindler et al. (1997), Cole et al. (2000) and Carpenter et al. (2001) reported sim-ilar reductions in CO2 following biomanipulation although
their study lakes were restocked with different species of fish or loaded with nutrients after removal of fish. Therefore, we may conclude that, also under the moderate to high TP con-ditions in Terra Nova, removal of fish temporarily changed the system to a net sink for atmospheric carbon, while un-der turbid, non-manipulated conditions the system was as a net source of carbon, consistent with observations by Cole et al. (2000).
Under high pCO2, heterotrophic conditions,δ13CDIC
usu-ally becomes lighter, because respiration addsδ13C depleted DIC (Goericke et al., 1994; Bade et al., 2004), while un-der low pCO2 conditions, as in – FW, significant increases
inδ13CDICare expected. The reasoning for the anticipated
increase in δ13CDIC is that during assimilation the (light) 12C isotope will be preferentially incorporated by autotrophs
over the (heavy)13C isotope and as a result the remaining small pool is enriched in 13C. However, two periods with decreases in δ13CDIC at low pCO2 were observed (Fig. 2b
78 B. M. Bontes et al.: Isotope analysis of a biomanipulated shallow lake the atmosphere (Herczeg and Fairbanks, 1987). The high
biomass of macroalgae and perhaps macrophytes in – FW between 8 April and 25 June, led to low CO2
concentra-tions, high pH levels and the potential for Chemically En-hanced Diffusion (CED) to take place (Bade and Cole, 2006; Wanninkhof and Knox, 1996; Herczeg and Fairbanks, 1987). During CED the reaction of atmospheric CO2with high
con-centrations of dissolved OH− dominated in the reaction to H2CO3. This reaction with OH− is known to have a large
negative fractionation (∼−15‰) opposite to the fractiona-tion observed during the reacfractiona-tion of CO2with H2O (∼+8‰)
(Craig, 1953; Peterson and Fry, 1987). In Peter Lake and other lakes found in literature sources, similar trends in neg-ativeδ13CDICvalues at high pH were described (Bade et al.,
2004; Bade and Cole, 2006). During the second period of depletion ofδ13CDICin – FW, we attribute this negative
ex-cursion to be a combined effect of CED (macrophytes cover
∼95%) and respiration of detritus (rich in12C). Higher wa-ter temperatures during that period (range 20–22◦C) may have increased respiration (Leggett et al., 1999; Rounick and Winterbourn, 1986; Rau, 1978), while at the same time a re-lease of biogenic methane from the sediment (range – 40 to – 60‰; Sierszen et al., 2004) may have depleted the DIC even further. Unfortunately, we have no data (increased bacterial abundance or DOC) to confirm or refute this.
4.3 Carbon isotopes of phytoplankton groups
The use of flow cytometric cell sorting combined with pyrol-ysis IRMS allowed us to detect differences between the iso-topic signatures of the primary producers and different treat-ments (Fig. 3a). However, large temporal fluctuations com-plicated the overall picture and lowered the statistical signif-icance. Flabδ13C was more enriched (positive) compared to diatoms and green algae in – FW and compared to all phy-toplankton groups in – W (Fig. 3a). Diatoms were more de-pleted than green algae, which were in turn both more neg-ative than cyanobacteria in – FW and –W (and Microcystis in –W), but not in R (Table B1a, b, and c in Appendix B). Microcystis in R was heavier than the other phytoplankton groups. In contrast, Pel et al. (2003) found in the neigh-bouring Lake Loosdrecht that cyanobacteria were far more depleted than green algae and diatoms, while Boschker et al. (2005) found that diatoms were more enriched than green algae in the upper part of the Scheldt estuary. Since phy-toplankton group-specific stable isotope signatures are not yet widely available for natural populations we do not know whether the variability observed in this study and between this study, Pel et al. (2003) and Boschker et al. (2005) is a general phenomena. Recently, Finlay (2004) reported sig-nificant seasonal and spatial variability in periphytonδ13C signatures in lotic ecosystems. Such variability complicates food-web studies based on stable isotope techniques and re-quires new research to identify and quantify the controlling factors.
The variation in δ13C signature of the algae, may be a consequence of several factors including: the inorganic car-bon species taken up (CO2, HCO−3), concentration andδ13C
value of the C source, the specific growth rate (function of temperature, light, nutrients), cell geometry (cell permeabil-ity, cell size), C uptake kinetics (diffusion vs. active uptake) and the photosynthetic pathway (Laws et al., 1995; Peterson and Fry, 1987). Isotope fractionation models consider CO2
as the substrate and predict a linear relationship between the ratio of growth rate (µc)and carbon dioxide concentration (Laws et al., 1995). Although correlations between ε val-ues on the one hand and CO2(e.g. Finlay, 2004) orµc/CO2
(e.g. Laws et al., 1995; Boschker et al., 2005) on the other hand have been reported, there are observations contradict-ing this (e.g. Laws et al., 1997; Keller and Morel, 1999). Correlation analysis of Terra Nova data (Table 3) revealed that there were no systematic relationships betweenεvalues and CO2.
Mean epsilons for diatoms (range 22.9–23.9) and green al-gae (range 20.3–22.2) were rather constant and independent of treatment (– FW, – W or R) and/or growth rate, suggest-ing that the algae in these groups were fixsuggest-ing CO2, via the
expected C3photosynthetic pathway and representing
frac-tionation via Rubisco (ε≈25–29‰; Goericke et al., 1994). The epsilon for flab (macroalgae), also based on the C18:n FA, was≈4‰. This observation of very low fractionation is consistent with studies describing “boundary-layer diffu-sion resistance” in sedentary or benthic organisms. Under low turbulent conditions unstirred layers, enriched in 13C, form around the surface cells of sedentary organisms, forc-ing these cells to take up proportionally more13C than12C (LaZerte and Szalados, 1982; Goericke et al., 1994; France and Catanneo, 1998). On the contrary, meanεof cyanobac-teria showed more variability between treatments; ranging from 12.2 to 17.2 to 20.8 from –FW to R. These differences in isotope fractionation can be related to a number of fac-tors. First, differences in growth rates of the cyanobacte-ria in the different locations might have caused differences inε. However, we would then expect fractionation to de-crease as growth rate inde-creased, while the results showed that growth rates (Fig. 4) andε both increased from – FW (µc (d−1)=0.01; 0.04 and 0.06 from – FW to R). Second, differences in CO2availability between – FW, – W and R,
may have played a significant part in the variance inε be-tween the algal groups. While the eukaryotic algae fixed CO2
via the C3 pathway (Rubisco), cyanobacteria (Microcystis)
might have additionally utilized bicarbonate via carboxyla-tion with decreased fraccarboxyla-tionacarboxyla-tion. This fixacarboxyla-tion pathway is used by phototrophic organisms adapted to CO2limitations,
such as cyanobacteria, under CO2limiting conditions
(Go-ericke et al., 1994). And finally, the relative importance of CO2uptake and active HCO−3 uptake by cyanobacteria, as
a consequence of the differences in CO2 availability in the
B. M. Bontes et al.: Isotope analysis of a biomanipulated shallow lake 79 2004; Keller and Morel, 1999). Assuming that the overall
fractionation of cyanobacteria growing on CO2would be the
same as that of green algae and diatoms (∼21‰) and follow-ing the approach of Keller and Morel (1999) and Cassar et al. (2004), we propose the relation: ε=21–21.3*fa, where fa is the fraction of HCO−3 that is actively taken up and the de-pendency –21.3 comes from Eq. (8) of Cassar et al. (2004). If fa = 0, there is no active bicarbonate uptake andε=21 due to passive CO2 uptake (like for diatoms and green algae).
If fa>0 then some bicarbonate is taken up actively. On the basis of this relationship we estimate that cyanobacteria ac-tively took up∼50% in – FW, ∼25% in – W and nothing in R. This CO2availability dependence is rather uncertain,
because it is based on marine phytoplankton (Phaedactylum tricornutum), and adopting another value (e.g. −10 rather
−21.3) would change the actual estimate of active uptake, but not our conclusion that active uptake of bicarbonate by cyanobacteria under low pCO2may explain our results.
4.4 Carbon isotopes of zooplankton
One of our aims was to determine whether fish removal would shift food preferences in zooplankton species. How-ever variability in isotope signatures of zooplankton as well as phytoplankton was rather high, complicating the use of δ13C to resolve consumer diet sources, and therefore we mainly focussed on understanding the variation in theδ13C of the sources. Nonetheless some conclusions can be drawn from the consumer isotope results; except the enrichedδ13C of Chydorus and depletedδ13C of Asplanchna in – FW, most consumers seemed generalists and isotope signatures largely overlapped between species and treatments. However, sim-ple mass balance calculations indicate that zooplankton pre-ferred eukaryotes over cyanobacteria in the lakes – FW and – W (64 and 69% of its carbon came from eukaryotes), while in the reference area cyanobacteria accounted for more than 50% of the isotope signature of the zooplankton. In – FW, green algae grew faster than diatoms, which grew faster than cyanobacteria. Since this is not reflected in the biomass of the algal groups (Fig. 4), we attribute this to preferential graz-ing on green algae and small diatoms. The observed prefer-ence for eukaryotic algae by zooplankton is consistent with that reported by Pel et al. (2003). In Lake Loosdrecht they found that zooplankton largely relied on eukaryotic algae de-spite the abundance of cyanobacterial-derived carbon. Gu-lati and deMott (1997) also showed that diatoms and phyto-flagellates formed high-quality food sources for various zoo-plankton. The relative enrichedδ13C of Chydorus sp. might imply that this species may have grazed upon cyanobacteria, as did Euchlanis in Lake Loosdrecht (Pel et al., 2003). Alter-natively, considering its semi-benthic habitat, Chydorus may have fed on an enriched food source near the bottom (benthic algae or epiphyton). The depletedδ13C value of the large ro-tifer Asplanchna, in – FW, might reflect a preference for the depleted green algae and diatoms, consistent with data on
As-planchna and Brachionus in Pel et al. (2003). Alternatively, the depleted values of Asplanchna may be related to their exploitation of another food source such asµ-algae (Pel et al., 2003), for which we do not have isotope data. However, considering the stable isotopic values and the abundance of algae, rotifers and copepods, we hypothesize that these very abundant small (µ) green algae may have formed an im-portant food source for the small rotifers (e.g. Brachionus), which were subsequently preyed upon by the Asplanchna or copepods.
Although our study provides an unprecedented level of de-tail in the isotopic signatures of the primary producers, the food web structure became not completely clear. This is due to a number of factors, (1) the wide range and variability of primary producers δ13C values lowered the resolution, (2) multiple food substrates were consumed (omnivory) indicat-ing that the food web was not structured in a linear fashion and generalist consumers prevailed (Kerner et al., 2004) and (3) some important food sources such as µ-algae and het-erotrophic bacteria have been overlooked.
5 Summary and conclusions
Biomanipulation of the shallow Terra Nova followed the ex-pectations with respect to increases of transparency, macro-phyte settlement and decreases in abundance of phytoplank-ton, but zooplankton numbers did not increase. Fish removal led, at least during late spring/early summer, to increased pri-mary productivity which in turn caused low CO2, high O2
concentrations and anomalous negativeδ13CDICvalues due
to chemical enhancement of CO2diffusion at high pH
lev-els. This seems a more general phenomenon at high levels of primary productivity, as it has been observed in the bioma-nipulated Peter Lake as well (Bade et al., 2004). Removal of fish resulted in enhanced growth of green algae and diatoms at the expense of cyanobacteria. Large variations in isotope values within and between the plankton species made it diffi-cult to draw strong conclusions, but from differences in CO2
concentrations and mean fractionation data of the different primary producers in the three treatments it appeared that at least in – FW and – W, green algae and diatoms fixed CO2,
80 B. M. Bontes et al.: Isotope analysis of a biomanipulated shallow lake
Appendix A
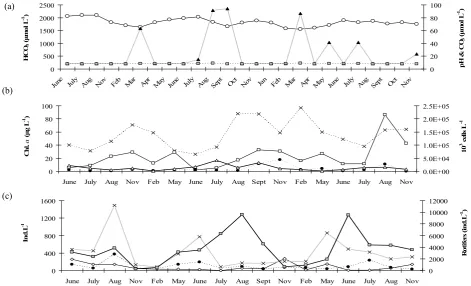
Appendix A. Abiotic and biotic parameters measured in the reference area (R) of Terra Nova, 3 years prior to biomanipulation (a) pH
(squares), HCO3 (circles) and CO3 (triangles) concentrations (μmol L-1); (b) Chl. a (μg L-1) (crosses) and concentrations (103 cells L-1)
of diatoms (circles), green algae (triangles) and cyanobacteria (squares) (c) densities of rotifers (squares; scaled on the right y-axis),
nauplii larvae (crosses), copepods (circles) and crustaceans (diamonds) scaled on the left y-axis (ind.L-1).
(a)
(b)
(c)
0 500 1000 1500 2000 2500
June July Aug Nov Feb Mar Apr May June July Aug Sept Oct Nov Jan Feb Mar Apr May June July Aug Sept Oct Nov
HC
O3
(
μ
mo
l L
-1)
0 20 40 60 80 100
pH
&
C
O3
(
μ
mo
l L
-1 )
0 20 40 60 80 100
June July Aug Nov Feb May June July Aug Sept Nov Feb May June July Aug Nov
Ch
l.
a
(
μ
g L
-1)
0.0E+00 5.0E+04 1.0E+05 1.5E+05 2.0E+05 2.5E+05
10
3 ce
lls
L
-1
0 400 800 1200 1600
June July Aug Nov Feb May June July Aug Sept Nov Feb May June July Aug Nov
Ind.
L
-1
0 2000 4000 6000 8000 10000 12000
R
oti
fe
rs
(i
n
d
.L
[image:12.595.62.534.238.524.2]-1)
Fig. A1. Abiotic and biotic parameters measured in the reference area (R) of Terra Nova, 3 years prior to biomanipulation (a) pH (squares),
HCO3 (circles) and CO3 (triangles) concentrations (µmol L−1); (b) Chl.a (µg L−1)(crosses) and concentrations (103 cells L−1)of
diatoms (circles), green algae (triangles) and cyanobacteria (squares) (c) densities of rotifers (squares; scaled on the right y-axis), nauplii
B. M. Bontes et al.: Isotope analysis of a biomanipulated shallow lake 81
[image:13.595.45.548.150.677.2]Appendix B
Table B1. Temporal variation in the rawδ13C values (‰) of the C18:nFA value for green algae, cyanobacteria (Microcystis), flab and all
assessed zooplankton species and the C20:5FA for diatoms in (a) – FW (b) – W and (c) R and theδ13C of the CO2(aq)source.
Date Diatoms
Green-algae
Cyano-bacteria
Micro-cystis
Flab Bosmina Cyclopoids Asplanchna Daphnids Chydorids CO2 (aq)
DIC
12-Feb −47.2 −48.3 −9.9 −1.3
3-March −47.7 −43.1 −39.8 −38.4 −9.0 -0.3
24-March −45.8 −42.7 −41.8 −8.1 0.1
22-April −42.4 −40.2 −37.7 −38.0 −34.6 −13.4 −4.7
7-May −48.7 −44.4 −14.9 −6.2
19-May −33.3 −26.6 −33.8 −16.8 −9.0
2-June −30.9 −39.5 −27.9 −22.6 −14.8
25-June −48.8 −45.2 −38.7 −40.6 −38.5 −12.0 −6.7
8-July −42.8 −44.6 −40.1 −36.3 −43.1 −42.9 −8.8 −0.9
5-Aug −38.0 −39.2 −32.8 −24.2 −40.0 −40.9 −9.8 −2.6
1-Sep −38.0 −42.3 −40.5 −34.0 −14.3 −6.6
29-Sep −31.5 −31.6 −16.0 −8.2
25-Nov −47.9 −42.8 −34.1 −22.7 −39.8 −37.9 −49.1 −13.4 −5.7
Mean −44.4 −41.8 −33.4 −27.3 −39.3 −38.5 −43.8 −42.3 −33.7 −13.0 −5.1
SE 1.4 1.1 2.8 3.8 0.5 1.3 2.2 0.5 2.2 1.1 1.2
(b)
Date Diatoms Green
algae
Cyano bacteria
Micro-cystis
Flab Bosmina Cyclopoids Asplanchna Daphnids Chydorids CO2 (aq)
DIC
12-Feb −35.1 −42.3 −42.2 −46.9 −43.6 −10.1 −1.5
3-March −47.7 −42.6 −39.5 −40.4 −35.8 −6.0 2.8
24-March −39.5 −36.0 −33.1 −48.9 −38.5 −5.3 3.4
22-April −44.1 −40.4 −34.2 −35.0 −35.6 −7.6 1.1
7-May −40.7 −34.9 −35.4 −8.8 −0.7
19-May −35.8 −38.2 −36.8 −11.3 −2.5
2-June −21.5 −36.3 −36.1 −35.3 −36.7 −12.1 −3.4
25-June −37.8 −40.5 −33.0 −34.2 −40.9 −39.2 −12.1 −4.1
8-July −40.2 −39.3 −37.1 −35.3 −22.5 −39.3 −37.2 −37.9 −5.7 2.7
5-Aug −36.9 −33.7 −33.5 −24.0 −40.9 −44.2 −39.6 −6.7 0.3
1-Sep −42.6 −40.7 −35.9 −37.4 −39.4 −40.8 −39.8 −11.0 −3.1
29-Sep −38.6 −32.9 −38.3 −42.5 −10.4 −2.7
25-Nov −46.5 −46.4 −43.4 −43.6 −39.3 −47.8 −41.8 −11.7 −3.6
Mean −41.6 −39.9 −36.0 −35.7 −22.7 −38.1 −40.3 −41.1 −38.5 −38.6 −9.1 −0.9
SE 1.4 1.0 1.4 0.8 0.7 1.8 1.0 1.8 1.1 0.9 0.7 0.7
(c)
Date Diatoms Green
algae
Cyano bacteria
Micro-cystis
Flab Bosmina Cyclopoids Asplanchna Daphnids Chydorids CO2 (aq)
DIC
12-Feb −50.1 −49.0 −46.4 −7.1 1.5
3-March
24-March −46.7 −42.1 −44.3 −39.7 −36.6 −42.3 −8.8 −0.1
22-April −38.7 −36.7 −35.2 −34.4 −32.2 −31.1 −33.2 −8.7 0.1
7-May −56.4 −48.5 −38.6 −43.5 −47.9 −40.9 −43.7 −11.4 −3.1
19-May −33.5 −38.6 −36.9 −36.5 −32.0 −13.2 −4.5
2-June −34.0 −36.0 −34.5 −40.6 −36.5 −12.6 −4.1
25-June −33.3 −38.4 −42.5 −36.4 −39.5 −32.6 −38.1 −36.2 −8.5 −0.1
8-July −32.0 −31.5 −35.8 −33.5 −31.1 −34.6 −8.1 0.7
5-Aug −32.9 −38.7 −31.6 −36.5 −9.6 −0.8
1-Sep −34.2 −39.0 −32.9 −38.0 −37.1 −36.7 −38.0 −9.0 −0.4
29-Sep −37.6 −35.5 −41.0 −32.8 −40.5 −39.1 −41.8 −40.3 −8.0 0.4
25-Nov −46.7 −42.1 −44.3 −39.7 −36.6 −42.3 −8.8 −0.1
Mean −41.1 −38.5 −39.3 −33.4 −39.7 −36.4 −39.9 −36.2 −36.8 −9.5 −0.9
82 B. M. Bontes et al.: Isotope analysis of a biomanipulated shallow lake
Acknowledgements. We thank G. ter Heerdt of the Municipal Waterworks of Amsterdam for providing additional data and
inviting us to participate in the experimental setup. A. Bak,
G. Bonhoff, V. Correa de la Torre are thanked for sampling and H. Hoogveld and K. Siewertsen for providing flow cytometer and zooplankton data. This publication is a contribution to OBN – Restoration and Management of Dutch Peat lakes, financed by the Ministry of Agriculture, Nature and Fisheries in the Netherlands; a collaboration between the Universities of Nijmegen and Utrecht and the Centre for Limnology of the Netherlands Institute of Ecology. This is publication 3764 of the Netherlands Institute of Ecology (NIOO-KNAW).
Edited by: T. J. Battin
References
Bade, D. L., Carpenter, S. R., Cole, J. J., Hanson, P. C., and
Hesslein, R. H.: Controls of δ13C-DIC in lakes:
Geochem-istry, Lake metabolism and Morphometry, Limnol. Oceanogr., 49, 1160–1172, 2004.
Bade, D. L. and Cole, J. J.: Impact of chemically enhanced dif-fusion on dissolved inorganic carbon stable isotopes in a fer-tilized lake, J. Geophys. Res.-Oceans, 111, art. no. C01014, doi:10.1029/2004JC002684, 2006.
Baird, M. E., Emsley, S. M., and McGlade, J. M.: Using a phy-toplankton growth model to predict the fractionation of stable carbon isotopes, J. Plankton Res., 23, 841–848, 2001.
Blokker, P., Pel, R., Akoto, L., Brinkman, U. A., and Vreuls, J. J.: At-line gas chromatographic-mass spectrometric analysis of FA profiles of green micro-algae using a direct thermal desorption interface, J. Chromatogr., 959, 191–201, 2002.
Boschker, H. T. S. and Middelburg, J. J.: Stable isotopes and biomarkers in microbial ecology, FEMS Microbiol. Ecol., 40, 85–95, 2002.
Boschker, H. T. S., Kromkamp, J. C., and Middelburg, J. J.: Biomarker and carbon isotopic constraints on bacterial and algal community structure and functioning in a turbid, tidal estuary, Limnol. Oceanogr., 50, 70–80, 2005.
Carpenter, S. R., Cole, J. J., Hodgson, J. R., Kitchell, J. F., Pace, M. L., Bade, D., Cottingham, K. L., Houser, J. N., and Schindler, D. E.: Trophic cascades, nutrients, and lake productivity: whole-lake experiments, Ecol. Monogr., 71, 163–186, 2001.
Cassar, N., Laws, E. A., Bidigare, R. R., and Popp, B. N.: Bicar-bonate uptake by Southern Ocean phytoplankton, Global Bio-geochem. Cycles, 18, art. no. GB2003, 2004.
Chorus, I. and Bartram, J.: Cyanobacteria in the environment; orga-nization, function and behaviour In Toxic cyanobacteria in water, WHO, England, 1999.
Cole, J. J., Pace, M. L., Carpenter, S. R., and Kitchell, J. F.: Persis-tence of net heterotrophy in lakes during nutrient addition and food web manipulations, Limnol. Oceanogr., 45, 1718–1730, 2000.
Craig, H.: The geochemistry of the stable carbon isotopes,
Geochim. Cosmochim. Acta, 3, 53–92, 1953.
Finlay, J. C.: Patterns and controls of lotic algal stable carbon iso-tope ratios. Limnol. Oceanogr., 49, 850–861, 2004.
France, R. and Cattaneo, A.:δ13C variability of benthic algae:
ef-fects of water colour via modulation by stream current.
Freshwa-ter Biol., 39, 617–622, 1998.
Freeman, K. H. and Hayes, J. M.: Fractionation of carbon isotopes
by phytoplankton and estimates of ancient CO2levels, Global
Biogeochem. Cycles, 6, 185–198, 1992.
Goericke, R., Montoya, J. P., and Fry, B.: Physiology of isotopic fractionation in algae and cyanobacteria, pp. 187–221, in: Stable isotopes in ecology, edited by: Lajitha, K. and Michener, B., Blackwell Sci. Publ. Inc., Cambridge, 1994.
Gons, H. J., Burger-Wiersma, T., Otten, J. H., and Rijkeboer, M.: Coupling of phytoplankton and detritus in a shallow, eutrophic lake (Lake Loosdrecht, The Netherlands), Hydrobiologia, 233, 51–59, 1992b.
Gulati, R. D. and DeMott, W. R.: The role of food quality for zoo-plankton: remarks on the state-of-the-art, perspectives and prior-ities, Freshwater Biol., 38, 753–768, 1997.
Gulati, R. D. and van Donk, E.: Lakes in the Netherlands, their ori-gin, eutrophication and restoration: state-of-the-art review, Hy-drobiologia, 478, 73–106, 2002.
Herczeg, A. L. and Fairbanks, R. G.: Anomalous carbon
iso-tope fractionation between atmospheric CO2and dissolved
inor-ganic carbon induced by intense photosynthesis, Geochim. Cos-mochim. Acta, 51, 895–899, 1987.
Hosper, H. and Meijer, M.: Biomanipulation, will it work for your lake? A simple test for the assessment of chances for clear water, following drastic fish-stock reduction in shallow, eutrophic lakes, Ecol. Eng., 2, 63–72, 1993.
Jeppesen, E., Jensen, J. P., Søndergaard, M., Lauridsen, T., Ped-ersen, L. J., and Jensen, L.: Top-down control in freshwater lakes, the role of nutrient state, submerged macrophytes and wa-ter depth, Hydrobiologia, 342/343, 151–164, 1997.
Keller, K. and Morel, F. M. M.: A model of carbon isotopic frac-tionation and active carbon uptake in phytoplankton, Mar. Ecol. Prog. Ser., 182, 295–298, 1999.
Keough, J. E., Sierzen, M., and Hagley, C.: Analysis of a Lake Su-perior coastal food web with stable isotopes, Limnol. Oceanogr., 41, 136–146, 1996.
Kerner, M., Ertl, S., and Spitzy, A.: Trophic diversity within the planktonic food web of the Elbe Estuary determined on isolated
individual species by13C analysis, J. Plankton Res., 26, 1039–
1048, 2004.
Kling, G. W., Fry, B., and O’Brien, W. J.: Stable isotopes and planktonic trophic structure in arctic lakes, Ecology, 73, 561– 566, 1992.
Kott, P.: Modified whirling apparatus for sub sampling of plankton, Aust. J. Mar. Freshwater Res., 4, 387–393, 1953.
Laws, E. A., Popp, B. N., Bidigare, R. R., Kennicutt, M. C., and Macko, S. A.: Dependence of phytoplankton carbon isotopic
composition on growth rate and [CO2)aq]: Theoretical
consid-erations and experimental results, Geochim. Cosmochim. Acta, 59, 1131–1138, 1995.
Laws, E. A., Bidigare, R. R., and Popp, B. N.: Effect of growth rate
and CO2concentration on carbon isotopic fractionation by the
marine diatom Phaeodactylum tricornutu, Limnol. Oceanogr., 42, 1552–1560, 1997.
LaZerte, B. D. and Szalados, J. E.: Stable carbon isotope of sub-merged freshwater macrophytes, Limnol. Oceanogr., 27, 413– 418, 1982.
car-B. M. Bontes et al.: Isotope analysis of a biomanipulated shallow lake 83
bon isotope signatures of Lake Ontario biota, Can. J. Fish Aquat. Sci., 56, 2211–2218, 1999.
Meijer, M., de Boois, I., Scheffer, M., Portielje, R., and Hosper, H.: Biomanipulation in shallow lakes in the Netherlands: an evalua-tion of 18 case studies, Hydrobiologia, 408/409, 13–30, 1999. Middelburg, J. J., Barranguet, C., Boschker, H. T. S., Herman, P.
M. J., Moers, T., and Heip, C. H. R.: The fate of intertidal
mi-crophytobenthos carbon: An in situ13C-labeling study, Limnol.
Oceanogr., 45, 1224–1234, 2000.
Miyajima, T., Yamada, Y., and Hanba, Y. T.: Determining the stable isotope ratio of total dissolved inorganic carbon in lake water by GC/C/IRMS, Limnol. Oceanogr., 40, 994–1000, 1995.
Mook, W. G., Bommerson, J. C., and Staverman, W. H.: Carbon isotope fractionation between dissolved bicarbonate and gaseous carbon dioxide, Earth Planet. Sci. Lett., 22, 169–176, 1974. Pace, M. L., Cole, J. J., Carpenter, S. R., Kitchell, J. F., Hodgson,
J. R., Van de Bogert, M. C., Bade, D. L., Kritzberg, E. S., and Bastviken, D.: Whole-lake carbon-13 additions reveal terrestrial support of aquatic food webs, Nature, 427, 240–243, 2004. Pel, R., Hoogveld, H., and Floris, V.: Using the hidden isotopic
heterogeneity in phyto- and zooplankton to unmask disparity in trophic carbon transfer, Limnol. Oceanogr., 48, 2200–2207, 2003.
Pel, R., Floris, V., and Hoogveld, H.: Analysis of planktonic com-munity structure and trophic interactions using refined isotopic signatures determined by combining fluorescence-activated cell sorting and isotope-ratio mass spectrometry, Freshwater Biol., 49, 546–562, 2004a.
Pel, R., Floris, V., Gons, H. J., and Hoogveld, H. L.: Linking
flow cytometric cell sorting and compound-specific13C-analysis
to determine population-specific isotopic signatures and growth rates in cyanobacteria-dominated lake plankton, J. Phycol., 40, 857–866, 2004b.
Petersen, C. G. J.: The yearly immigration of young plaice into the Limfjord from the German Sea, Rep. Dan. Biol. Stn., 6, 1–48, 1896.
Peterson, B. J. and Fry, B.: Stable isotopes in ecosystem studies, Annu. Rev. Ecol. Syst., 18, 293–320, 1987.
Prieto, F. J. and Millero, F. J.: The values of pK1+ pK2for the
dissociation of carbonic acid in seawater, Geochim. Cosmochim. Acta, 66, 2529–2540, 2002.
Rau, G. H.: Carbon-13 depletion in a subalpine lake: carbon flow implications, Science, 201, 901–902, 1978.
Rounick, J. S. and Winterbourn, M. J.: Stable carbon isotopes and carbon flow in ecosystems, Bioscience, 36, 171–177, 1986. Scheffer, M.: Ecology of Shallow Lakes, Chapman & Hall, London,
1998.
Schindler, D. E., Carpenter, S. R., Cole, J. J., Kitchell, F., and Pace, M. L.: Influence of food web structure on carbon exchange be-tween lakes and the atmosphere, Science, 277, 248–251, 1997. Sierszen, M. E., Morrice, J. A., Moffett, M. F., and West, C. W.:
Benthic versus planktonic foundations of three Lake Superior coastal wetland food webs, J. Great Lakes Res., 30, 31–43, 2004. Søndergaard, M., Jensen, J. P., and Jeppesen, E.: Role of sediment and internal loading of phosphorus in shallow lakes, Hydrobiolo-gia, 506–509, 135–145, 2003.
Steiner, C. F.: Daphnia dominance and zooplankton community structure in fishless lakes, J. Plankton Res., 26, 799–810, 2004. Van den Meersche, K., Middelburg, J. J., Soetaert, K., van Rijswijk,
P., Boschker, H. T. S., and Heip, C. H. R.: Carbon-nitrogen coupling and algal-bacterial interactions during an experimental
bloom: Modeling a13C-tracer experiment, Limnol. Oceanogr.,
49, 862–878, 2004.
Van Donk, E., Grimm, M. P., Heuts, P. G. M., Blom, G., Everards, K., and Van Tongeren, O. F. R.: Use of mesocosms in a shallow eutrophic lake to study the effects of different restoration mea-sures, Arch. Hydrobiol., 40, 283–294, 1994.
Veuger, B., Middelburg, J. J., Boschker, H. T. S., and Houtekamer,
M.: Analysis of 15N incorporation into D-alanine: A new
method for tracing nitrogen uptake by bacteria, Limnol. Oceanogr. Methods, 3, 240–250, 2005.
Wanninkhof, R. and Knox, M.: Chemical enhancement of CO2