Ann. Geophys., 29, 1479–1489, 2011 www.ann-geophys.net/29/1479/2011/ doi:10.5194/angeo-29-1479-2011
© Author(s) 2011. CC Attribution 3.0 License.
Annales
Geophysicae
Invariability of relationship between the polar cap magnetic activity
and geoeffective interplanetary electric field
O. A. Troshichev, N. A. Podorozhkina, and A. S. Janzhura
Arctic and Antarctic Research Institute, St. Petersburg, 199397, Russia
Received: 7 February 2011 – Revised: 18 July 2011 – Accepted: 19 July 2011 – Published: 31 August 2011
Abstract. The PC (polar cap) index characterizing the solar wind energy input into the magnetosphere is calculated with use of parametersα,β, andφ, determining the relationship between the interplanetary electric field (EKL) and the value
of magnetic activityδF in the polar caps. These parameters were noted as valid for large and smallEKL values, and as
a result the suggestion was made (Troshichev et al., 2006) that the parameters should remain invariant irrespective of solar activity. To verify this suggestion, the independent sets of calibration parameters α, β, and φ were derived sepa-rately for the solar maximum (1998–2001) and solar mini-mum (1997, 2007–2009) epochs, with a proper choice of a quiet daily variation (QDC) as a level of reference for the po-lar cap magnetic activity value. The results presented in this paper demonstrate that parametersα,β, andφ, derived under conditions of solar maximum and solar minimum, are indeed in general conformity and provide consistent (within 10 % uncertainty) estimations of the PC index. It means that rela-tionship between the geoeffective solar wind variations and the polar cap magnetic activity responding to these variations remains invariant irrespective of solar activity. The conclu-sion is made that parametersα,β, andφderived in AARI#3 version for complete cycle of solar activity (1995–2005) can be regarded as forever valid.
Keywords. Interplanetary physics (Interplanetary magnetic fields) – Magnetospheric physics (Polar cap phenomena; So-lar wind-magnetosphere interactions)
1 Introduction
The PC index was introduced (Troshichev and Andrezen, 1985; Troshichev et al., 1988) to characterize magnetic ac-tivity in the polar caps caused by the solar wind coupling
Correspondence to: O. A. Troshichev
with the magnetosphere. The concept of the DP2 distur-bances (type 2 of polar magnetic disturdistur-bances unrelated to substorms) controlled by the geoeffective interplanetary elec-tric field (Troshichev, 1982) served as a basis for the method of the index calculation. Relation of the 15-min PC index to the auroral electrojet indices AL and AU (characterizing the value of maximal negative, i.e. “lower”, and positive, i.e. “upper”, magnetic disturbances in the auroral zone) and AE (AU minus AL) was examined by Vennerstrom (1991) and Vennerstrom et al. (1991). Subsequently, a unified pro-cedure was elaborated for derivation of the 1-min PCN and PCS indices (in the northern and southern polar caps, re-spectively) calculated by magnetic data from the Southern (Vostok station, Antarctica) and Northern (Thule station, the present name is Qaanaaq, Greenland) Hemispheres, respec-tively (Troshichev et al., 2006; Stauning et al., 2006). The unified PC index properly responds not only to the influ-ence of the interplanetary electric field (EKL)expressed by
formula derived by Kan and Lee (1979), but also to the so-lar wind dynamic pressure pulses, irrespective of UT time, season, and location of stations in the Northern or Southern Hemispheres (Troshichev et al., 2007).
While analysing the unified procedure it was noted (Troshichev et al., 2006) that parametersα,β, andφ, deter-mining the relationship betweenEKLand the polar cap
mag-netic activityδF, are irrespective of values of these quanti-ties, i.e. they are valid for low and large EKL magnitudes.
It made it possible to conclude that parametersα,β, andφ should be invariant in course of the solar cycle (Troshichev et al., 2006). The parametersα, β, andφ derived for full cycle of solar activity (1995–2005) were used in the proce-dure adopted in the Arctic and Antarctic Research Institute for the unified PC index derivation (the procedure known as AARI#3 version, according to nomenclature proposed by McCreadie and Menvielle, 2010).
et al., 2007; Troshichev et al., 2007, 2011; Troshichev and Janzhura, 2009). These analyses clearly demonstrated that the PC growth always preceded the magnetic disturbances, that substorms onset and magnetic storms beginnings occur when the PC value exceeds the defined threshold level of ∼2 mV m−1, that the intensity and variation of substorms are determined by the PC growth rate, that the storm magnitude (Dst peak) is proportional to the average PC value during the growth phase, and so on. These experimental facts testify that the PC index can be regarded as a reliable ground-based indicator of the solar wind energy that entered into the mag-netosphere.
To verify the suggestion that parametersα,β, and φ de-rived for full cycle of solar activity are valid equally for periods of low and high solar activity, it would be well to compare parametersα,β, andφ derived independently for epochs of solar minimum and solar maximum. The passage of solar activity through the deep minimum in 2007–2009 made it possible to fulfill such analysis. In this paper we derive the parametersα, β, and φ for the solar minimum epoch (1997, 2007–2009) and show their good conformity with the parameters derived for the solar maximum epoch activity (1998–2001). The analysis is preceded by demon-stration of the crucial role of the quiet daily curve (QDC) as a level of reference for the polar cap magnetic activity in determination of parametersφ,α, andβ.
2 Peculiarities of the unified procedure for derivation of the PC index
The idea behind the PC index is to use only ground based data with the once derived normalization coefficients to mon-itor the geoeffective impact of the solar wind on the magneto-sphere. The normalization coefficientsαandβwere derived as the statistically justified regression coefficients that con-nect values of the interplanetary electric fieldEKL and the
appropriate magnetic DP2 disturbance valueδF in different UT times and different days during a year:
δFφ(k)=αEKL(k)+β (1)
where theδF (k)is value of theδFφ(k)vector mapped on the DP2 direction fork-th moment of time. The vectorsδFφ(k) are calculated by the horizontal magnetic disturbances (δH, δD) or (δX,δY) counted from the quiet daily curve varia-tion. The vectorsδFφ(k)are rotated by an angleφto assign them with the DP2 equivalent current system and then the corresponding valueδF (k)is calculated.EKL(k)is the
inter-planetary electric field calculated fork-th moment from the formula of Kan and Lee (1979) by the satellite measurements of the solar wind parameters in space, shifted to 12RE.
Thus, the technique for the coefficients calculation in-cluded the following steps:
– Determination of the magnetic disturbance vector δFφ(k)for eachk-th moment of time,
– Definition of angle φ determining the δFφ(k) vector projection on the DP2 direction,
– Determination of the appropriate polar cap magnetic DP2 disturbance valueδF (k),
– Determination of the electric field value EKL(k) for
eachk-th moment of time,
– Derivation of the statistically justified coefficientsαand β, determining the relationship betweenEKLandδF.
The linear regression coefficientsα andβ were derived by the linear relation (1) for each 5-min k-th interval of data forming the “learning” data-set (in our case – 1997, 2007– 2009). The coefficientsαandβ were calculated for all an-glesφin range±90◦from the suggested dawn-dusk orienta-tion of the DP2 disturbance vectors in the near-pole region. When the correlation coefficient reaches the maximum, just that angleφ was chosen and the appropriate coefficientsα andβ were taken for that UT time and month. To elimi-nate random oscillations, the 5-min values were subjected to a 6-point running locally weighted scatterplot smoothing (LOWESS) that is resistant to outliers; the 6-point smoothed values were then averaged for 4 years (1997, 2007–2009). As a result, the averaged 1-min parametersα,β, andφwere derived for each UT time during a year. These parameters are used to calculate the PC indices for any time through any day of the year:
PC=ξ(δF−β)/α (2)
The dimensionality of scale coefficient ξ was taken as mV/m/nT in the unified procedure (Troshichev et al., 2006), so that the PC index is expressed in mV m−1, which makes it
convenient to compare withEKL.
In the AARI#3 procedure the quiet daily geomagnetic variation – “quiet day curve” (QDC) – is calculated auto-matically in the on-line regime for both polar cap stations of Thule and Vostok. An automatic method for the QDC derivation is described in detail in Janzhura and Troshichev (2008). The method includes the automatic distinction of the quietest periods while using the geomagnetic variations pa-rameterization, calculation of the proper quiet daily variation for certain days, reconstruction of QDC for each day of the elapsed period, and extrapolation of QDC for the subsequent period. The method ensures statistically reliable QDCs even for epochs of the solar maximum activity, when fully quiet days are practically absent. The second peculiarity of the procedure adopted in AARI is allowance for the interplane-tary magnetic field (IMF) sector structure (SS). The SS influ-ence, determined by theByIMF component, leads to regular
O. A. Troshichev et al.: Relationship between polar cap magnetic activity and interplanetary electric field 1481
(a)
(b)
[image:3.595.156.446.62.592.2](c)
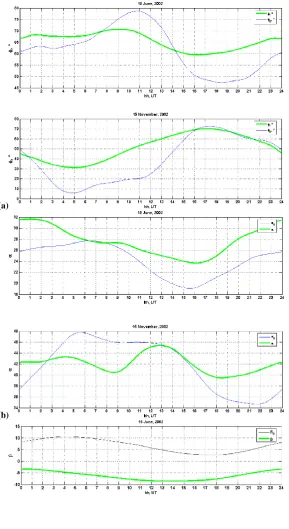
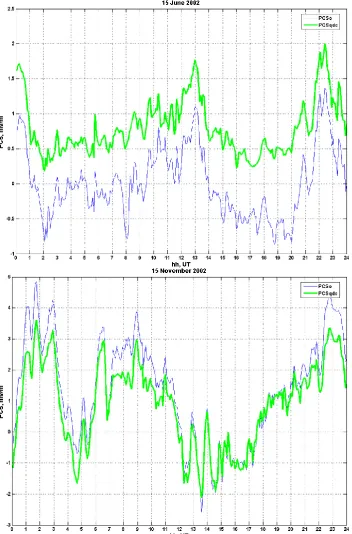
Fig. 2. PCSQDCindices calculated for 15 June and 15 November 2002 with a QDC (thick lines) and PCS0derived without using a QDC (thin lines).
magnetic data and its consideration in the QDC calculation is presented in Janzhura and Troshichev (2011). The method of the automatic “on-line” derivation of the QDC irrespective of solar and magnetic activity and the IMF sector structure is
O. A. Troshichev et al.: Relationship between polar cap magnetic activity and interplanetary electric field 1483
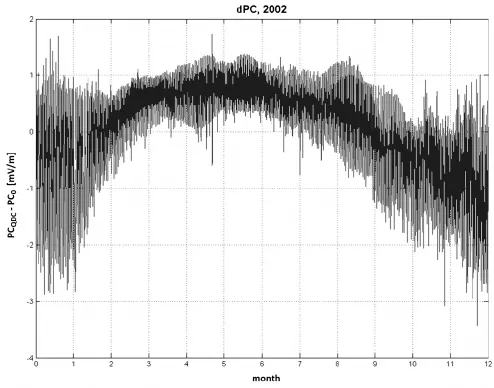
Fig. 3. Seasonal variation of the differences between the PCS index values calculated with a QDC (PCQDC)and without a QDC (PC0)in 2002.
3 Role of the QDC in determination of parametersφ,α, andβ
The steadiness of parametersφ,α, andβ for separate years was analyzed by Papitashvili et al. (2001) and Stauning et al. (2006). In Papitashvili et al. (2001), the coefficientsα andβfor each year were calculated using three year running means in the solar wind and ground data, without reference to daily quiet variation. The authors found that coefficients are not similar for each year of solar cycle epoch, and the con-clusion was made that the normalization parameters are not invariable and, therefore, they should be recalculated each year of solar cycle epoch.
In the procedure adopted by the Danish Meteorological Institute, the varying quiet level is derived to account the polar magnetic disturbances related toEKLvariations.
Ac-cording to description of the procedure given in Stauning et
Fig. 4. Variation of the QDC in the H component at Vostok station for Novembers of 2002 and 2007 (upper panel) and the QDC amplitude trends during November months for several years of the solar cycle (lower panel).
rather a consequence of the strong smoothing effect where the months related to quite different levels of solar activity are united in the one smoothing group.
Since neither Papitashvili et al. (2001) nor Stauning et al. (2006) took into account the actual QDC changes dur-ing the month under the examination, the other factors, such as the IMF sector structure, the regular and irregular changes in the solar UV irradiation, and so on, can affect the value of polar cap magnetic activity. To demonstrate the QDC role in derivation ofα,β, andφparameters, the parameters derived with inclusion of the QDC and without QDC should be com-pared. To provide such comparison, in our analysis we used the same experimental data (satellite measurements ofEKL
and magnetic data from Vostok for 1998–2001) to derive a set of parametersα0,β0, andφ0without including the QDC.
Results of this calculation – angleφ0, slope of regression
line α0 and intersectionβ0 – are shown in Fig. 1 for
win-ter and summer days at the Vostok station (15 June and 15 November 2002, respectively) along with parametersφ,α, andβderived for the same days with inclusion of QDC. One
can see that angle φ0 (Fig. 1a) demonstrates much larger
magnitude of daily variation (∼30◦in winter and ∼70◦ in summer) than angle φ calculated with inclusion of QDC (∼10◦and∼30◦, respectively). The same regularity is typi-cal of the slope value (Fig. 1b), especially in summer period (1α0∼14,1α∼6). As for intersection (Fig. 1c),
coeffi-cients β0 are always positive (from 3 to 11 in winter and
from 20 to 35 in summer), whereas coefficientsβ are pre-dominantly negative (from−3 to−8 in winter and from 5 to −15 in summer). Thus, parametersφ0,α0, andβ0derived
without QDC demonstrate much large daily variability than parametersφ,α, andβderived with inclusion of QDC.
To estimate effect of differences in parametersφ,α, and β on the PC index value, the appropriate indices PC0 and
PCQDC have been calculated. Figure 2 shows the variation
of PC0and PCQDC indices on the same days: 15 June and
15 November 2002. It is seen the strong similarity in be-haviour of PC0and PCQDCindices, but their values turn out
to be different. In the winter day of 15 June, the PCQDC
O. A. Troshichev et al.: Relationship between polar cap magnetic activity and interplanetary electric field 1485
Fig. 5. Parametersφ,β, andαderived for Vostok station independently for epoch of solar maximum (1998–2001) [Troshichev et al., 2006], for epoch of solar minimum (1997, 2007–2008), and for complete cycle of solar activity (1995–2005) (AARI#3 version); the axis of abscises being for UT and axis of ordinates being for month.
PC0values (thin line). In the summer season of 15
Novem-ber, the PC0 values (thin line) are ∼1–1.5 mV m−1 above
PCQDC (thick line) during day-time hours, but both
quanti-ties are practically coincident around local night (16:00 UT). The differences dPC = PCQDC−PC0display the daily
varia-tion, the character of which is strongly changed from season to season, as it is clearly seen in Fig. 3. During the win-ter months the PCQDC index is larger than PC0 index and
the amplitude of daily variation in average does not exceed 1 mV m−1, whereas in the summer season PC0is larger, as a
rule, than PCQDC, with amplitudes of daily variation as large
as 3 mV m−1. Thus, inconsistencies between the PC indices, calculated with a QDC and without QDC, can reach signifi-cant values, and this circumstance directly relates to conclu-sions about the variability of parametersφ,α, andβ in the solar activity cycle claimed by Papitashvili et al. (2001).
4 Invariability of parameters α, β, andφ in the solar activity cycle
To demonstrate the independence of the parameters α, β, andφ on solar cycle activity, when the QDC is taken into account, we derived an independent set of parameters for the solar minimum epoch (1997, 2007–2009) and compared them with the parameters obtained in Troshichev et al. (2006) for the solar maximum epoch (1998–2001). To demonstrate how much the difference in the QDC in solar maximum and minimum epochs could be, we show in Fig. 4 the QDC
cal-culated for H-component at Vostok station in November of 2002 and 2007 (upper panel), and the QDC amplitude trends during November months of several years of the solar cycle (low panel). One can see that the QDC amplitude can change in range from 70–90 nT to 30–40 nT when passing from the epoch of solar maximum in 2002 to the epoch of solar mini-mum in 1997 and 2007.
The proper QDCs for solar minimum years have been taken as a level of reference to evaluate the magnetic distur-bance valuesδF (k)at Vostok and the obtained valuesδF (k) have been correlated with the appropriateEKLquantities to
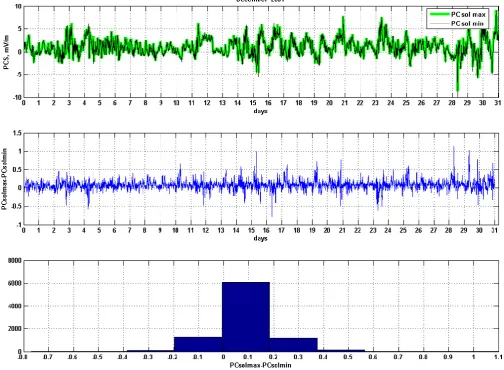
Fig. 6. Indices PCsolmax(thick line) and PCsolmin(thin line) calculated for Vostok in December 2001 with use of two independent sets of parametersφ,αandβ(upper panel), differences between indices PCsolmaxand PCsolminin a larger scale (middle panel), and distribution plots for the differences (lower panel).
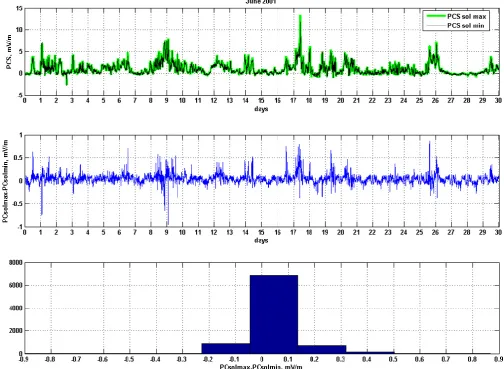
The upper panels of Figs. 6 and 7 show the variations of two sets of the PCS indices in summer (December) and winter (June) months of 2001. The middle panels show the differences (PCsolmax−PCsolmin) in a larger scale to show
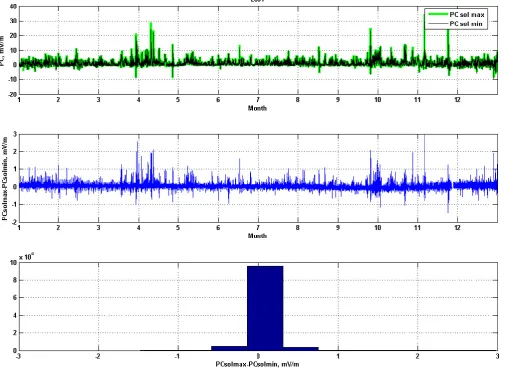
a diversity between the two indices. The lower panels in Figs. 6 and 7 demonstrate the distribution plots for the differ-ences. One can see that the value of differences in the sum-mer season (Fig. 6) fluctuates in the range of±0.3 mV m−1, the mean difference being about zero. In the winter season (Fig. 7), the dispersion of the difference values is roughly the same, but the level of mean difference is of∼0.18 mV m−1, i.e. there is a negligible underestimation of the PC index. Fig-ure 8 shows the variations of two sets of the PCS indices throughout the year 2001, the lower panel demonstrating the differences (PCsolmax−PCsolmin) in a larger scale. The
re-sult is the same: the mean difference between two sets of data fluctuates in the range ±0.3 mV m−1 around roughly
zero level. It means that parametersα,β, andφderived by
data of the solar minimum epoch can be used for calculation of the PC index in years of solar maximum, the mean dif-ference (PCsolmax−PCsolmin) remaining below the usual PC
index noise level (∼0.5 mV m−1). Taking into account the
quite insufficient statistical validity of coefficients (mean of only 4 quantities), the results seem to be quite reasonable.
5 Discussion
O. A. Troshichev et al.: Relationship between polar cap magnetic activity and interplanetary electric field 1487
Fig. 7. Indices PCsolmax(thick line) and PCsolmin(thin line) calculated for Vostok in June 2001.
level, remaining in average in range∼10 % of the PC value. Is this difference acceptable or not?
To answer this question, we have to take into account that conditions during a long period (epoch of solar activity or separate year) can not be completely quiet or completely dis-turbed. The disturbed intervals alternate with quiet intervals during solar maximum epochs, and quiet intervals alternate with disturbed intervals during the solar minimum epochs. Parametersα,β, andφare derived as values statistically jus-tified for average conditions. The average parameter value for solar maximum is shifted to one side, the average parame-ter value for solar minimum is shifted to the opposite side, the average parameter value for transient periods between years of solar minimum and solar maximum epochs lying between “maximum” and “minimum” positions. In any case the sta-tistically justified parameter is average value, which can not be equally matched to entire variety of conditions.
Therefore, we are faced with a dilemma: either to derive parameters that most closely correspond to varying external conditions or to rest contended with average parameters. The
first approach is reduced to division of the whole volume of data into separate parts according to power of different fac-tors determining the PC index value (such as coupling func-tionEKL, solar wind dynamic pressure pulses, solar proton
flux, opposite effect of the azimuthal IMF component in the opposite polar caps, and so on) and calculation of param-eters α, β, and φ separately for each part. This approach is quite attainable and would provide the perfect evaluation of parameters for certain conditions and, therefore, the ex-act estimation of the PC index. However, calculation of the PC index in frameworks of this approach is possible only on condition that all factors are well known and, therefore, can not be used for such an applied task as the monitoring of the current state the of magnetosphere.
Fig. 8. Variations of indices PCsolmax(thick line) and PCsolmin(thin line) at Vostok throughout the year 2001 (upper panel), difference (PCsolmax−PCsolmin) in a larger scale (middle panel), and distribution plots for the differences (lower panel).
the solar maximum epoch (1998–2001) as well as by 4 points for solar minimum epoch (1997, 2007–2009), the 10 % un-certainty of the PC value estimation seems to be quite in-significant. It makes it possible to conclude that the relation-ship between the coupling functionEKL and the polar cap
magnetic activity, responding toEKL, can be considered as
independent of solar activity and, therefore, the parameters α, β, andφ based on data for complete solar activity cy-cle (1995–2005, as in AARI#3 version, see right column in Fig. 5) can be regarded as valid forever.
6 Conclusion
The use of a QDC as a level of reference for values of the po-lar cap magnetic disturbance leads to a close consistency in the calibration parametersα,β, andφcalculated for epochs of solar maximum and solar minimum, and provides (within 10 % uncertainty) agreement of the PC indices calculated by
these independent sets of coefficients. Therefore, parame-tersα,β, andφ, which determine relations between the cou-pling functionEKLand the magnetic activity valueδF, can
be considered as invariant irrespective of the solar activity. It means that the relationship between the geoeffective solar wind variations and the polar cap magnetic activity respond-ing to these variations does not change in the course of the solar cycle. Thus, once derived parameters ofα, β, andφ can be regarded as valid forever, provided that the appropri-ate QDCs are used.
O. A. Troshichev et al.: Relationship between polar cap magnetic activity and interplanetary electric field 1489 References
Janzhura, A. S. and Troshichev, O. A.: Determination of the running quiet daily geomagnetic variation, J. Atmos. Solar-Terr. Phys., 70, 962–972, 2008.
Janzhura, A. S. and Troshichev, O. A.: Identification of the IMF sector structure in near-real time by ground magnetic data, Ann. Geophys., 29, 1491–1500, doi:10.5194/angeo-29-1491-2011, 2011.
Janzhura, A., Troshichev, O., and Stauning, P.: Unified PC indices: Relation to the isolated magnetic substorms, J. Geophys. Res., 112, A09207, doi:10.1029/2006JA012132, 2007.
Kan, J. R. and Lee, L. C.: Energy coupling function and solar wind-magnetosphere dynamo, Geophys. Res. Lett., 6, 577–580, 1979. McCreadie, H. and Menvielle, M.: The PC index: review of methods, Ann. Geophys., 28, 1887–1903, doi:10.5194/angeo-28-1887-2010, 2010, Corrigendum: Ann. Geophys., 29, 813– 814, doi:10.5194/angeo-29-813-2011, 2011.
Papitashvili, V. O., Gomova, L. I., Popov, V. A., and Rasmussen, O.: Northern Polar Cap magnetic activity index PCN: Effective area, universal time and solar cycle variations, DMI Scientific Report, SR-01-01, Copenhagen, Denmark, 57 pp., 2001.
Stauning, P., Troshichev, O., and Janzhura, A.: Polar Cap (PC) in-dex. Unified PC-N (North) index procedures and quality, DMI Scientific Report, SR-06-04, 2006.
Troshichev, O. A.: Polar cap magnetic disturbances and field-aligned currents, Space Sci. Rev., 32, 275–360, 1982.
Troshichev, O. A. and Andrezen, V. G.: The relationship between interplanetary quantities and magnetic activity in the southern polar cap, Planet Space Sci., 33, 415–419, 1985.
Troshichev, O. and Janzhura, A.: Relationship between the PC and AL indices during repetitive bay-like magnetic disturbances in the auroral zone, J. Atmos. Solar-Terr. Phys., 71, 1340–1352, 2009.
Troshichev, O. A., Andrezen, V. G., Vennerstrøm, S., and Friis-Christensen, E.: Magnetic activity in the polar cap – A new in-dex, Planet. Space Sci., 36, 1095–1102, 1988.
Troshichev, O., Janzhura, A., and Stauning, P.: Unified PCN and PCS indices: Method of calculation, physical sense and depen-dence on the IMF azimuthal and northward components, J. Geo-phys. Res., 111, A05208, doi:10.1029/2005JA011402, 2006. Troshichev, O. A., Janzhura, A. S., and Stauning, P.: Magnetic
activity in the polar caps: Relation to sudden changes in the solar wind dynamic pressure, J. Geophys. Res., 112, A11202, doi:10.1029/2007JA012369, 2007.
Troshichev, O., Sormakov, D., and Janzhura, A.: Relation of PC index to the geomagnetic storm Dst variation, J. Atmos. Solar-Terr. Phys., 73, 611–622, doi:10.1016/j.jastp.2010.12.015, 2011. Vennerstrom, S.: The geomagnetic activity index PC, Ph.D. Thesis, Scientific Report 91-3, Danish Meteorological Institute, 105 pp., 1991.

![Fig. 5. Parametersfor epoch of solar minimum (1997, 2007–2008), and for complete cycle of solar activity (1995–2005) (AARI#3 version); the axis of abscises φ, β, and α derived for Vostok station independently for epoch of solar maximum (1998–2001) [Troshichev et al., 2006],being for UT and axis of ordinates being for month.](https://thumb-us.123doks.com/thumbv2/123dok_us/8159732.249306/7.595.46.547.60.304/parametersfor-complete-activity-abscises-station-independently-troshichev-ordinates.webp)