R E S E A R C H
Open Access
Farmers
’
perception of climate change and
adaptation strategies in the Dabus
watershed, North-West Ethiopia
Paulos Asrat
*and Belay Simane
Abstract
Introduction:This study is aimed at analyzing farmers’perception and adaptation to climate change in the Dabus watershed. It is based on analysis of data collected from 734 randomly selected farm household heads substantiated with Focus Group Discussions and field observations.
Methods:The study employed descriptive methods to assess farmers’perception of climate change, local indicators of climate change and types of adaptation measures exercised to cope up with the risk of the change in climate. The study also employed the Heckman sample selection model to analyze the two-step process of adaptation to climate change which initially requires farmers’perception that climate is changing prior to responding to the changes through adaptation measures.
Results:Based on the model result educational attainment, the age of the head of the household, the number of crop failures in the past, changes in temperature and precipitation significantly influenced farmers’perception of climate change in wet lowland parts of the study area. In dry lowland condition, farming experience, climate information, duration of food shortage, and the number of crop failures experienced determined farmers’perception of climate change. Farmers’adaptation decision in both the wet and dry lowland conditions is influenced by household size, the gender of household head, cultivated land size, education, farm experience, non-farm income, income from livestock, climate information, extension advice, farm-home distance and number of parcels. However, the direction of influence and significance level of most of the explanatory variables vary between the two parts of the study area.
Conclusions:In line with the results, any intervention that promotes the use of adaptation measures to climate change may account for location-specific factors that determine farmers' perception of climate change and adaptive responses thereof.
Keywords:Climate change, Perception, Adaptation, Heckman sample selection model
Introduction
Agriculture is the most important sector in Sub-Saharan Africa, but it is predicted to be negatively impacted by climate change (Deressa2006; Moussa and Amadou2006; Jain2006). It is clear that climate change will bring about substantial welfare losses especially for smallholders whose main source of livelihood derives from agriculture. Therefore, there is a need to neutralize the potential adverse effects of climate change if welfare losses to this
vulnerable segment of the society are to be averted (Hassan and Nhemachena 2008; Molua and Lambi2006; Mano and Nhemachena2006). In Ethiopia, climate change features such as drought, flood, and soil degradation are among the major factors responsible for the low agricul-tural productivity (Asrat and Simane 2017c; Yirga 2007). These coupled with heavy reliance on traditional farming techniques and poor complementary services (such as extension, credit, marketing, etc.) reduce the adaptive capacity or increase the vulnerability of smallholder farmers to climate change, which in turn affects the performance of the already weak agriculture (Asrat and Simane2017d). * Correspondence:paulosasrat63@gmail.com
College of Development Studies, Center for Environment and Development Studies, Addis Ababa University, Addis Ababa, Ethiopia
Climate variability and change also poses a huge threat to smallholder farmers in the Dabus watershed (the study area) due to overwhelming reliance on climate-sensitive small-scale agriculture, which could also be worsened by prevailing social and economic challenges in the watershed (Asrat and Simane2017d). Agricultural production is apparently affected by climate-related shock in the area, which is usually manifested by the occurrence of pest and insect infestations as well as land degradation problems. In this regard, adaptation appears to be an efficient and friendly way for farmers to reduce these negative impacts of climate change (Füssel and Klein2006).
Following IPCC (2007), adaptation to climate change refers to the adjustment in natural or human systems in response to actual or expected climatic stimuli or its effects, which moderates harm or exploits beneficial opportunities. Adaptation can be implemented by small-holder farmers themselves (autonomous adaptation) or by government policies aimed at promoting appropriate and effective adaptation measures (planned adaptation). How-ever, in order to implement appropriate interventions, there is a need to understand location-specific opportun-ities, challenges, and the key drivers behind adaptation.
Adaptation can also be effected at different scales: individual/farm-level, national level, or international level. Although there is some autonomous adaptation at farm-level, it is usually inadequate and requires the intervention of different institutions (Simane et al.2016; Semenza et al.2008; Maddison2007). Moreover, adaptation at national or international level entails an understanding of the process of location-specific autonomous adaptation at farm-level (Bryan et al.2009).
Studies (Deresa et al.2009; Mideksa2009; Bryan et al. 2009) show that the use of improved crop varieties, agroforestry practices, soil conservation practices, irriga-tion practices, and adjusting planting dates are the most important adaptation strategies by smallholder farmers. However, adaptation decision is location-specific and influenced by key drivers such as socio-economic, environ-mental, and institutional factors. Based on Asrat and Simane (2017a) and Deresa et al. (2009), adaptation at farm-level involves two stages: perceiving a change in cli-mate and deciding whether to adopt or not (including which adaptation strategy to use). Nevertheless, perception is not a sufficient condition for adaptation since farmers who have perceived the change in climate may not adapt or the nature of their adaptation response may vary as a result of a complex interplay among social, economic, environmental, and institutional factors (Maharjan et al. 2011; Mertz et al.2009; Maddison2007).
Thus, there is a need to understand location-specific drivers of perception and adaptation to climate change among smallholder farmers. This helps to design
appropriate policy responses based on the vulnerability and sensitivity level of each location as well as the accessi-bility of the adaptation methods (Asrat and Simane2017d; Simane et al. 2016). In this regard, there is a substantial deficit of location-specific information on the process of autonomous adaptation in the developing world including Ethiopia (Asrat and Simane 2017a; McSweeney et al. 2010). There are few research undertakings (Deresa et al. 2011; Di et al. 2011; Deresa et al. 2009), which focused mainly at a large scale (country level, region level, and basin level) and overlooked location-specific factors that drive perception and adaptation to climate change. The findings of these studies are highly aggregated and are of little help in addressing local peculiarities of perception and adaptation to climate change.
Understanding local perceptions and adaptive behavior provides better insights and information relevant to a policy that helps to address the challenge of sustainable agricultural development in the face of variable and uncertain environments (Simane et al.2016). This study, therefore, will respond to a paucity of empirical information regarding the indicated gaps of knowledge addressing threefold purpose: (i) investigate farmers’ perception and adaptation to climate change in the Dabus watershed, (ii) investigate location-specific social, economic, environ-mental and institutional factors that influence farmers’ perception and adaptive decision, and (iii) compare the wet and dry lowland parts of the study area in terms of perception and adaptation to climate change.
Methods
Study area
Dabus watershed is part of the Blue Nile River basin and is situated in the North-West Ethiopia (Fig.1). It has an area of 21,030 km2and its altitude ranges between 485 and 3150 m above mean sea level. The slope gradient of the study area varies from flat to steep slopes. According to MOA (1998), the area is characterized by two agro-climatic zones: dry lowland (hot to warm moist low-lands) and wet lowland (subhumid lowlow-lands). Based on National meteorological service agency of Ethiopia (2016), the annual rainfall in the area varies between 970 and 1985 mm. The annual maximum and minimum temperature vary between 20–35 °C and 8–20 °C, respectively. The study area encompasses 20 districts with an estimated population size of 206,377 (CSA2013; CSA2008).
variability and change in Ethiopia (Asrat and Simane
2017d). Climate variability and change poses a huge
threat to farmers in the area; the stressful problems being overwhelming reliance on small-scale agriculture, land degradation, and water shortages. The level of climate change impacts varies across the wet and dry lowland parts of the study area. However, the two parts have commonly caused multiple impacts that affect a wide array of ecosys-tem functions and services and hence possess a challenge on the adaptive capacity of smallholder farmers to climate hazards (BGNRS2013).
Data source and methods of data collection
The relevant data to this study were collected from both primary and secondary sources. The primary source is a cross-sectional survey data collected from 734 house-holds in November and December 2016. The primary data majorly include demographic, socioeconomic, insti-tutional, and biophysical attributes. The data also include information on farmers’ perception of the patterns of temperature and rainfall over the past 20 years. Survey questionnaires, focus group discussion, and field observation were the data collection methods employed. Household-level data were collected through an open-and close-ended survey questionnaire. Six focus group dis-cussions, each comprising ten persons, were also carried out to substantiate the responses acquired using the ques-tionnaire. The primary data from the field survey were supplemented with data obtained from secondary sources.
Sampling procedure
The Dabus watershed in the Blue Nile River basin was purposively selected, because this watershed, among others in the basin, is the most vulnerable to climate variability and change (Asrat and Simane 2017d). The households in the watershed were considered as the sur-vey population, and the units of analysis were the heads of households. We followed Kothari (2004) to estimate the minimum sample size for the study from the study population. However, the sample size from this approach is valid only if simple random or systematic random sampling methods are applied. Multistage sampling requires a larger sample size to achieve the same preci-sion. This study used a multistage sampling procedure, and hence, the calculated sample size is multiplied by a design effect based on Cochran (1977) and Daniel (1999). Previous studies of such type (Asrat and Simane
2017c; Daniel 1999) estimated the design effect in a
range of 1.5–2. Based on this consideration and observa-tions we made on the study population, a design effect of 1.5 is used.
In the first stage of our multistage sampling, 20Woredas
(districts) in the Dabus watershed were stratified into the two agro-climatic zones (wet lowland and dry lowland). In the second stage, fourWoredas(Assosa and Bambasi from the wet lowland; Mengie and Shrkole from the dry low-land) were randomly selected to represent the agricultural production systems in the study area. From each selected
Woreda, 3Kebeles(the smallest administrative unit) were
included in the study. Finally, 734 farm households were randomly drawn from the selectedKebeleson the basis of probability proportional to size (PPS) sampling procedure.
Method of data analysis
The data analysis was done by descriptive statistics and econometric model (Heckman’s sample selection model) using STATA 12 and SPSS 19. The descriptive statistics were employed to describe farmers’ perception of climate shocks, responses implemented to address the shocks, and the constraints faced in implementing the responses. The Heckman’s sample selection model was employed to analyze the two-step processes of location-specific adaptation to climate change.
Models specification
Based on Heckman (1976), when a farmer’s decision process about the adoption of a new technology requires more than one step, models with two-step regressions, such as Heckman’s sample selection, are appropriate to correct for selection bias generated during the decision-making processes. The Heckman’s sample selection model is based on the farmer’s utility or profit-maximizing behavior, and the assumption is that a farmer uses a new technology only when the perceived utility or profit from using the new technology is signifi-cantly greater than the traditional or the old method.
Similar to technology adoption, adaptation to climate change is a two-step process that involves perceiving that climate is changing and then responding to the change through adaptation measures (Asrat and Simane 2017a; Deresa et al.2011). Therefore, the Heckman pro-bit selection model is employed in this study to investi-gate the determinants of perception and adaptation to climate change. The first stage of the model (the selection model) considers whether a farmer perceived a change in the climate, and the second stage of the model (outcome model) explores whether the farmer adapted to climate change conditional on the first stage.
In the two-stage process, the second stage of adaptation is a sub-sample of the first. Thus, it is likely that the second stage sub-sample (those who responded to change) is non-random and necessarily different from the first (which included those who did not perceive climate change), and this creates a sample selection bias (Asrat and Simane 2017a; Deresa et al. 2011). Therefore, the Heckman two-step maximum likelihood procedure was used to correct for this selection bias. The underlying relationship in the Heckman’s sample selection model consists of a latent equation given by:
yj¼xjβþu1j ð1Þ
Such that, we observe only the binary outcome given by the probit model as
yiprobit¼ðy>0Þ ð2Þ
The dependent variable is observed only if j is observed in the selection equation
yiselect¼zjδþu2j>0 ð3Þ
u1Nð0;1Þ
u2Nð0;1Þ
corrðu1;u2Þ ¼ρ
where yjselect is whether a farmer has perceived climate change or not, z is an m vector of regressors, which include different factors hypothesized to affect percep-tion; δ is the parameter estimate, u2j is an error term and u1 and u2are error terms, which are normally dis-tributed with mean zero and variance one. Thus, Eq.3is the first stage of Heckman’s two-step model which rep-resents the farmers’ perception of changes in climate. Equation 1 is the outcome model which represents whether the farmer adapted to climate change, and is conditional upon the perception model.
When the error terms from the selection and the out-come equations are correlated (ρ≠0), the standard probit techniques yield biased results (Asrat and Simane
2017a; Deresa et al. 2011; Van de Ven and Van Praag
1981). Thus, the Heckman probit (heckprob) provides consistent and asymptotically efficient estimates for all parameters in such model.
Results and discussion
Descriptive results
Farmers’perception of climate change
The descriptive analysis indicated that about 52% of the respondents from the wet lowland and 62% from the dry lowland had perceived a change in climate (Table 1). This difference in perception of climate change between the two locations is statistically significant (χ2= 6.636 with P< 0.001). The descriptive analysis also signified that more than 55% of the respondents perceived an increasing trend in temperature while 42 and 25%, respectively, perceived a stable and decreasing temperature. Regarding precipitation, about 64% of the respondents indi-cated a decreasing trend while 34% of them testified an in-creasing trend. Parallel to this, those farmers who inferred an increasing trend in temperature and a decreasing trend in precipitation specified the respective local indicators that make them deduce these trends (Table2).
Farmers’adaptive responses
In the wet lowland condition, 62% of the respondents in-dicated that they know climate change adaptation meas-ure and have implemented at least one in the past. In
the dry lowland, only 48% the respondents reported hav-ing knowledge of adaptation options while 52% of them have no any past experience concerning the measures (Table 3). This difference in the exposure to adaptation measures is statistically significant (χ2= 14.659 with P< 0.001), showing the existence of a verified difference be-tween the two parts of the study area.
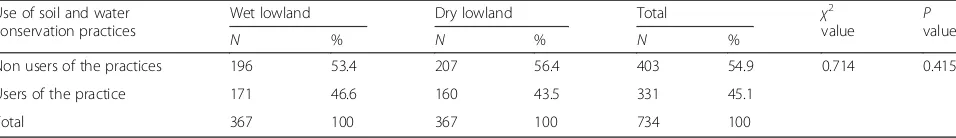
The respondents from the wet and dry lowland were also compared in terms of use of different adaptation strategies in their agricultural practices. The most used adaptation measures include soil and water conservation and agronomic practices such crop rotation, intercrop-ping, adjusting planting dates, diversifying crop types, use of fertilizer, use of improved crop varieties, applica-tion of manure, and irrigaapplica-tion practices. Accordingly, about 47% of the respondents in the wet lowland and 44% in the dry lowland have used soil and water conser-vation practices (Table 4). However, the use of this practice is not statistically different between the wet and the dry lowland implying that the role of soil and water conservation in copping the hazards of climate change is evenly recognized in both areas.
Table 1Perception of climate change in the study area
Perception Wet lowland Dry lowland Total χ2value Pvalue
N % N % N %
Not perceived 175 47.7 141 38.4 316 43.1 6.636*** 0.006
Perceived 192 52.3 226 61.6 418 56.9
Total 367 100 367 100 734 100
***Values are significant atP< 0.001
Table 2Indicators that justify farmers’perception of increasing temperature and decreasing precipitation
N Percent
Indicators of temperature change
Longest months with high day time temperature 133 33.3
Frequent occurrence of heat-induced crop disease 119 29.3
Switch to heat tolerant crop types/varieties (not previously adapted to the area) 110 27.1
Frequent occurrence of heat-induced livestock disease 107 26.4
Frequent occurrence of heat-induced human disease 103 25.4
Emergence of new plant species/invasive species in the form of weed 82 20.2
Quick disappearance of water sources/points due to high evaporation 80 19.7
Indicators of precipitation change
Shortened length of rainy season 136 18.2
Change in planting time/date to adjust to onset of rainfall 123 16.8
Early onset and early exit of rainy season 114 15.5
Erratic nature of rainfall/Increased volume of rainfall at a time 100 13.6
Late onset of rainy season 99 13.5
Crop failure due to water shortage 98 13.4
Switch to drought tolerant crop types/varieties (not previously adapted to the area) 64 8.7
Table 3Awareness of adaptation measures in the study area
Exposure to adaptation
Wet lowland
Dry lowland
Total χ2value Pvalue
N % N % N %
No exposure 139 38 191 52 330 45 14.659*** 0.000
Have exposure 228 62 176 48 404 55
Total 367 100 367 100 734 100
Congruently, about 69% of the respondents from the wet lowland and 59% from the dry lowland have imple-mented agronomic practices as adaptation strategy (Table5). The difference between the two areas in terms of use of agronomic practices is statistically significant (χ2= 8.497 with P< 0.01). More use of agronomic mea-sures in the wet lowland condition might be attributed to farmers’longer crop cultivation experience and better exposure to the practices compared to farmers in the dry lowland.
The proportion of respondents that have not used any of the adaptation practices is higher in the dry lowland as compared to the wet lowland. The non-users have pinpointed critical challenges for not responding to cli-mate change through adaptation, lack of perception be-ing a major bottleneck. Moreover, respondents who perceived climate change but failed to respond through the adaptation measures indicated lack of awareness on adaptation techniques, liquidity constraint (cash short-age), and lack of access to the adaptation measures as critical barriers.
Empirical model results
Determinants of perception and adaptation
Tables6 and7 portray descriptive summary of explana-tory variables used in the Heckman probit selection and outcome models, respectively. As indicated in the tables, about 52% of the respondents in the wet lowland and 62% in the dry lowland perceived a change in climate. With regard to adaptation, about 52% of the respondents in the wet lowland and 44% in the dry lowland have used at least one of the major adaptation options.
The Heckman probit model was first tested for its suitability and explanatory power over the standard pro-bit model. The test results indicated the presence of sample selection problem (dependence of the error terms from the outcome and selection models) justify
the use of the model with rho significantly different from zero (Wald χ2= 10·77 with P= 0·001). Moreover, the likelihood function of the Heckman probit model was significant (Wald χ2= 84.36 with P< 0·001), showing its strong explanatory power.
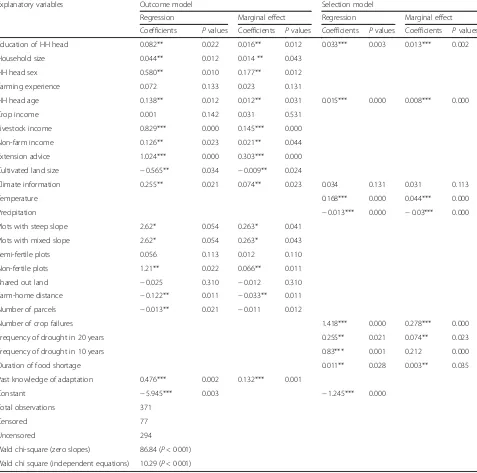
Results of the selection and outcome models are pre-sented in Tables 8 and 9, for the wet lowland and the dry lowland, respectively. In both models, most of the explanatory variables and their respective marginal values are statistically significant in determining percep-tion and adaptapercep-tion in a direcpercep-tion that would be expected. The calculated marginal effects measure the expected changes in the probability of perception and adaptation with respect to a unit change in an explana-tory variable.
Results of the selection model for the wet lowland condition (Table 8) indicate that education level of the household head, age of the household head, changes in temperature and precipitation, number of crop failures in the past, and frequency of drought in the past signifi-cantly increase the likelihood of farmers’ perception of climate change (P< 0.01). Likewise, duration of food shortage faced in the past is statistically significant in en-hancing farmer’s perception of climate change (P< 0.05). Results of the outcome model for the wet lowland condi-tion are also portrayed in Table 8. Accordingly, income from livestock, the gender of the household head, extension advice, and knowledge of adaptation measures strongly in-fluenced farmers’adaptation decision (P< 0.001). Moreover, education level of the household head, household size, age of the household head, non-farm income, land size, climate information, the proportion of non-fertile land, and farm-home distance are significant in determining farmers’ adap-tation decision (P< 0.05).
Unlike the wet lowland condition, change in temperature and precipitation and frequency of drought experienced in the past are less important in influencing farmers’ Table 4Adaptation through soil and water conservation measures
Use of soil and water conservation practices
Wet lowland Dry lowland Total χ2
value Pvalue
N % N % N %
Non users of the practices 196 53.4 207 56.4 403 54.9 0.714 0.415
Users of the practice 171 46.6 160 43.5 331 45.1
Total 367 100 367 100 734 100
Table 5Adaptation through agronomic practices
Use of agronomic practices
Wet lowland Dry lowland Total χ2
value
P
value
N % N % N %
Non users of the practices 112 31 151 41 263 36 8.497** 0.004
Users of the practice 255 69 216 59 471 64
Total 367 100 367 100 734 100
perception of climate in the dry lowland. However, farming experience, climate information, duration of food shortage, and number of crop failures experienced in the past are statistically significant in determining farmers’perception of climate change (Table9).
The outcome model result for the dry lowland condi-tion (Table9) revealed that education level of the house-hold head, househouse-hold size, the gender of the househouse-hold head, farming experience, age, income from crop enterprise, climate information, slope of a plot, and Table 6Descriptive summary of model variables for Heckman probit selection model
Dependent variable description Farmers’perception status to climate change
Wet lowland Dry lowland
Perceived (%) Not perceived (%) Perceived (%) Not perceived (%)
Perception (perceived = 1) 52 48 62 38
Independent variables Mean SD Mean SD
Education level of HH head (years) 5.25 2.98 3.98 1.86
HH head age (years) 43.99 13.12 43.61 11.72
Climate change information (yes = 1) 0.6 0.5 0.4 0.5
Frequency of drought (last 20 years) 2.30 1.43 2.81 1.48
Frequency of drought (last 10 years) 2.37 2.16 2.23 1.11
Number of crop failures (last 10 years) 2.33 1.22 2.09 1.26
Duration of food shortage (months) 2.91 1.50 2.37 1.66
Temperature (increasing = 1) 0.7 0.3 0.65 0.3
Precipitation (increasing = 1) 0.3 0.7 0.4 0.6
Table 7Descriptive summary of model variables for Heckman probit outcome model
Dependent variable description Farmers’adaptation status to climate change
Wet lowland Dry lowland
Adapted (%) Not adapt (%) Adapted (%) Not adapted (%)
Adaptation (adapted = 1) 52 48 44 56
Independent variables Mean SD Mean SD
Education of HH head (years) 5.25 2.98 3.98 1.86
Household size (number) 6.08 2.44 5.92 2.31
HH head sex (male = 1) 0.89 0.22 0.9 0.21
Farming experience (years) 22.68 11.47 14.71 7.27
HH head age (years) 43.99 13.12 43.61 11.72
Crop income (Ethiopian currency) 3352.23 3005.44 1332.64 952.61
Livestock income (Ethiopian currency) 3927.65 4916.84 3927.65 4916.84
Non-farm income (Ethiopian currency) 3393.89 3726.03 2566.24 1899.33
Extension advice (yes = 1) 0.7 0.3 0.4 0.3
Climate change information (yes = 1) 0.6 0.5 0.4 0.5
Cultivated land size (hectares) 2.23 1.69 3.85 1.08
Plots with steep slope (%) 0.5 0.5 0.2 0.11
Plots with mixed slope (%) 0.5 0.5 0.8 0.11
Semi-fertile plots (%) 0.4 0.3 0.4 0.33
Non-fertile plots (%) 0.5 0.5 0.4 0.4
Shared out land (ha) 0.64 0.46 1.15 0.73
Farm-home distance (km) 1.91 1.12 2.36 1.32
Number of parcels 2.08 0.93 1.85 0.85
knowledge of adaptation options are positively and sig-nificantly related to farmers’adaptation decision. Income from livestock and non-farm activities negatively affected adaptation decision showing that income from these sources may not be invested for adaptation in crop sector. Similarly, land size, size of shared-out land, and farm-home distance negatively influenced adaptation decision of smallholder farmers in the dry lowland.
Based on the model results, marginal effects of signifi-cant explanatory variables are compared between the wet and dry lowland parts of the study area. The
computed marginal effect for education variable showed that one additional year in educational status of the household head increases the probability of adaptation by 14.4% in the dry lowland compared to 1.6% in the wet lowland. The probability of adaptation increases by 16.5% for each additional year of farming experience in the dry lowland while the marginal effect of farming experience on adaptation is negligible in the wet low-land. Likewise, the probability of adaptation increases by 31.9% as income from crop enterprise increases by one unit in the dry lowland.
Table 8Results of the Heckman probit selection model for the wet lowland
Explanatory variables Outcome model Selection model
Regression Marginal effect Regression Marginal effect
Coefficients Pvalues Coefficients Pvalues Coefficients Pvalues Coefficients Pvalues
Education of HH head 0.082** 0.022 0.016** 0.012 0.033*** 0.003 0.013*** 0.002
Household size 0.044** 0.012 0.014 ** 0.043
HH head sex 0.580** 0.010 0.177** 0.012
Farming experience 0.072 0.133 0.023 0.131
HH head age 0.138** 0.012 0.012** 0.031 0.015*** 0.000 0.008*** 0.000
Crop income 0.001 0.142 0.031 0.531
Livestock income 0.829*** 0.000 0.145*** 0.000
Non-farm income 0.126** 0.023 0.021** 0.044
Extension advice 1.024*** 0.000 0.303*** 0.000
Cultivated land size −0.565** 0.034 −0.009** 0.024
Climate information 0.255** 0.021 0.074** 0.023 0.034 0.131 0.031 0.113
Temperature 0.168*** 0.000 0.044*** 0.000
Precipitation −0.013*** 0.000 −0.03*** 0.000
Plots with steep slope 2.62* 0.054 0.263* 0.041
Plots with mixed slope 2.62* 0.054 0.263* 0.043
Semi-fertile plots 0.056 0.113 0.012 0.110
Non-fertile plots 1.21** 0.022 0.066** 0.011
Shared out land −0.025 0.310 −0.012 0.310
Farm-home distance −0.122** 0.011 −0.033** 0.011
Number of parcels −0.013** 0.021 −0.011 0.012
Number of crop failures 1.418*** 0.000 0.278*** 0.000
Frequency of drought in 20 years 0.255** 0.021 0.074** 0.023
Frequency of drought in 10 years 0.83*** 0.001 0.212 0.000
Duration of food shortage 0.011** 0.028 0.003** 0.035
Past knowledge of adaptation 0.476*** 0.002 0.132*** 0.001
Constant −5.945*** 0.003 −1.245*** 0.000
Total observations 371
Censored 77
Uncensored 294
Wald chi-square (zero slopes) 86.84 (P< 0·001)
Wald chi square (independent equations) 10.29 (P< 0·001)
One unit additional income from livestock enterprise has increased the probability of adaptation by 14.5% for farmers in the wet lowland. However, additional income from livestock has decreased probability of adaptation by 4.2% in the dry lowland implying that income from this source may not be invested for adaptation in the crop sector. Likewise, one unit additional income from non-farm activities has increased the probability of adap-tation by 2.1% in the wet lowland probably because it induces more investment in adaptation options. Never-theless, non-farm income reduces the probability of
adaptation by about 2% in the dry lowland showing that households who engage in non-farm activities are less dependent on crop farming and hence less motivated to invest for adaptation in the crop sector.
Owning farm plots with steep-slope increases the probability of adaptation to climate change by 26.3% in the wet lowland implying that farmers are more likely to invest on adaptation measures if their farm plots are steeper. Likewise, as the proportion of non-fertile land increases by one hectare, probability of adaptation increases by 6.6% in the wet lowland. However, in the Table 9Results of the Heckman probit selection model for the dry lowland
Explanatory variables Outcome model Selection model
Regression Marginal effect Regression Marginal effect
Coefficients Pvalues Coefficients Pvalues Coefficients Pvalues Coefficients Pvalues
Education of HH head 0.505*** 0.000 0.144*** 0.000 0.272** 0.014 0.070* 0.049
Household size 0.056*** 0.000 0.023*** 0.000
HH head sex 0.016*** 0.000 0.002*** 0.000
Farming experience 0.580** 0.010 0.165** 0.012 0.061** 0.017 0.019** 0.017
HH head age 0.058* 0.054 0.028* 0.043
Crop income 1.022*** 0.003 0.319 0.003
Livestock income −0.140** 0.011 −0.042* 0.013
Non-farm income −0.565** 0.034 −0.019* 0.042
Extension advice 0.015 0.143 0.045 0.141
Cultivated land size −2.70** 0.037 0.044* 0.041
Climate information 0·203** 0·011 0·057** 0·023 0.155*** 0.001 0.131*** 0.002
Temperature 0.077 0.416 0.017 0.103
Precipitation −1.121** 0.031 −0.123** 0.022
Plots with steep slope 0.543* 0.050 0.021* 0.056
Plots with mixed slope 0.956 0.419 0.026 0.337
Semi-fertile plots 0.139 0.124 0.003 0.124
Non-fertile plots −1.50 0.204 −0.127 0.342
Shared out land −0.54* 0.071 −0.149* 0.056
Farm-home distance −2.626* 0.046 −0.263* 0.051
Number of parcels −0.053 0.310 −0.016 0.310
Number of crop failures 4.414** 0.017 0.278** 0.021
Frequency of drought in 20 years 0.238** 0.014 0.227** 0.034
Frequency of drought in 10 years 0.323** 0.032 0.044** 0.013
Duration of food shortage 2.634*** 0.000 0.212*** 0.001
Past knowledge of adaptation 2.662** 0.000 0.289*** 0.000
Constant −5.032*** 0.001 −1.133*** 0.000
Total observations 363
Censored 75
Uncensored 288
Wald chi-square (zero slopes) 88.43, (P< 0.001)
Wald chi-square (independent equations) 10.86 (P< 0.001)
dry lowland, the probability of adaptation decreases by 12.7% as the size of non-fertile land increases showing that farmers may abandon a given farm plot if its fertility status significantly declines. This could be attributed to a relatively higher per capita landholding in the dry low-land which can possibly offset a decline in yield.
As the size of shared-out land increases by one hectare, probability of adaptation increases by 1.2% in the wet low-land and by 14.9% in the dry lowlow-land. Increase in the farm-home distance by 1 km decreases the probability of adaptation by 26.3% in the dry low land compared to 3.3% in the wet low land. This is because farm size is relatively large in the dry lowland compared to the wet lowland, and hence, less attention is given to farm plots far away from doweling areas.
Extension advice increased the probability of adaptation by 3% in wet lowland suggesting that extension is instru-mental for adaptation decision. Similarly, availability of climate information increases the probability of adaptation by 7.4% in the wet lowland and by 5.7% in the dry lowland. The other variable of interest which affects the prob-ability of farmers’adaptation decision is past knowledge of adaptation options (a proxy variable for awareness). The calculated marginal effect for this variable shows that the probability adaptation increases by 13.2% in the wet lowland and by 28.9% in the dry lowland showing that farmers’ desire to try adaptation practices at own cost increases when they have prior exposure to the practices. This implies that the more a farmer is exposed to adaptation technologies, the more will be the willing-ness and trust to implement the techniques sustainably.
Discussion
Climate change adaptation in smallholder agriculture is vital to reduce rural poverty and maintain ecosystem health. Besides, adaptation improves agricultural productivity and income of smallholder farmers (Asrat and Simane 2017c). As confirmed by the results of this study, adaptation to climate change is a two-step process which requires that farmers perceive climate change in the first step and respond to changes in the second step through adaptation. In the study locations, smallholder farmers well perceived the problem of climate change and make adaptive responses to minimize the negative effects that compro-mised their farm productivity and food security. However, different socio-economic, environmental, and institutional factors affect farmers’climate change perception and adap-tive behavior.
The results of this study revealed that farmers living in the dry lowland area perceived more change in climate than farmers in the wet lowland. This could either be associated with the repeated drought events occurring in the area in recent years or could be linked to various en-vironmental changes that cause reduced water availability
and agricultural yield in the dry lowland areas (Asrat and Simane2017d; Deresa et al.2011). With regard to adapta-tion, better awareness and use of adaptation measures is revealed in the wet lowland condition as compared to the dry lowland. This difference between the two locations may call for further heightening of intervention to facili-tate the prospect for enhanced climate change perception and adaptation.
The relevance of different agronomic practices as adaptation measure is increasing over years in the study area to lessen the challenges of climate factors on agri-culture. Some agronomic practices (such as adjusting planting date and early maturing crop varieties) are flat-tering in both parts of the study areas in response to change in the time of onset of rainy season, the inci-dence of terminal moisture stress, and early cease of rainfall. This is in line with the findings of Lobell et al. (2008) and Asrat and Simane (2017a) who signified adjusting planting date and use of early maturing varieties as key adaptive responses for to climate change in areas where rainfall is erratic.
Diversifying crop types is another agronomic practice emerging as adaptation strategy in the study locations attributed to farmers’ risk aversion behavior. Moreover, diversifying crop types into high-value crops (such as horticultural crops) is a related new development as adaptation option aiming at intensifying the use of scarce farm resources (water and land) and maximizing returns thereof. This strategy is also further driven by improved access to market and growing experience of irrigation practices in the area. This result confirms the findings of previous studies that reported crop diversifi-cation as a contemporary practice in response to climate change (Asrat and Simane 2017c; Nkonya et al. 2011). However, it is contrary to Jones and Thornton (2010), who predicted that climate change would induce a shift from crop to livestock production.
Based on the results, farmers are more likely to imple-ment soil conservation measures as adaptation strategy on parts of their agricultural land that are more suscep-tible (steep slopes) to climate change risks. This finding corroborates with the findings of Kassie et al. (2009) and Wossen et al. (2015). In the same line, a study by Asrat and Simane (2017b) implied that farmers invest in adap-tation measures in plots where they expect more risk from climate hazards.
technical know-how required for implementing adapta-tion measures in their agricultural producadapta-tion system and make them far-sighted to look for long-term benefits rather than immediate gains obtained at the expense land degradation. This is in agreement with the finding of Guteta and Abegaz (2015), Ketema and Bauer (2012) and Beshir et al. (2012) who reported that access to extension and training is instrumental for in promoting sustainable use of land-based climate change adaptation measures.
As expected, education is positively associated with farmers’ climate change perception and adaptation decision suggesting that educated farmers tend to better recognize the risks associated with climate change. Edu-cation also more likely enhances the reasoning capability and awareness of farmers about new technologies and hence induces them to adopt. This is in the same line with the findings of Deresa et al. (2009) and Asrat et al. (2004).
Gender of the household head is positively and signifi-cantly related to farmers’ adaptation decision in the study area showing that male-headed households better adapt to climate change. This can be associated with the fact that in rural Ethiopia, women-headed households are usually constrained by family labor because those women are responsible for both farming and household activities. Moreover, female-headed households have less access to resources, information, and other socio-economic opportunities and bear more burdens of household responsibilities than males. This finding concurs with other empirical findings (Asrat and Simane
2017b; Guteta and Abegaz 2015b; Deresa et al. 2011;
Buyinza and Wambede 2008) who reported that male-headed households often have a higher probability of adopting new agricultural technologies.
Farm families are an important source of labor for any farm operation in smallholder agriculture. In line with this, household size increases the likelihood of farmers’ climate change adaptation in the study area probably because large family size is normally associated with a better labor endowment. The result also suggests house-holds that are endowed with family labor tend to use labor-intensive climate change adaptation measures. This result is in harmony with the findings of Kassie et al. (2009) who stated that the presence of more econom-ically active household members favored adoption of labor-demanding agricultural technologies.
In the study area, the incidence of adaptation to climate change decreases with cultivated land size. This may reveal that adaptation is plot-specific and it is the specific characteristics of a plot that dictates the need for a specific adaptation rather than the size. In this re-gard, future research may account for plot level analysis to reveal the determinants of climate change adaptation at plot level. Previous studies (Asrat and Simane 2017a;
Deresa et al. 2011; Kurukulasuriya and Mendelsohn 2006) also reported similar findings.
Income from livestock and non-agricultural sources is positively and significantly associated with adaptation to climate change in the wet lowland parts of the study area. This could be attributed to the fact that income from these sources may provide farmers with additional capacity to finance adaptation measures. However, in the dry lowland, income from livestock enterprise and non-farm sources decreases the likelihood of adaptation. This may imply that as households engage more in livestock and non-farm activities, they become less dependent on crop farming and less motivated to invest for adaptation in the crop sector. This is in agreement with the findings of Simane et al. (2016) who reported a similar result for livestock-based farming systems in Ethiopia.
Size of non-fertile land is negatively and significantly associated with the likelihood of adaptation in the dry lowland showing that farmers may abandon a given farm plot if its fertility status significantly declines. This could be attributed to a relatively larger per capita land holding in the dry lowland which can possibly offset a decline in yield. In the same line, distant farmlands receive fewer adaptation measures in the dry lowland condition due to relatively large landholding size in the dry lowland compared to the wet lowland, and hence, less attention is given to farm plots far away from dowel-ing areas. This result corroborates with the finddowel-ings of Ketema and Bauer (2012) and Beshir et al. (2012).
Farmers’previous knowledge of climate change adap-tation measures increases their adapadap-tation decision in both the wet and dry lowland parts of the study locations. This shows that farmers’desire to implement adaptation measures at own cost increases when they have prior ex-posure to the practices. The more a farmer is exposed to the technologies of adaptation, the more will be the will-ingness and trust to implement the techniques sustainably. This is in agreement with previous empirical studies (Asrat and Simane2017b; Simane et al.2016; Asrat et al.2004).
Conclusions
with respect some variables that affected perception and adaptation to climate change. They have also consider-able differences in terms of the direction and effect of many of the explanatory variables that affect perception and adaptation.
Education of the household strongly and positively affected both perception and adaptation in the wet low-land area. It also strongly affected adaptation decision in the dry lowland area. Farming experience has a strong and positive effect on adaptation in the dry lowland, while it has no effect on adaptation in the wet lowland. Similarly, income from crop enterprise positively and strongly affected adaptation decision in the dry lowland, but it has shown no effect on adaptation decision in the wet lowland area.
Income from livestock enterprise positively and strongly affected farmers’adaptation decision in the wet lowland, while its effect is negative in the dry lowland condition. Likewise, income from off-farm activities has a positive influence on adaptation in the wet lowland area, while its effect is negative in the dry lowland. In the wet lowland condition, temperature is not statisti-cally significant in affecting perception to climate change while the effect of precipitation is negative and signifi-cant. Slope and fertility status of farm plots positively and significantly affected adaptation decision in the wet lowland while these variables have no effect on adapta-tion in the dry lowland.
The study result generally reveals that farmers’climate change perception and adaptation in both locations are commonly affected by some similar types of variables, which necessitate joint policy intervention with regard to these variables. On the other hand, the two study locations are considerably different in terms of the direc-tion and effect of some other variables. This difference dictates the need to have location-specific intervention to enhance smallholder farmers’perception and adapta-tion to climate change. Comparison of the two study lo-cation also revealed better awareness and use of the adaptation measures in the wet lowland condition as compared to the dry lowland. However, further height-ening of awareness in both locations may facilitate the prospect for enhanced adaptation.
Most of the factors affecting farmers’ perception and adaptation to climate change in the study areas are directly related to institutions, infrastructure, and tech-nologies. Hence, there is a need for policy intervention aiming at enhancing institutional services, infrastructural facilities, and delivering effective adaptation technolo-gies. The results of this study also show that lack of ex-perience, lack of access to information on climate change and lack of education limit perception and adap-tation decision of smallholder farmers. Hence, facilitat-ing effective and reliable access to information and
improving farmers’ awareness of potential benefits of adaptation are found to be important policy intervention measures.
In line with the findings of this study, there is a need for location-specific readily available adaptation tech-nologies that could help to reduce negative impacts of climate change on the already weak agriculture and on the livelihood of smallholder farmers. Policies must also aim at promoting farm-level adaptation through effective participation of farmers in developing and implementing relevant adaptation measures. Parallel to this, any inter-vention that promotes the implementation of climate change adaptation techniques should take in to account specific factors relevant to the nature of the practices. Since adaptation process is knowledge and resource intensive, it may not be implemented easily given the limited awareness and resource endowment of small-holder farmers. Therefore, enhancing perception and scaling up of climate change adaptation technologies r-equire a shared vision of all potential stakeholders and public-private partnership.
Acknowledgements
We would like to thank the farmers, agricultural development agents, and local administrators of the study area for their assistance during the field work. We are also grateful to Addis Ababa University (AAU) for providing the required facilities for the data analysis and write-up of this paper.
Funding
The authors would like to thank Addis Ababa University (AAU) and Dire-Dawa University (DDU) for providing financial support for the data collection and write-up of the manuscript.
Authors’contributions
The first author (PA) generated the idea, designed the study, designed data collection instruments, carried out the data collection and analyzed the data, and wrote the manuscript. The second author (BS) participated in the study design, shaped the data collection instruments, coordinated the data collection process, technically supported the data analysis process, and revised the draft manuscript. Both authors read and approved the final manuscript.
Competing interests
The authors declare that they have no competing interests.
Publisher’s Note
Springer Nature remains neutral with regard to jurisdictional claims in published maps and institutional affiliations.
Received: 29 September 2017 Accepted: 7 February 2018
References
Asrat P, Simane S (2017a) Adaptation benefits of climate-smart agricultural practices in the Blue Nile Basin: empirical evidence from North-West Ethiopia. In: Filho WL, Belay S, Kalangu J, Menas W, Munishi P, Musiyiwa K (eds) Climate change adaptation in Africa: fostering African resilience and capacity to adapt. Vol. 1. Springer International Publishing AG, Cham, Switzerland Asrat P, Simane B (2017b) Adapting smallholder agriculture to climate change
through sustainable land management practices: empirical evidence from North-West Ethiopia. J Agric Sci Technol 7:289–301.https://doi.org/10.17265/ 2161-6256/2017.05.001
empirical evidence from Dabus Sub-basin, Blue Nile River, Ethiopia, Agric Food Secur (2017) 6:6, 1DOIhttps://doi.org/10.1186/s40066-017-0148-y Asrat P, Simane B (2017d) Characterizing vulnerability of crop-based rural systems
to climate change and variability: agro-ecology specific empirical evidence from the Dabus watershed, North-West Ethiopia. Am J Clim Chang 2017(6): 643–667.https://doi.org/10.4236/ajcc.2017.64033
Asrat P, Belay K, Hamito D (2004) Determinants of farmers’willingness to pay for soil conservation practices in the southeastern highlands of Ethiopia. Land Degrad Develop 15:423–438
Beshir H, Emana B, Kassa BHJ (2012) Determinants of chemical fertilizer technology adoption in Northeastern highlands of Ethiopia: the double hurdle approach. J Res Econ Int Fin 1:39–49
BGNRS (Benishangul Gumuz National Regional State) (2013). Climate change adaptation plan, Assosa, Ethiopia
Bryan E, Deressa TT, Gbetibouo GA, Ringler C (2009) Adaptation to climate change in Ethiopia and South Africa: options and constraints. Environ Sci Policy 12:413–426
Buyinza M, Wambede N (2008) Extension of agroforestry technology adoption: mixed intercropping of crotalaria (Crotalaria grahamiana) and maize (Zea mays L.) in Kabale District, Uganda. In Environ Res J 2:131–137
Cochran WG (1977) Sampling techniques, 3rd edn. John Wiley & Sons, New York CSA (Central Statistical Agency) (2008), The 2007 population and housing census
of Ethiopia, results of Benshangul region: population size of woredas. The Federal Democratic Republic of Ethiopia, Addis Ababa
CSA (Central Statistical Agency) (2013) Population projection of Ethiopia for all regions at district level from 2014–2017, Addis Ababa
Daniel WW (1999)Biostatistics: a foundation for analysis in the health sciences, 7th edn. John Wiley & Sons, New York
Deresa TT, Hassan RM, Ringler C, Alemu T, Yesuf M (2009) Determinants of farmers’choice of adaptation methods to climate change in the Nile Basin of Ethiopia. Glob Environ Chang 19:248–255
Deresa TT, Hassan RM, Ringler C (2011) Perception of and adaptation to climate change by farmers in the Nile Basin of Ethiopia. J Agric Sci 149:23–31 Deressa TT (2006) Measuring the economic impact of climate change on Ethiopian
agriculture: Ricardian approach. CEEPA DP25. University of Pretoria, South Africa Di F, Veronesi SM, Yesuf M (2011) Does adaptation to climate change provide food
security? Micro perspective from Ethiopia. Am J Agric Econ 93(3):829–846 Füssel HM, Klein RJT (2006) Climate change vulnerability assessments: an
evolution of conceptual thinking. Climate Change 75:301–329
Guteta D, Abegaz A (2015) Factors influencing scaling up of agroforestry-based spatial land- use integration for soil fertility management in Arsamma Watershed, Southwestern Ethiopian Highlands. J Environ Plan Manag. https://doi.org/10.1080/09640568.2015.1090960
Hassan R, Nhemachena C (2008) Determinants of African farmers’strategies for adapting to climate change: multinomial choice analysis. Afr J Agric Resour Econ 2:83–104
Heckman JJ (1976) Common structure of statistical models of truncation, sample selection and limited dependent variables and a simple estimator for such models. Ann Econ Soc Meas 5:475–492
Intergovernmental Panel on Climate Change (IPCC) (2007) Climate change 2007: impacts, adaptation and vulnerability. In: Contribution of working group II to the fourth assessment report. Cambridge University Press, Cambridge, UK Jain S (2006) An empirical economic assessment of the impacts of climate change
on agriculture in Zambia. CEEPA DP27. Pritoria: University of Pretoria. Jones P, Thornton P (2010) Croppers to livestock keepers: livelihood transitions to
2050 in Africa due to climate change. Environ Sci Pol 12:427–437 Kassie M, Zikhali P, Manjur K, Edwards S (2009) Adoption of sustainable
agriculture practices: evidence from a semi-arid region of Ethiopia. Nat Resou Forum 33:189–198
Ketema M, Bauer S (2012) Determinants of adoption and labour intensity of stone terraces in eastern highlands of Ethiopia. J Econ Sustain Develop 3:7–17 Kothari CR (2004) Research methodology: methods and techniques. New age
international (P) Ltd, New Delhi
Kurukulasuriya P & Mendelsohn R (2006) Crop selection: adapting to climate change in Africa. Centre for Environmental Economics and Policy in Africa, Pretoria: Discussion Paper No. 26
Lobell D, Burke M, Tebaldi C, Mastrandrea M, Falcon W, Naylor R (2008) Prioritizing climate change adaptation needs for food security in 2030. Science 319(5863):607–610
Maddison D (2007) The perception of and adaptation to climate change in Africa. Policy research working paper 4308, development research group. The World Bank, Washington DC
Maharjan SK, Sigdel ER, Sthapit BR, Regmi BR (2011) Tharu community’s perception on climate changes and their adaptive initiations to withstand its impacts in Western Terai of Nepal. Int NGO J 6(2):035–042 Available online athttps://www. academicjournals.org/INGOJ, ISSN 1993-8225 ©2011 Academic Journals Mano R, Nhemachena C (2006) Assessment of the economic impacts of climate
change on agriculture in Zimbabwe: a Ricardian approach. CEEPA DP11. University of Pretoria, South Africa
McSweeney C, Lizcano G, New M, Lu X (2010) The UNDP Climate Change Country Profiles: improving the accessibility of observed and projected climate information for studies of climate change in developing countries. Bull Am Meteorol Soc 91(2):157–166
Mertz O, Mbow C, Reenberg A, Diouf A (2009) Farmers’perceptions of climate change and agricultural adaptation strategies in rural Sahel. Environ Manag 43:804–816
Mideksa TK (2009) Economic and distributional impacts of climate change: the case of Ethiopia. Glob Environ Chang 20:278–286
MOA (Ministry of Agriculture) (1998) Agro-ecological zones of Ethiopia. Natural resources management and regulatory department. Ministry of Agriculture, Addis Ababa Molua EL, Lambi CM (2006) The economic impact of climate change on
agriculture in Cameroon. CEEPA DP17. University of Pretoria, South Africa Available:http://elibrary.worldbank.org/doi/pdf/10.1596/1813-9450-4364 [3 Nov 2014]
Moussa KM, Amadou M (2006) Using the CROPWAT model to analyze the effects of climate change on rainfed crops in Niger. CEEPA DP32. University of Pretoria, South Africa Available:http://www.ceepa.co.za/uploads/files/CDP32.pdf. [3 Nov 2014]
National meteorological service agency (2016) Temperature and rainfall data of Assosa Bambasi, Mengie and Sherkole districts (unpublished document) Nkonya E, Place F, Frank P, John P, Majaliwa M, Appollonia O, Edward K, Susana C,
Jupiter N. and Sibray T (2011) Climate risk management through sustainable land management in sub-Saharan Africa. IFPRI discussion paper 01126 Semenza JC, Hall DE, Wilson DJ, Bontempo BD, Sailor DJ, George LA (2008) Public
perception of climate change voluntary mitigation and barriers to behaviour change. Am J Prev Med 35:479–487
Simane B, Zaitchik BF, Foltz JD (2016) Agro-ecosystem specific climate vulnerability analysis: application of the livelihood vulnerability index to a tropical highland region. Mitig Adapt Strateg Glob Chang 21:39–65 Van de Ven WPMM, Van Praag BMS (1981) The demand for deductibles in private
health insurance: a probit model with sample selection. J Econ 17:229–252 Wossen T, Berger T, Di Falco S (2015) Social capital, risk preference, and adoption of
improved farm land management practices in Ethiopia. Agric Econ 46:81–97 Yirga C (2007) The dynamics of soil degradation and incentives for optimal