RESEARCH
Modelling effects of time-variable
exposure to the pyrethroid beta-cyfluthrin
on rainbow trout early life stages
Elke I. Zimmer
1*, Thomas G. Preuss
2, Steve Norman
3, Barbara Minten
4and Virginie Ducrot
2Abstract
Background: Available literature and regulatory studies show that the severity of effects of beta-cyfluthrin (a syn-thetic pyrethroid) on fish is influenced by the magnitude and duration of exposure. To investigate how the exposure pattern to beta-cyfluthrin (constant vs peak) may influence the response of the fish, we used a mechanistic effect model to predict the survival and growth of the rainbow trout over its early life stages (i.e. egg, alevin and swim-up fry). We parameterized a toxicokinetic–toxicodynamic (TKTD) module in combination with a dynamic energy budget model enabling us to describe uptake and elimination, as well as to predict the threshold concentration for survival and sublethal effects (feeding behaviour and growth). This effect model was calibrated using data from an early life stage experiment where trout was exposed to a constant concentration of cyfluthrin. The model was validated by comparing model predictions to independent data from a pulsed-exposure study with early life stages of rainbow trout.
Results: The co-occurrence of effects on behaviour and growth raised the possibility that these were interrelated, i.e. impairment of feeding behaviour may have led to reduced food intake and slower growth. We, therefore, included ‘effect on feeding’ as mode of action in the TKTD module. At higher concentrations, the constant exposure led to death. The model was able to adequately capture this effect pattern in the calibration. The model was able to ade-quately predict the response of fish eggs, alevins and swim-up fry, from both the qualitative (response pattern) and quantitative points of view.
Conclusions: Since the model was successfully validated, it can be used to predict survival and growth of early life stages under various realistic time-variable exposure profiles (e.g. profiles from FOCUS surface water modelling) of beta-cyfluthrin.
Keywords: DEB, TKTD, Pyrethroid, Mechanistic
© The Author(s) 2018. This article is distributed under the terms of the Creative Commons Attribution 4.0 International License (http://creat iveco mmons .org/licen ses/by/4.0/), which permits unrestricted use, distribution, and reproduction in any medium, provided you give appropriate credit to the original author(s) and the source, provide a link to the Creative Commons license, and indicate if changes were made.
Background
Toxicokinetic–toxicodynamic (TKTD) models have been discussed as potential tools to provide an understand-ing of effects of compounds on the physiology of organ-isms and their life-history traits, and most importantly, to capture these effects as a function of time [1]. In recent years, the European Commission and the European Food Safety Authority (EFSA) have recognized the relevance of
these tools in the context of regulatory risk assessment of plant protection products [2]. In recent guidance docu-ments and scientific opinions related to risk assessment for non-target organisms (e.g. birds, mammals, aquatic animals and plants, soil organisms, bees and other non-target arthropods) mechanistic effect models have been mentioned as refinement options for the ecotoxicologi-cal risk assessment of Plant Protection Products (see e.g. [3] for aquatic organisms). In these EFSA documents, models are suggested as means for improving the under-standing of the driving mechanisms of effect and recov-ery patterns, to extrapolate to different exposure profiles,
Open Access
*Correspondence: [email protected]
1 ibacon GmbH, Arheilger Weg 17, 64380 Roßdorf, Germany
seasons, geographic zones and species, as well as to link sublethal endpoints from standard ecotoxicological stud-ies (e.g. growth and reproduction) to the specific protec-tion goals (e.g. populaprotec-tion sustainability). Recently, an EFSA specialist panel published an opinion paper that provides further guidance on how to use TKTD models within the regulatory risk assessment framework [4].
Among available TKTD models, dynamic energy budget (DEB) models seem particularly suited to deal with organism-level effects such as survival, growth and reproduction simultaneously [1, 5]. In a DEB model, the basic metabolic processes such as feeding, growth, repro-duction, maintenance and ageing are included in a single modelling framework. The same model structure can in general be used for various organisms. Species differ-ences are mainly reflected in the parameter values defin-ing the energetic fluxes between metabolic processes [6]. However, some details concerning early life stages, repro-ductive strategies, and starvation responses are species specific. Therefore, a DEB model can be viewed as a mod-ular tool with a core part that describes the general phys-iology of an animal and a suite of extensions (or modules) that describe the species-specific features. Modules needed depend on the species and particular risk assess-ment question at hand. Generally, these types of models belong to the family of bioenergetics models, which have been suggested for the refinement of Tier-2 in the guid-ance document for Good Modelling Practice [2]. Both OECD and EFSA have shown interest in possibilities of using DEB models in ecotoxicology. Biological endpoints derived from DEBtox models (i.e. DEB models with an integrated module for effects of toxicants [7, 8] were deemed adequate tools in the OECD guidance document on statistical approaches for the analysis of ecotoxicity data [9, 10]. More recently, some of the EFSA tenders have explicitly stated DEBtox as a tool that should be included in the environmental risk assessment (e.g. call for mixture toxicity in bees, OC/EFSA/SCER/2013/02; population dynamics of aquatic and terrestrial organ-isms using DEB models, OC/EFSA/SCER/2015/01). The newly published EFSA opinion paper on TKTD models [4] recognises the great potential of the DEBtox model-ling approach for future use in prospective ERA for pesti-cides. However, it is currently seen as limited to research applications due to a lack of well-documented applica-tions in this field.
The aim of this study was to test the suitability of a TKTD model based on DEB theory to explain and pre-dict the effects of (beta-)cyfluthrin on early life stages of rainbow trout (Oncorhynchus mykiss). This fish is the only cold water fish that is recommended for ecotoxico-logical testing by the OECD [11], and it is the standard test species for acute tests based on data requirements.
For chronic tests, only an ELS is possible with trouts and then often other species are tested. It is of great economi-cal importance in many regions of the world and has been identified as one of the most sensitive species to (beta-)cyfluthrin based on acute toxicity data [12].
Beta-cyfluthrin (and the racemic mixture, cyfluthrin) is a synthetic pyrethroid insecticide. Cyfluthrin is a mix-ture of four isomers (two cis and two trans) while beta-cyfluthrin only contains the two active isomers (one cis
and one trans) [13]. Since the two isomers that are left out are not active, we assume that the ecotoxicological effect of beta-cyfluthrin and cyfluthrin is the same. This group of chemicals has a neurological mode of action in insects (e.g. [14]). The effects of cyfluthrin on rainbow trout were evaluated in 1985 in an early life stage (ELS) study using constant exposure, conducted for regulatory purposes (Bayer AG, unpublished; hereafter referred to as ‘Experi-ment 1’). In this study, substantial mortality was observed in mean measured (mm) concentrations of 31.8 ng/L and higher, and significant effects on growth were observed in concentrations of 17.7 ng/L (mm) and higher. In later publications it has been concluded that pyrethroids in general tend to be neurotoxic to fish [15] and that they have been found to induce locomotory abnormalities in rainbow trout [16]. Using the adverse-outcome pathway (AOP) concept, Groh et al. [17] highlighted that locomo-tion impairment by pyrethroids results in reduclocomo-tion in food intake and consequential reduced growth. Never-theless, feeding behaviour of fish—as an assessed param-eter—had not yet been monitored in a beta-cyfluthrin or cyfluthrin study.
shorter body length than the control in the highest con-centration). Based on observations made in Experiment 2 and the conclusions put forward by Groh et al., we hypothesize that observed clinical signs impaired feeding behaviour and consequently growth in both experiments.
Results
Performance of the physiological model
The available DEB model for rainbow trout was tested for suitability to be used in this study (see "Methods" section). All data except the data on oxygen consump-tion met our performance criteria, meaning that the model output for the study and the empirical results did not differ more than the previously defined performance
criteria of 15% deviation (see Additional file 1: Table S2). Since oxygen consumption is irrelevant for the present study, we concluded that the DEB model and the esti-mated parameters were fit for our purpose of predicting survival, length and bodyweight of rainbow trout fry in ELS studies.
Calibration of the DEB model (including the TKTD module): model predictions compared with data from Experiment 1
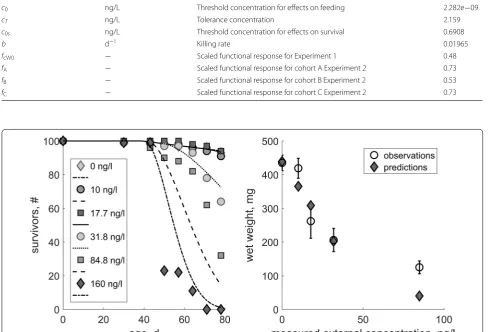
We fitted the TKTD parameters to the constant-exposure data (Experiment 1). Corresponding parameter values can be found in Table 1. A comparison between the pre-dictions and empirical data is shown in Fig. 1. The result-ing relative errors (RE; i.e. the mean of relative differences
Table 1 TKTD parameters and study-specific scaled functional response in Experiments 1 and 2
Symbol Unit DEB definition Value
˙
h0 d−1 Background hazard rate 0.001545
˙
ke d−1 Elimination rate constant 0.0001283
c0 ng/L Threshold concentration for effects on feeding 2.282e−09
cT ng/L Tolerance concentration 2.159
c0s ng/L Threshold concentration for effects on survival 0.6908
b d−1 Killing rate 0.01965
fcW0 − Scaled functional response for Experiment 1 0.48
fA − Scaled functional response for cohort A Experiment 2 0.73
fB − Scaled functional response for cohort B Experiment 2 0.53
fC − Scaled functional response for cohort C Experiment 2 0.73
between model predictions and the data used for model calibration) compared with the empirical data are listed in Table 2. We use the RE to compare it to our previously defined performance criteria to evaluate the performance of the model (see Table 2).
The model outputs were generally very close to the empirical data (see Fig. 1). The difference for survival over time was with a 16.8% overestimation at 84.8 ng/L and 23.5% underestimation at 160 ng/L outside our per-formance criteria (Table 2). Simulated final wet weight deviated beyond the performance criteria for the con-centrations of 17.7 ng/L (17.66% overestimation) and 160 ng/L (68.2% underestimation).
Validation of the DEB model (including the TKTD module): model predictions compared with data from Experiment 2
Results from Experiment 2 showed no beta-cyfluthrin-induced mortality in any of the cohorts. There were no sublethal effects for the cohort exposed as eggs (Cohort C). For the cohort exposed as alevins (Cohort B) the only sublethal effect was a 2-day delay in full onset of swim-up at 450 ng/L compared with the control (although completion of swim-up occurred at the same time as in the control). Swim-up fry (Cohort A) was clearly the most sensitive life stage based on the effects on feeding behaviour and clinical signs. The exposed fry showed an effect on feeding behaviour at 48 ng/L and above, which was reversible. There was no consequent effect on growth (weight and length) at 48 ng/L. Minor effects on growth (as length) were observed at 72 ng/L and above (see Fig. 4 and Additional file 1: Table S6) with a mean length 3.4% less than the control at 72 ng/L and a mean length 6.4% less than the control at 450 ng/L. The highest test concentration (450 ng/L) was the only one that induced clinical signs (e.g. loss of equilibrium). The overall no-observed effect concentration (NOEC) was a nominal
peak concentration of 32 ng/L, based on the effect on feeding behaviour at 48 ng/L. The NOEC for growth (as length) was 48 ng/L.
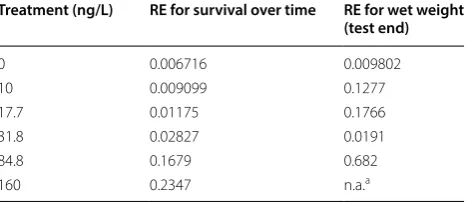
For the three experimental cohorts in Experiment 2, different food levels were estimated (see Table 1). The model predictions of weight, length and survival for Experiment 2 were compared to the empirical data. No significant effect on survival was recorded during the experiment, so we focus the comparison on weight and length at the end of the experiment (see Fig. 2). The simu-lations over time for all cohorts are also shown in Addi-tional file 1: Figures S7–S9. The relative error for the comparison between experimental data and model pre-dictions is shown in Table 3.
The empirical data show a slightly shorter final length of exposed swim-up fry (Cohort A) compared to the control for exposure concentrations of 72 ng/L and above. In the model predictions, this slight reduction in growth is not captured in terms of length, but in terms of weight. No differences from the control were predicted for weight and length at all treatment levels for the fish exposed as alevins.
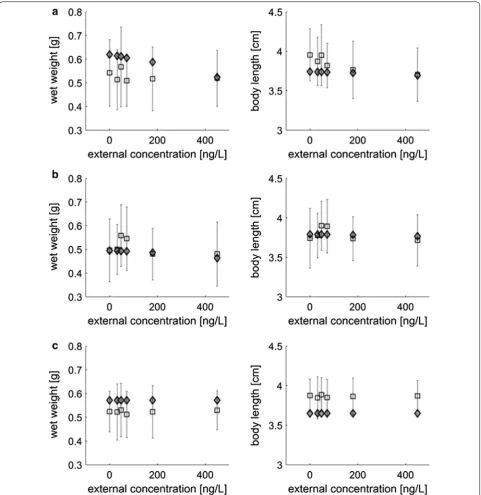
Figure 3 illustrates the predicted internal concentra-tion for all cohorts. The threshold for ‘effect on feeding’, c0S , estimated from Experiment 1, is only slightly above 0 ng/L. For all the cohorts, the predicted internal concen-trations did not exceed the threshold (red line) for lethal effects, so the model predicts no effects on survival up to the highest concentration.
Discussion
Model calibration and validation
The DEB model (with TKTD module) presented here was calibrated using a study where rainbow trout early life stages were constantly exposed to cyfluthrin (Experiment 1), and then used to predict effects where the early life stages were exposed to pulses of beta-cyfluthrin (the istic worst case exposure profile based on the PECs, real-ized in Experiment 2). For some of the concentrations, the effects are overestimated, while for others the effects are underestimated during the calibration. We attribute this discrepancy to the biological variability of the test system. Even though model calibration to the data did not match our performance criteria for high test concen-trations, performance was good during validation test-ing: the model predicted no effects for the experimental conditions tested in Experiment 2, which was in agree-ment with the observations. This is because the lower peak concentrations that were tested in the pulsed-expo-sure experiment (32, 48, 72 ng beta-cyfluthrin/L) were in same order of magnitude as the NOEC of the constant-exposure study (10 ng cyfluthrin/L). At such levels, the Table 2 Calibration: relative errors for the DEB model
predictions when they are compared with the empirical data from Experiment 1 (the constant-exposure ELS study which was used to calibrate the TKTD module)
a All individuals had died before the end of the test and have not been measured
Treatment (ng/L) RE for survival over time RE for wet weight (test end)
0 0.006716 0.009802
10 0.009099 0.1277
17.7 0.01175 0.1766
31.8 0.02827 0.0191
84.8 0.1679 0.682
model performed well during calibration. The tested sce-nario was the worst case scesce-nario, which is why higher peaks (for which the model could not be validated) are not expected to occur. Therefore, we conclude that the model can adequately predict independent data on the outcome for exposed eggs, alevins and swim-up fry, from both the qualitative (response pattern) and quantitative
points of view under realistic exposure scenarios for beta-cyfluthrin.
During model validation, no differences from the control were predicted for weight and length at all treatment levels for the fish exposed as eggs (Cohort C), and very low level effects were predicted for the fish exposed as alevins (Cohort B). This is in full
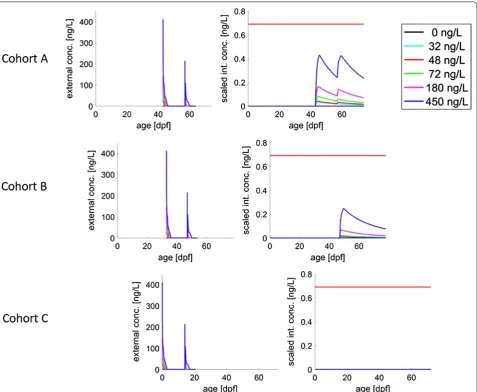
Table 3 Validation: relative errors for the DEB model predictions when they are compared with the empirical data from Experiment 2 (the peak exposure ELS study which was used to validate the TKTD module)
Treatment (ng/L) Cohort A Cohort B Cohort C
RE for length (test
end) RE for wet weight (test end) RE for length (test end) RE for wet weight (test end) RE for length (test end) RE for wet weight (test end)
0 0.1426 0.0537 0.0036 0.0129 0.0901 0.0581
32 0.1958 0.0346 0.0118 0.0035 0.0940 0.0510
48 0.0783 0.0537 0.1173 0.0287 0.0779 0.0608
72 0.1890 0.0221 0.0981 0.0268 0.1163 0.0520
180 0.1358 0.0107 0.0131 0.0124 0.0928 0.0554
450 0.0083 0.0027 0.0366 0.0139 0.0794 0.0571
agreement with conclusions from empirical data. However, data availability for beta-cyfluthrin was not ideal for an in-depth model validation. The data set did not provide any information on effects (since there were hardly any observed) and can thus only be used to illustrate that the model is in agreement with the prediction of no effects. Having a validation study that shows effect would be preferable for further vali-dation of the modelling approach. Moreover, TKTD model calibration and validation is best done using time-dependent data (e.g. [18]). In both ELS studies, the only information on effects on growth is body size measurements at the end of the test (as prescribed in the OECD guideline). For a DEB analysis, ELS studies would yield much more information if measurements on growth over time would be available. Even one addi-tional data point (e.g. weight/length after hatching or at swim-up) would substantially increase the informa-tive value of the data for a DEB analyses and thus the confidence in the subsequent model predictions. Fol-lowing the recently published EFSA opinion on TKTD models (REF), validation data should comprise of at least two exposure profiles with at least 2 pulses each separated by a no-exposure interval of different dura-tion. Moreover, mortality or immobility reported for at least 7 time points. If these rules are followed when conducting modified exposure studies, the data will be useful for the validation of TKTD models.
So far, unfortunately it was not possible to calculate 95% confidence intervals for the parameters using the modelling framework we chose here (Add-My-Pet-framework, AmP; see "Methods" section). Recently, a method to calculate these intervals has been devel-oped and is in the testing phase [19]. Combining our modelling framework with the prediction of 95% con-fidence intervals when testing is completed will make this approach even more suitable for application in environmental risk assessment of chemicals.
Mechanism of effect before swim‑up
The results of the experiments and the modelling suggest that there is no significant effect of (beta-)cyfluthrin on eggs or alevins up to concentrations of 400 ng/L at con-stant exposure and 450 ng/L in a two-peak-exposure sce-nario. This may seem somewhat surprising, since most type I and type II pyrethroids have been found to cause mortality and developmental deformities in zebrafish embryos [20, 21]. It has even been suggested that by default, a potent insecticide exhibits high toxicity to fish [20]. On the other hand, high concentrations of fenvaler-ate (another type II pyrethroid) have previously shown to lead to delayed hatching in zebrafish eggs, but the larvae
that hatched were not found to differ from the control [22]. This supports the finding of our study, which sug-gests that the eggs and alevins are not affected by the compound, and that they only experience the effects of the exposure after swim-up.
One hypothesis that could explain the observed pat-tern lies in the developmental process of the gills in the early life stages of the rainbow trout. The developing trout transition from full cutaneous respiration in the egg to full gill respiration as swim-up larvae (see, e.g. [23]). After hatching, respiration first takes place via the sur-face of the yolk sac, while the gills continue to develop. At feeding, gill development is completed, and respiration takes place fully through the gills. We hypothesize that only at the start of feeding, the uptake rate of the (beta-) cyfluthrin is fast enough to lead to effects. As a simplifi-cation, we thus assume that the uptake of the compound only starts when the fish have started to feed (as can be seen in Fig. 3).
Mechanism of effect after swim‑up
Effects of feeding impairment on growth have previously been deduced using a TKTD modelling approach for effects of imidacloprid in Daphnia magna [24]. In that study, the authors showed with the model that feeding impairment alone was responsible for observed effects on both growth and reproduction. Recently, it was suggested that the AOP framework has the potential to be used in combination with the DEB modelling framework to gain a better understanding of the mechanism of the underly-ing effects [25].
of reduced feeding, and (ii) that this reduced feeding in Experiment 1 was probably a consequence of exposure of post-swim-up fry and not due to previous exposure of these organisms at a non-feeding life stage (i.e. as eggs or alevins).
Lack of mortality and sublethal effects explained by the predicted (scaled) internal concentration
In the model, effects on biological endpoints were linked to the scaled internal concentration, which is presented in Fig. 3. For the simulation of Experiment 2, the pre-dicted scaled internal concentration of beta-cyfluthrin remained below the no-effect concentration for survival (red line) for all cohorts, which is why no compound-induced mortality was predicted by the model. For modelled ‘effects on feeding’, the highest scaled internal peak concentrations were greater than the threshold for effects (blue line; almost zero) in Cohort A and Cohort B, which led to predictions of a slight effect on growth. In reality, in Experiment 2, there were no effects on feed-ing behaviour or growth at all concentrations for Cohort B and at 32 ng/L for Cohort A. We hypothesize that due to the short duration of the (experienced) exposure and fast internal metabolism, the compound did not induce effects on feeding behaviour and growth in these cases.
Effects on growth: length vs weight
In the validation, the model predicted a reduction in weight (Cohort A). However, the actual experimental results showed a slight reduction in length and no sig-nificant effects on weight. In the model, predictions for weight are a combination of structure and reserve (see Additional file 1). Effects on feeding first have an effect on the reserve density, which in turn directly affects weight. Predictions for length are affected when the resources normally used for growth are redirected to other processes, which will happen when the available reserves are not sufficient to cover both maintenance and growth. The data on weight at the end of Experiment 2 show a higher variability than the data on length, which may be caused by biological variability. Effects on length were found to be significant in the highest concentra-tions, but the variability in the weight measurements may have been too large to allow for a determination of effects on weight. The model predicted slight effects on weight for the exposed swim-up fry (Cohort A) at 48 ng/L and above (Fig. 2). However, these predicted effects were not biologically relevant because they were within the range of the variability of the control measurements for weight. A similar effect pattern with even lower intensity was predicted for the alevins (Cohort B).
The model predicted a slight reduction in growth at the highest peak concentration (450 ng/L). Despite this
growth reduction being in the range of the control varia-bility, it could still be predicted by the model. This shows that the model was able to predict the onset of effects on growth, even though the predicted endpoint was not the same. The model predicted that a 16.43% lower growth than the control would occur for exposure peaks of 450 ng/L for swim-up fry. In reality, Experiment 2 showed a 6.4% lower growth than the control at this concentra-tion. Therefore, the model prediction was slightly more conservative than the actual empirical results. Based upon this, we are confident about the predictive power of the model and its relevance to ecotoxicological risk assessment.
Conclusions
to the generic nature of the model, this approach has the potential to be used for any combination of test organism and test substance.
Methods
The DEB model and physiological parameters
Three decades of research into DEB theory has resulted in a database of physiological parameter sets for 1032 organisms ([26], as of 2018/02/18). These parameter sets describe the energetic fluxes within individuals from energy uptake and energy distribution to maintenance, growth, and reproduction. The parameter sets are freely available [26], and can be used in combination with a well-tested Matlab code that has frequently been used (see, e.g. the recent 6th special issue on DEB theory, [27]). A detailed description of the DEB model can be found in Additional file 1. Overall, model outputs are predictions for, e.g. the weight, length and number of offspring along the life cycle of an individual, as well as the survival prob-ability within a group of individuals. Some of the model outputs are directly relevant to ecological risk assessment (e.g. survival and growth, which are directly connected to the protection goals for rainbow trout), while some others contribute to a better understanding of the physi-ological state and stress level of organisms (e.g. energy reserves, respiration, feeding status). If no detailed infor-mation on food intake is available, the so-called scaled functional response f (in between 0 and 1) is used to represent the food level. Hereby, 1 represents ad libitum feeding, and 0 no food.
In the DEB model, transitions from one life stage to another are captured by maturation; a certain level of maturity has to be reached for the organism to transi-tion to the next stage. The transitransi-tion from one life stage to the next is usually accompanied by slight changes in the energy allocation. For example, in the present study, we consider eggs, alevins and swim-ups. In the egg stage, organisms do not feed externally but get their energy from reserves in the egg. After reaching a certain matu-rity level (hatching), the fish transitions to the alevin stage, where the organisms are still not feeding, but get energy from the yolk sac. After reaching another matu-rity level (‘birth’ in the DEB model), the organism tran-sitions to the swim-up stage (‘juvenile stage’ in the DEB model) and starts to feed externally. In this current mod-elling study, we investigated effects in two ELS tests on rainbow trout. Such tests do not include reproduction as an endpoint. Hence, model outputs related to reproduc-tion are not applicable.
The Add‑My‑Pet tool and ‑database
Rainbow trout parameters were taken from the Add-My-Pet (AmP) database ([26], Version 20170527). Note that an updated version of parameters has been published fol-lowing the completion of our modelling study. Changes in parameters do not influence the conclusions drawn from our study. The main difference in the parameters is in the maturity levels for the switches in life stages. As our study concludes that all effects of (beta-)cyfluthrin derive from feeding impairment only and not from direct effects on maturation use of the new parameter set would not gen-erate different results as all other parameters deviate only slightly in the new version. The version we used can be accessed from the AmP website via version control.
For all AmP entries, published data from the litera-ture is used for parameterization. On the AmP website, the so-called AmP-tool is provided, which allows for the estimation of parameters with a well-tested code. Parameter estimation is done based on the minimi-zation of a parameter-free loss function [28, 29]. This function takes the different dimensions of all data sets into account simultaneously keeping all other eters constant, without the need for additional param-eters. The minimum is found using a Nelder–Mead simplex method; a simplex is a set of parameter sets with a number of elements that is one more than the number of free parameters. The specified initial param-eter set, the seed, is one of the elements in the simplex, and the others are generated automatically in its ‘neigh-bourhood’. The simplex method aims to replace the worst parameter set by one that is better than the best one within the set, i.e. gives a smaller value of the loss function. During the procedure, the parameters can be filtered to avoid the combinations of values outside their logical domain [30].
Data usage, model code and parameters are routinely evaluated and tested by the database curators before publication of an entry on the Add-My-Pet database. We conducted a further evaluation of the used code and parameters of the rainbow trout using specific model performance criteria.
Assessing the performance of the physiological model
file 1: Table S2). The general model performance of the physiological model was evaluated by deriving the MRE. The data from 13 publications that were used for calibra-tion, together with the RE, are listed in Additional file 1: Tables S2, S3. Corresponding model predictions are shown in Additional file 1: Figures S1, S2.
The data used for model parameterization stem from experiments from the literature studies that were con-ducted at different temperatures and feeding conditions (Additional file 1: Tables S2, S3). Based on this variability in conditions, and the fact that the DEB model performed well with these parameters, a good model performance can be expected from 2 to 18 °C and for various food conditions.
Details on model equations and an overview of the parameter values used can be found in Additional file 1.
The TKTD module
In the DEB model, effects of toxicants can be included as a disturbance from the normal energy balance and allocation (i.e. under control conditions). These distur-bances are included as changes in the DEB parameters that define these fluxes. Any compound can affect one or more of these parameters. What set of parameters is adapted to account for flux disturbances is referred to as ‘metabolic mode of action’. Potential metabolic modes of action are effects on assimilation, growth, maintenance costs, reproductive output and/or survival (e.g. [7, 8]).
Using a linear differential equation, the TKTD module converts the concentration of the toxicant (the ‘external concentration’) to a resulting concentration of the toxi-cant within the organism (the ‘scaled internal concentra-tion’). We use the scaled internal concentration (scaled by the bioconcentration factor) to reduce the number of parameters that need to be estimated. This concentration has the unit of external concentration, and the module only has one parameter to describe uptake and elimina-tion of the compound [8]. The module provides a link of internal concentrations to effects. The link of external concentration to effects is equivalent to the more com-monly known generalized unified threshold model for survival (GUTS, [18]), with the novelty of extending this method to sublethal effects. Compound effects can thus be included into a DEB model by adding a TKTD mod-ule that links internal concentrations to metabolic modes of action. This enables separation of species-specific and compound-specific parameters. Thereby the species model is generic and parameterization should not change for a specific compound. Thus, only the TKTD param-eters are needed to be calibrated using experimental data because we have already shown that the DEB model for the rainbow trout fulfils our model performance crite-rion. The equations for the TKTD module have previ-ously been published [8] and can be found in Additional file 1.
Experimental data
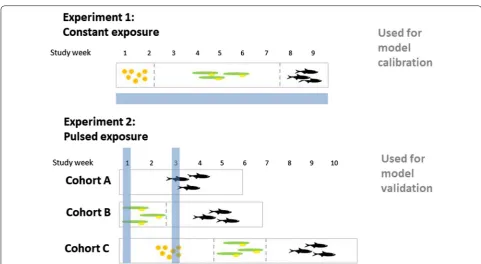
Experimental data used were derived from unpublished experiments that were used in the risk assessment of beta-cyfluthrin. A detailed description of both experi-ments can be found in Additional file 1; the main impor-tant details of the methods and the main results of the experiments are summarized below. The difference between the two ELS studies used is illustrated in Fig. 4.
Calibration data set: Experiment 1
As a calibration data set for the TKTD module, a con-stant-exposure ELS study was used [Experiment 1]. In Experiment 1, rainbow trout, starting as newly fertilized eggs, were exposed to mean measured (mm) test con-centrations of 10, 17.7, 31.8, 84.8 and 160 ng cyfluthrin/L and monitored for 58 days at constant exposure. Sur-vival was recorded weekly, and wet weight was meas-ured at the end of the experiment. The weights at the end of the test as well as survival over time are reported in Additional file 1: Tables S4, S5). In total, 100 individu-als were exposed (20 per concentration tested split into two replicates each). We chose to use the total number of survivors for modelling to remove effects of having two replicates. This experiment revealed that mortality at the highest concentration tested started at 30 days after the start of exposure (after swim-up of the fry), with a rapid increase within few days (see Additional file 1: Table S5). Organisms surviving the whole study duration had a concentration-dependent lower weight than the control organisms. Additionally, behavioural abnormalities were recorded but their nature was not specified in the report. The experimental data demonstrated no effects when the organisms were eggs and alevins (both of which are sed-entary and do not feed). The NOEC for observed behav-iour, final body weight, and survival derived from this study was 10 ng/L.
Validation data set: Experiment 2
In a peak-exposure experiment [Experiment 2], five dif-ferent peak concentrations were studied in a realistic worst case two-pulse profile with peaks of 32, 48, 72, 180 and 450 ng beta-cyfluthrin/L (nominal concentrations). The exposure profiles were derived from the different PEC profiles. The two peaks occurred at a 14-days time interval. After each peak, the beta-cyfluthrin dissipated from the water column, with a DT50 of around 4 h.
Three different early life stages were exposed to beta-cyfluthrin and then followed until a minimum of 14 days after full establishment of free feeding of the swim-up fry stage. For an overview, see Additional file 1: Figure S3. To ensure that in the early life stages each received both pulses of exposure, the three life stages were exposed
simultaneously within a single test system. Hence, the test began with groups of newly fertilized eggs (called ‘Cohort C’), alevins (called ‘Cohort B’), and early-post-swim-up fry (called ‘Cohort A’). There were four replicate test systems for the control and the five treatment levels.
Test endpoints were hatching rate, time to reach the swim-up stage, feeding behaviour after swim-up, clinical signs, survival, and weight and length at the end of the test.
Calibration of the TKTD module using Experiment 1
We incorporated the TKTD module into the previ-ously described AmP-code of the DEB model [26] for the parameter estimation of the TKTD module and fol-lowed a stepwise approach during calibration. Parameter estimates are based on simultaneous minimization of a weighted sum of squared deviations between the data set and model predictions (i.e. ‘loss function’) [30].
Before the parameterization of the TKTD module, the basic DEB parameters for rainbow trout and the control treatment data from Experiment 1 were used to estimate the food availability in that experiment by estimating the scaled functional response. Subsequently, we estimated the background hazard rate h0˙ using the mean survival of the control and of the concentrations that showed no significant effect on survival (0, 10 and 17.7 ng/L). As a next step, the remaining five parameters for the TKTD module (see Table 1) were estimated simultaneously. During the TKTD parameter estimation, the observed onset of effect patterns could only be matched by assum-ing that the uptake of the compound started after the fish had started to feed (swim-up), and not before. This is a simplified assumption that will be further discussed in "Discussion".
Validation of the TKTD module using Experiment 2
For model validation, predictions using environmen-tal conditions of Experiment 2 were compared to data obtained in this experiment.
As a first step, the scaled functional response f was adapted to match the final bodyweight and length of the control of the different cohorts in Experiment 2. Note that f only applies for the last life stage, the swim-up fry. This step ensures that control growth is set adequately in the model. Then, the measured exposure concentra-tions over time in Experiment 2 were used as an input to the TKTD module. Next, the DEB model (with the TKTD module) was run and the predictions of body weight and body length were compared with the empiri-cal data from Experiment 2. To avoid making further assumptions for the initial conditions of the different cohorts, the simulations for all cohorts were initiated using newly fertilized eggs, and exposure timing was adapted accordingly.
Additional file
Additional file 1. The Additional file includes additional information on the experimental data used in the modelling study, as well as the model equations and fits of the basic physiological model.
Abbreviations
TKTD: toxicokinetic–toxicodynamic; GUTS: generalized unified threshold model for survival; DEB: dynamic energy budget; EFSA: European Food Safety Authority; ELS: early life stage; MRE: mean relative error; RE: relative error; AmP: Add-My-Pet; NOEC: no observed effect concentration; FOCUS: FOrum for the Co-ordination of pesticide fate models and their USe; OECD: Organisation for Economic Co-operation and Development; AOP: adverse-outcome pathway; DT50: time required for the disappearance of 50% of the applied substance; PEC: peak-exposure concentrations.
Authors’ contributions
EIZ: Performed the data analyses and modelling and drafted the manuscript. TGP: Structuring of the study, advice on calibration and interpretation. Revision of the manuscript. SN: Linking the model with the data writing parts improving the readability of the manuscript. Giving advice about fish physiology. BM: Critical analysis of the experimental data and the linkage of the model to the data. VD: Idea for the study. All authors read and approved the final manuscript.
Author details
1 ibacon GmbH, Arheilger Weg 17, 64380 Roßdorf, Germany. 2 Bayer AG
Crop-Science Division, 40789 Monheim Am Rhein, Germany. 3 RidgewayEco Harwell
Innovation Centre, Oxfordshire OX11 0QG, UK. 4 ADAMA Deutschland GmbH,
Edmund-Rumpler-Str. 6, 51149 Cologne, Germany.
Acknowledgements
The authors thank Tjalling Jager for valuable comments on a draft version of the manuscript.
Competing interests
The authors declare that they have no competing interests.
Availability of data and materials
All data generated or analysed during this study are included in this published article and its Additional file.
The physiological model for rainbow trout and the data used for its parameterization are available from: https ://www.bio.vu.nl/thb/deb/debla b/ add_my_pet/entri es_web/Oncor hynch us_mykis s/Oncor hynch us_mykis s_res. html, Version: 20170527.
Consent for publication Not applicable.
Ethics approval and consent to participate
Not applicable—we used experiments for the modelling that had been conducted for the risk assessment of beta-cyfluthrin.
Funding
This project was funded by Bayer AG.
Publisher’s Note
Springer Nature remains neutral with regard to jurisdictional claims in pub-lished maps and institutional affiliations.
Received: 20 June 2018 Accepted: 25 August 2018
References
1. Jager T, Vandenbrouck T, Baas J, De Coen WM, Kooijman SALM (2010) A biology-based approach for mixture toxicity of multiple endpoints over the life cycle. Ecotoxicology 19:351–361
2. EFSA PPR Panel (EFSA Panel on Plant Protection Products and their Residues) (2014) Scientific Opinion on good modelling practice in the context of mechanistic effect models for risk assessment of plant protec-tion products. EFSA J 12(3):3589
3. EFSA PPR Panel (EFSA Panel on Plant Protection Products and their Residues) (2013) Guidance on tiered risk assessment for plant protection products for aquatic organisms in edge-of-field surface waters. EFSA J 11(7):3290
4. EFSA PPR Panel (EFSA Panel on Plant Protection Products and their Residues), Ockleford C, Adriaanse P, Berny P, Brock T, Duquesne S, Grilli S, Hernandez-Jerez AF, Bennekou SH, Klein M, Kuhl T, Laskowski R, Machera K, Pelkonen O, Pieper S, Smith RH, Stemmer M, Sundh I, Tiktak A, Top-ping CJ, Wolterink G, Cedergreen N, Charles S, Focks A, Reed M, Arena M, Ippolito A, Byers H and Teodorovic I (2018) Scientific Opinion on the state of the art of Toxicokinetic/Toxicodynamic (TKTD) effect models for regulatory risk assessment of pesticides for aquatic organisms. EFSA J 16(8):e05377. https ://doi.org/10.2903/j.efsa.2018.5377
5. Kooijman SALM (2010) Dynamic energy budget theory for metabolic organisation. Cambridge University Press, Cambridge, United Kingdom 6. Nisbet RM, Muller EB, Lika K, Kooijman SALM (2000) From molecules
to ecosystems through dynamic energy budget models. J Anim Ecol 69(6):913–926. https ://doi.org/10.1111/j.1365-2656.2000.00448 .x
7. Kooijman SALM, Bedaux JJM (1996) Analysis of toxicity tests on daphnia survival and reproduction. Water Res 30:1711–1723
8. Jager T, Zimmer EI (2012) Simplified dynamic energy budget model for analysing ecotoxicity data. Ecol Model 225:74–81. https ://doi. org/10.1016/j.ecolm odel.2011.11.012
9. OECD (1998) Report of the OECD workshop on statistical analysis of aquatic toxicity data. [OECD] Organization for Economic Cooperation and Development. In: Series on testing and assessment. OECD, Paris, France, Number 10
10. OECD (2006) Current approaches in the statistical analysis of ecotoxicity data: a guidance to application. [OECD] Organization for Economic Coop-eration and Development. In: Series on testing and assessment. OECD, Paris, France, Number 54
12. Lewis KA, Tzilivakis J, Warner D, Green A (2013) An international database for pesticide risk assessments and management. Human Ecol Risk Assess Int J 22(4):1050–1064. https ://doi.org/10.1080/10807 039.2015.11332 42
(PMID: 23425205)
13. Leicht FRW, Londershausen M (1996) Stability and biological activity of cyfluthrin isomers. Pestic Sci 48:325–332
14. Field LM, Davies TGE, O’Reilly AO, Williamson MS, Wallace BA (2017) Voltage-gated sodium channels as targets for pyrethroid insecticides. Eur Biophys J 46:675–679. https ://doi.org/10.1007/s0024 9-016-1195-1
15. Shafer TJ, Meyer DA (2004) Effects of pyrethroids on voltage-sensitive cal-cium channels: a critical evaluation of strengths, weaknesses, data needs, and relationship to assessment of cumulative neurotoxicity. Toxicol Appl Pharmacol 196(2):303–318. https ://doi.org/10.1016/j.taap.2003.12.013
16. Goulding AT, Shelley LK, Ross PS, Kennedy CJ (2013) Reduction in swim-ming performance in juvenile rainbow trout (Oncorhynchus mykiss) following sublethal exposure to pyrethroid insecticides. Comp Biochem Physiol C Toxicol Pharmacol 157(3):280–286. https ://doi.org/10.1016/j. cbpc.2013.01.001
17. Groh KJ, Carvalho RN, Chipman JK, Denslow ND, Halder M, Murphy CA, Roelofs D, Rolaki A, Schirmer K, Watanabe KH (2015) Development and application of the adverse outcome pathway framework for understand-ing and predictunderstand-ing chronic toxicity: I. Challenges and research needs in ecotoxicology. Chemosphere 120:764–777. https ://doi.org/10.1016/j. chemo spher e.2014.09.068
18. Jager T, Albert C, Preuss TG, Ashauer R (2011) General unified threshold model of survival—a toxicokinetic-toxicodynamic framework for eco-toxicology. Environ Sci Technol 45(7):2529–2540. https ://doi.org/10.1021/ es103 092a (PMID: 21366215)
19. Stavrakidis-Zachou O, Papandroulakis N, Lika K (2018) A deb model for european sea bass (dicentrarchus labrax): parameterisation and applica-tion in aquaculture. J Sea Res. https ://doi.org/10.1016/j.seare s.2018.05.008
20. Katsuji H (1989) Toxicity of pyrethroid insecticides to fish. Environ Toxicol Chem 8(5):381–391. https ://doi.org/10.1002/etc.56200 80504 . https :// setac .onlin elibr ary.wiley .com/doi/pdf/10.1002/etc.56200 80504
21. DeMicco A, Cooper K, Richardson JR, White L (2010) Developmental neurotoxicity of pyrethroid insecticides in zebrafish embryos. Toxicol Sci 113(1):177–86
22. Ma Y, Chen L, Lu X, Chu H, Xu C, Liu W (2009) Enantioselectivity in aquatic toxicity of synthetic pyrethroid insecticide fenvalerate. Ecotoxicol Environ Saf 72(7):1913–8
23. Holeton GF (1971) Respiratory and circulatory responses of rainbow trout larvae to carbon monoxide and to hypoxia. J Exp Biol 55(3):683–94 24. Agatz A, Cole TA, Preuss TG, Zimmer E, Brown CD (2013) Feeding
inhibition explains effects of imidacloprid on the growth, maturation, reproduction, and survival of daphnia magna. Environ Sci Technol 47(6):2909–2917. https ://doi.org/10.1021/es304 784t (PMID: 23425205) 25. Ashauer R, Jager T (2017) Physiological modes of action across species
and toxicants: the key to predictive ecotoxicology. Environ Sci Process Impacts. https ://doi.org/10.1039/C7EM0 0328E
26. Amp, online database of deb parameters, implied properties and refer-enced underlying data (2017). http://www.bio.vu.nl/thb/deb/debla b/ add_my_pet. Accessed 17 July 2017
27. Augustine S, Kooijman SALM (2018) A new phase in deb research. J Sea Res. https ://doi.org/10.1016/j.seare s.2018.06.003
28. Marques GM, Augustine S, Lika K, Pecquerie L, Domingos T, Kooijman SALM (2018) The AmP project: comparing species on the basis of dynamic energy budget parameters. PLoS Comput Biol 14:5 29. Marques GM, Lika K, Augustine S, Pecquerie L, Kooijman SALM (2018)
Fitting multiple models to multiple data sets. J Sea Res. https ://doi. org/10.1016/j.seare s.2018.07.004