R E S E A R C H
Open Access
An application of item response theory to
psychological test development
Cristian Zanon
1*, Claudio S. Hutz
2, Hanwook (Henry) Yoo
3and Ronald K. Hambleton
3Abstract
Item response theory (IRT) has become a popular methodological framework for modeling response data from assessments in education and health; however, its use is not widespread among psychologists. This paper aims to provide a didactic application of IRT and to highlight some of these advantages for psychological test development. IRT was applied to two scales (a positive and a negative affect scale) of a self-report test. Respondents were 853 university students (57 % women) between the ages of 17 and 35 and who answered the scales. IRT analyses revealed that the positive affect scale has items with moderate discrimination and are measuring respondents below the average score more effectively. The negative affect scale also presented items with moderate discrimination and are evaluating respondents across the trait continuum; however, with much less precision. Some features of IRT are used to show how such results can improve the measurement of the scales. The authors illustrate and emphasize how knowledge of the features of IRT may allow test makers to refine and increase the validity and reliability of other psychological measures.
Keywords:Item response theory, Graded response model, Psychological assessment, Affects
Background
Valid and reliable measures are essential to the field of psychology, as well as, to the study of abilities, aptitudes, and attitudes. In this sense, classical test theory (CTT) has been extensively serving the testing field for about 100 years. However, the implementation of item response theory (IRT) to psychological and educational assessment has caused major and positive changes to psychological test development (see, for example, Hambleton & Jodoin, 2003). The use of IRT with test development has several advantages over CTT mainly because IRT produces per-son parameter invariance (test scores are not dependent on the particular choice of test items) when model fit is present, and test information functions provide the amount of information or “measurement precision” cap-tured by the test on the scale measuring the construct of interest (Embretson, 1996; Hambleton et al. 2000) and other features too. These features and others along with CTT drawbacks, have led the authors of this paper to introduce Samejima`s (1969) graded response model
(GRM). Estimation of latent ability using a response pat-tern of graded scores. Psychometrika (1969) graded re-sponse model (GRM), the topic of model fit, and other important characteristics of IRT analysis, to the develop-ment of psychological tests. In addition, another goal of this paper is to present a comprehensible application of the GRM, to interpret these results, and to highlight the importance of the findings provided by these analyses for psychological test development.
The topics regarding CTT, IRT, item and ability param-eter invariance, IRT assumptions, the GRM and model fit will be presented and explained. The remainder of the paper will introduce an application of the GRM to our data, the methodology used, and how these results can be considered in order to refine the Affect Scale.
Classical test theory
As Gulliksen (1950) presented, and many readers know, within a CTT framework, item statistics are examinee sample-dependent for CTT models. This means that test item statistics are very dependent on the sample of ex-aminees used in item calibration. But it would facilitate test development if the item statistics were not directly tied to the choice of examinee sample. In a similar way,
* Correspondence:[email protected]
1Department of Psychology, Universidade São Francisco, Alexandre Rodrigues Barbosa Str. 45, Itatiba 13251-900SP, Brazil
Full list of author information is available at the end of the article
examinee test scores too are dependent on the choice of test items. This means, for example, for examinees to be compared, they need to either take the same test items, or statistically equivalent test items. But there are times when better testing would result if the choice of test items was matched to the examinees’ ability levels. Examinees scoring high on a construct might receive more challen-ging items, for example. But individualing the choice of test items, would limit the possibility of comparing exam-inees. Next, four limitations of CTT are presented (and for another perspective, see Embretson, 1996).
The first shortcoming of CTT is that the interpret-ation of respondent characteristics depend on the test used. Respondents will appear smarter, if an easier test is administered, but will look like less smart, if a more dif-ficult test is answered. The second shortcoming of CTT is that test characteristics are sample-dependent. The same test administered in a group of high ability stu-dents and in another group of low ability stustu-dents will produce items with different levels of difficulty, for ex-ample. In the first sample, items difficulty will appear lower than the difficulty for the second group. These shortcomings imply that test characteristics can only be done in the same context (sample). Once, test parameters depend on persons’ latent trait and vice versa, item and test characteristics will change when other persons (sam-ples with different levels of latent trait) answer the test.
The third shortcoming of CTT is that the theory as-sumes that errors of measurement are equal for all per-sons. This is problematic because persons with different levels of ability will show different levels of error (guess-ing) in a test that evaluates intelligence or any other con-struct, for example. The fourth shortcoming of CTT is that it does not allow accurate predictions about possible results for a respondent or for a sample on an item, using only their ability scores. This information would be im-portant for a test designer interested in developing a test for a population with specific characteristics. All these points can be addressed effectively with IRT, if of course an IRT model can be found that fits the test data.1
Item response theory development and properties
IRT was initially developed in the 1950s and 1960s by Frederic Lord and other psychometricians (Lord, 1952; Lord & Novick, 1968) who had the goal of developing a method able to evaluate respondents without depending on the same items included in the test (Hambleton & Jodoin, 2003). Therefore, IRT evolved from classical measurement theory with the purpose of overcoming many of its limitations (Hambleton, 1994). IRT is a stat-istical theory comprised of a variety of mathematical models that have the following characteristics: a) to pre-dict person scores based on his/her abilities or latent
traits and b) to establish a relationship between person’s item performance and the set of traits underling item per-formance through a function called the“item characteris-tic curve” (Hambleton et al. 1991). These characteristics are possible because IRT models provide item and ability parameter invariance for test items and persons, when the IRT model of interest actually fits the available test data. In other words, the same items used in different samples will keep their statistical properties (for instance, difficulty and discrimination), and persons’ scores that represent ability or latent traits on a specific construct will not de-pend on the particular test items they were administered.
The role of item and person parameter invariance in IRT Parameter invariance is not a mysterious property that IRT confers to items and tests. It refers to population quantities, rather than sample quantities, which are as-sumed to be identical across groups or measurement conditions (Rupp & Zumbo, 2004).2 Parameter invari-ance is not exclusively found on IRT models. For in-stance, multiple regression analysis may also show such properties, once the residuals (distance between ob-served and expected scores) are considered small enough to assume that the equation which builds the model fits equally well data from different populations (Hambleton, 2005). If parameter variance is obtained in different populations, inferences and generalizability of the results will be threatened and probably be mislead-ing (Rupp & Zumbo, 2004).
Conceptually, it is not assumed that the same scores will be found if one person responds twice to the same test (Lord and F. M. A theory of test scores. Psychome-trika 1952) because of learning, motivation level, fatigue effects, and other measurement errors. However, it is as-sumed that a respondent with similar latent traits will obtain similar scores (apart from measurement errors) on the same or on a completely different test built to evaluate the same construct. In addition, persons with different latent traits will preserve the same difference among their scores, if they answered a parallel form of the test.
IRT assumptions
There are two basic assumptions that pertain to all unidi-mensional3 IRT applications: unidimensionality and the shape of the item characteristic curves (ICC) (Hambleton
the hypothesis of a single factor). Other new recom-mended techniques, although not very often used, to evaluate unidimensionality are the Tetrad analysis and the Hull method (Yu et al. 2007; Lorenzo-Seva et al. 2011). We suggest readers interested in test unidimensionality see Hattie (1985) for a deep review about the topic.
The second assumption is that ICC, specified by the model, reflect the relationships between the latent traits and the item responses. When the test items are binary scored (e.g., true-false, or yes-no), ICCs tend to be S-shaped curves and match the probabilities of examinees successfully answering a test item as a function of their ability. Test items that are easy are shifted to the left on the scale measuring the trait, and items that are hard are shifted to the right end of the measuring scale. Discrim-inating items have higher slopes than lower discriminat-ing items. With appropriate model fit, the ICC match up closely to the actual test data.
1PLM, 2PLM and 3PLM: models for binary data
Three common IRT models for binary data are the one, two and three parameter logistic models. They differen-tiate themselves for the number of parameters estimated. Using the one-parameter logistic model (1PLM), it is possible to estimate the probability that someone will answer the item (of difficulty, b) correctly. The Two-Parameter Logistic Model (2PLM) also aims to estimate the probability of a correct answer, but it also allows es-timating the discrimination of the item (a). The bigger the value of“a”, the stepper the slope of the ICC and the more discriminant the item is providing. The Three-Parameter Logistic Model (3PLM) estimates the other two parameters described (a and b) and also the prob-ability for guessing (the “c” parameter). Imagine that sometimes students get right answers by guessing an al-ternative in the item. The inclusion of the c parameter allows the model to estimate the effect of guessing on item difficulty and on examinees final scores, for ex-ample. See Hambleton et al. (1991) for a thorough de-scription of these models. This c parameter is especially important with achievement data. However, when our test is composed by other types of items (polytomous, for example), IRT estimation should use other models.
Graded response model
In this section, we will introduce some equations that represent relevant aspects of the Graded Response Model, as well as, item parameter estimates, and model fit. One of the most popular models used for polyto-mous items, common with many psychological tests, is the GRM (Samejima F. Estimation of latent ability using a response pattern of graded scores. Psychometrika 1969). This model is appropriate to use when dealing with ordered categories on a rating scale (e.g., a Likert
scale reflecting levels of agreement or disagreement) and is considered a generalization of the two-parameter lo-gistic model (2PL) (Keller, 2005). According to Keller, the 2PL model is used to provide the probability that someone has to receive a specific score (or higher), given the level of the underlying latent trait. The more of the trait (positive affect, for instance) possessed by respon-dents, the more likely they are to respond with answers that receive higher scores, or the more likely they are to choose one of the more positive ratings on the items of the scale (Hambleton, 2005).
In GRM, the probability Pikð Þθ that a person’s
re-sponse falls at or above a particular ordered category givenθ(level of latent trait) may be expressed as follows on equation 1:
P
ikð Þ ¼θ
exp aiθj−bik
1þ exp aiθj−bik ð1Þ
This equation is known as boundary characteristic function of itemifor categoryk. The parameterairefers
to the slope of the function or item discrimination. This parameter is constant for all categories of the same item. Different items will probably present different discrimi-nations though. Thebikparameter, also called threshold
parameter, refers to the latent trait level in which the probability of answering at or above the particular cat-egory equals 50 % (Hambleton et al. 2011).
GRM considers items as a series ofK–1 dichotomous items, in whichKrepresents the number of categories in the Likert scale or other ordered category scales. If a 5-point scale that goes, say, from 0 to 4 is used, then, the following dichotomies are analyzed for each item: 0 vs. 1, 2, 3, 4; 0, 1 vs. 2, 3, 4; 0, 1, 2 vs. 3, 4; and 0, 1, 2, 3 vs. 4. Because the probability of respondents choosing the lowest category, or any of the higher score categories is 1, Pi0ð Þ ¼θ 1 , the threshold parameter for the lowest
category is not estimated. Also, the probability of an-swering above the highest category must be zero, the probability of responding in the highest category is equal to the highest cumulative score category function. The other probabilities based on the other combinations, given θ, are computed by subtracting the adjacent Pik
θ
ð Þ . The general expression for this is given on equation 2:
P
ikð Þ ¼θ Pikð Þθ −Pi kð þ1Þð Þθ ð2Þ
Or specifically, as presented on equations 3 through 7:
Pi0ð Þ ¼θ 1 ð3Þ
Pi1ð Þ ¼θ Pi1ð Þθ −Pi2ð Þθ ð4Þ
Pi3ð Þ ¼θ Pi3ð Þθ −Pi4ð Þθ ð6Þ
Pi4ð Þ ¼θ Pi4ð Þθ ð7Þ
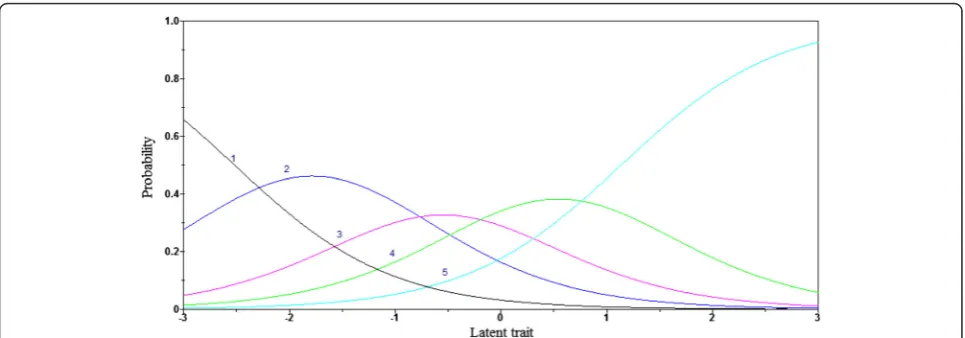
Figure 1 presents a graphical representation of the cat-egory response functions (CRF) (in terms of probabilities of each rating category over the latent trait scale) for an item and constitutes an example of how we will evaluate negative and positive affect items. The latent trait is conventionally presented in the standardized form that goes from -3 to 3. The mean of trait scores on the con-struct of interest is set to 0 and the standard deviation to 1. These scores can always be transformed later to a more convenient scale (and they would be with most if not all psychological scales). The a parameter for this item is .80 and the b parameters or thresholds for the second, third, fourth and fifth categories are respect-ively -2.52, -1.05, -0.05, 1.14. Again, the first category is not estimated since the probability of getting a score of zero or higher is always 1.0. CRF represent the prob-abilities for responding to each of the five response cat-egories as a function of respondents’level of latent trait (Hambleton, 2005), as, for example, negative and/or positive affect. For example, a person with high levels of negative affect is more likely to choose higher values (as, “this item describes me completely”) on the Likert type item that says: “Many times, I feel nervous.” CRF can be used to identify items with low category discrim-ination and spread.
Fitting the graded response model
To gauge how well the chosen model can predict re-spondent scores and generate item statistics that are in-variant over samples of respondents, it is essential to measure model fit. This involves fitting the GRM to the data, and to estimating item and latent trait parameters.
Usually, different models are tested in order to know which one provides better fit. In this case, another possi-bility, the partial credit model (Masters, 1982), was not used because it constrains the discrimination power (a parameter) to be equal for all items. As indicated by one anonymous reviewer, another useful model is the Gener-alized Partial Credit Model (GPCM: Muraki, 1992) that implements a varying slope parameter and can be used with dichotomous and polytomous items. The GPCM constitutes a useful tool for psychometricians when the categories of Likert-type scales are not spaced. In the educational field, for example, the 0, 1, and 2 points might indicate different degrees of correctness of an an-swer: 0-incorrect; 1-partial credit; 2-full credit. In the context of affect evaluation, the GPCM might indicate that some categories are more used than others –what does not occur with the GRM that assumes the categor-ies are spaced. A comparison of GPCM and GRM with data from the Affect Scale may result in another useful paper. But it should be noted that often the GPCM and GRM provide very similar results and parameters in the GRM seem easier to explain to practitioners.
The GRM can be fitted using PARSCALE (Muraki & Bock, 1993). We will provide item parameter estimates and chi-square results as model fit findings (see, Table 1 and Table 2 in the Result section).χ2statistics are com-mon indicators of model fit, however, some drawbacks need consideration.
Because χ2 statistics are susceptible to sample size, small samples might not reject the null-hypothesis (that states that the item does fit the model) even when the fit is poor. On the other hand, large samples might present significant results even when the fit is appropriate. Therefore, other procedures like evaluating expected and observed scores, as well as, expected and observed residuals (raw and standardized) are considered more
reliable indicators of model fit (Han & Hambleton, 2007; Liang et al. 2008). Residuals are the difference between expected scores, based on model estimation, and actual results. Standardized residuals are calculated dividing raw residuals by their standard errors. This step was done using ResidPlot-2 (for more details, see Liang et
al., 2008).
It is expected that a good fitting model generates stan-dardized residuals (approximately) normally distributed. So, if the model satisfies this assumption, positive evi-dence of model fit is available. There is no rule of thumb to gauge how“approximately normal”is accepted, so the researcher should take into account the consequences of estimation based on a misfitted model. These conquences might include how many persons will not be se-lected to be part of a program, or how much a correlation used in research might be underestimated due to poor measurement. At the item level, standard-ized residuals might be expected between -2 and 2. Items with residuals out of this interval might indicate poor fit and suggest substitutions in new versions of the test. To evaluate residuals for all categories in each item
is also important and might provide worthwhile infor-mation about model fit and patterns of answers for each category. For more details about model fit, check the work of Embretson and Reise (2000). The residual evalu-ations supported the GRM fit with the affect scale.
Another advantage of IRT, when compared with clas-sical methods, is to provide item and test information. Item information functions present the contribution of each item to the latent trait measurement. Items with greater discrimination power contribute more to assess-ment precision than items with lower discriminating power. This may seem like similar information to point biserial correlations in classical measurement. The big differences are that the IRT statistics are directly linked to measurement precision and the location on the trait scale where that information is relevant. Summing item information functions (Ii) of the test provides a test
in-formation function (I), as showed on equation 8:
Ið Þ ¼θ Xni¼1Iið Þθ : ð8Þ
This characteristic is especially important and unique to item response models because it allows test makers to easily decide which items to choose based on their inter-ests and also based on the impact of the items on the total test information. If the interest is to select respon-dents that have high levels of the latent trait, items that provide more information on the right hand side of the scale might be chosen to maximize the precision of scores at the higher end of the trait scale.
Test information functions are inversely proportional to standard errors,
SEð Þ ¼θ ffiffiffiffiffiffiffiffiffi1 Ið Þθ
p ð9Þ
So, the more information provided by a test at a par-ticular latent trait, the better the measurement, and the smaller the measurement errors at this level (Hambleton
et al., 2000).
The current study
A common way to conduct research in the field of psychology has been through the use of standardized scales to measure constructs of interest (e.g., affects, op-timism, self-esteem). Test development to evaluate posi-tive and negaposi-tive affect has used the Classical Test Theory (Bradburn, 1969; Fordyce, 1977; Kammann & Flett 1983; Watson et al. 1988), and, more recently, the Item Response Theory (Ebesutani et al. 2013; Lin & Yao, 2009). Some reasons why the IRT is still not widely used, despite its advantages, is probably because: a) it requires a deeper statistical background from the researcher (Embretson, 1996), b) it requires large sample size to es-timate item and ability rather than CTT - approximately,
Table 1Slope, location and chi-square tests for the negative
affect scale
Items Slope (a) Location (b) χ2 df p
1 0.80 -0.62 62.09 61 0.44
2 0.56 -1.14 71.54 65 0.27
3 0.63 -0.73 101.35 62 0.01
4 0.40 0.87 93.87 85 0.24
5 0.62 -0.12 76.99 74 0.38
6 0.70 1.48 85.44 69 0.09
7 0.79 0.10 80.35 74 0.29
8 1.19 0.21 79.65 65 0.10
9 0.56 2.09 93.22 70 0.03
10 0.64 1.23 84.98 76 0.22
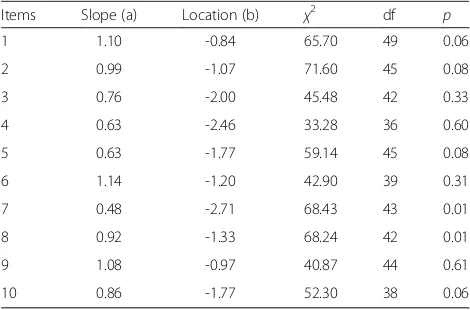
Table 2Slope, location and chi-square tests for the positive
affect scale
Items Slope (a) Location (b) χ2 df p
1 1.10 -0.84 65.70 49 0.06
2 0.99 -1.07 71.60 45 0.08
3 0.76 -2.00 45.48 42 0.33
4 0.63 -2.46 33.28 36 0.60
5 0.63 -1.77 59.14 45 0.08
6 1.14 -1.20 42.90 39 0.31
7 0.48 -2.71 68.43 43 0.01
8 0.92 -1.33 68.24 42 0.01
9 1.08 -0.97 40.87 44 0.61
more than 500 examinee responses are requested to achieve proper estimation results, and c) it was more fo-cusing on individual item, and in psychology back-ground, test-level analysis is more reasonable to evaluate with factor analysis (see, Maydeu-Olivares, 2005, for a comparison between IRT and factor analysis). Modern procedures to improve positive and negative affect esti-mation, however, may contribute to higher discrimin-ation scores among the participants and are critical to the advancement of the field. For this reason, we believe that the readers of the Psicologia Reflexão e Crítica will benefit from a step-to-step description of a sophisticated method to improve test development: the item response theory modeling. Moreover, this paper provides validity and reliability evidences to the Affect Scale (Zanon et al. 2013a)–a standardized test developed to assess positive and negative affect on adults.
What follows is an application of the GRM to the first author’s research to develop and evaluate an affect scale. The goal of the next sections is to provide more details about the application, and show how IRT modeling was helpful in the evaluation of positive and negative affect.
Method Participants
The respondents were 853 university students (57 % women and 43 % men) between the ages of 17 and 35 (M = 21 years, SD = 3). Participation in the study was voluntary. These numbers are very substantial for IRT research and therefore permit item parameter estimation with a high level of precision.
Instrument
Affect Scale (Zanon et al. 2013a) is a self report instru-ment that consists of two independent factors: positive affect and negative affect. Positive and negative affect are characterized by the frequency and intensity of emo-tions and feelings that an individual experiences as ei-ther pleasant or unpleasant (Lyubomirsky et al. 2005). Persons with high scores of positive affect experience frequent and intense episodes of pleasure. They con-sider themselves happy, enthusiastic, and confident. High levels of positive affect are associated with phys-ical health, conjugal and work satisfaction (Naragon & Watson, 2009). Conversely, those persons with high levels of negative affect experience repeated episodes of intense displeasure (Watson, 2005). Generally, these re-spondents perceive themselves as sad, discouraged, and anxious. In general, high levels of negative affect are as-sociated with rumination (Trapnell & Campbell, 1999), anxiety, depression (Miles et al. 2004), and neuroticism (Zanon et al. 2013b).
Each factor (positive and negative) consists of 10 sen-tences representing the various moods and emotions of
persons, such as “I am proud of myself”, and “I have been worried lately”. Each statement is rated by the re-spondents on a 5-point Likert scale. The rating scale is defined by the end points: 1 – this item does not de-scribe me at all, and 5 – this item describes me com-pletely. The higher the number, the more the item describes the respondent, and the lower the number, the less the item describes the respondent.
Procedures
Respondents responded collectively to the question-naires from within their classrooms. Beforehand, the stu-dents were informed that participation in the study was voluntary, and that all information shared would remain confidential. The students were asked to carefully read the questions and respond according to their personal feelings. Data collection was performed in a single ses-sion for each class of students. This study is part of a project approved by Ethics Committee and all ethical procedures were followed on this research.
Results
Internal structure evidence
Factor analysis (with an oblimin rotation) identified two principal factors that explained 38.4 % of the total vari-ance (25.6 % for positive affect and 12.8 % for negative affect). All items had positive factor loadings between .46 and .74 in the first dimension, and between .38 and .77 on the second one. These items presented loadings lower than .40 in the other dimension. Coefficient alpha was .83 for positive affect and .77 for negative affect and the correlation between the factors was -.38. These re-sults were gathered with the same sample used for the IRT analysis and indicate preliminary evidences of valid-ity and reliabilvalid-ity for the Affect Scale.
IRT modeling
slightly higher than the other scale, which meant that the positive affect items were generating more item level and test level information. All items were located on the left hand side of the scale suggesting that many respon-dents were finding it easy to identify with the state-ments. Two items presented significant chi-squares, but again, residual analyses suggested that the model fit was acceptable.
Residual analyses
Raw and standardized scores were analyzed at the item level. Initially, the amount of answers for each category (e.g., 1, 2, 3, 4 and 5) in every single item is compared with the amount of expected answers –produced by the chosen model. Categories without answers or with large discrepancies between observed and expected values in-dicate poor fit. Another procedure is to evaluate how small the residuals (differences between the observed and expected scores from each item) are on the latent trait continuum for each items. An item, for example, might present small residuals on the low part of the con-tinuum, but large residuals on the rest - this also would indicate poor fit. Visual inspection of the residuals on all categories and for each item was conducted for the negative and positive affect.
Residual analyses were interpreted graphically. ResidPlot-2 provides confidence bounds for the expected raw resid-uals on the latent trait continuum for an arbitrary number of intervals (13 in this study), and also provides standard-ized residuals (plotted on 13 intervals) spread over the la-tent trait. For raw residuals, good fitting model is verified when observed residuals are found between the confidence bounds; while for standardized residuals, good fitting model is seen when the plots are between -2 and 2.
At the category level, raw and standardized residuals for the five categories of each item were analyzed. For the raw residuals, this step focused on the observed
residuals out of the confidence bounds, and for the stan-dardized residuals, the number of plots out of -2 and 2 were considered. Regarding the negative affect scale, ap-proximately, 58 % of all categories presented observed residuals between the bounds in all 13 intervals; and 56 % of all categories presented standardized residuals between -2 and 2. For the remaining categories, no more than two observed and standardized residuals were found out of the confidence bounds and -2 and 2 re-spectively in each category. At the item level, similar procedures were conducted. And, most of the observed and standardized residuals again were on the confidence bounds and between -2 and 2. At the test level, observed and expected standardized residual distribution for all items were assessed, along with observed and expected score distribution. Visual inspection revealed small dif-ferences, which suggested acceptable fit.
Regarding the positive affect scale, approximately, 48 % of all categories presented observed residuals be-tween the bounds in all intervals; and 38 % of all cat-egories presented standardized residuals between -2 and 2. No more than three observed and standardized resid-uals were found out of the confidence bounds and -2 and 2 respectively in each category. At the item level, most of the observed and standardized residuals were on the confidence bounds and between -2 and 2; and for all items, again small differences were found between ob-served and expected standardized residuals and score distribution, conferring acceptable fit to the scale.
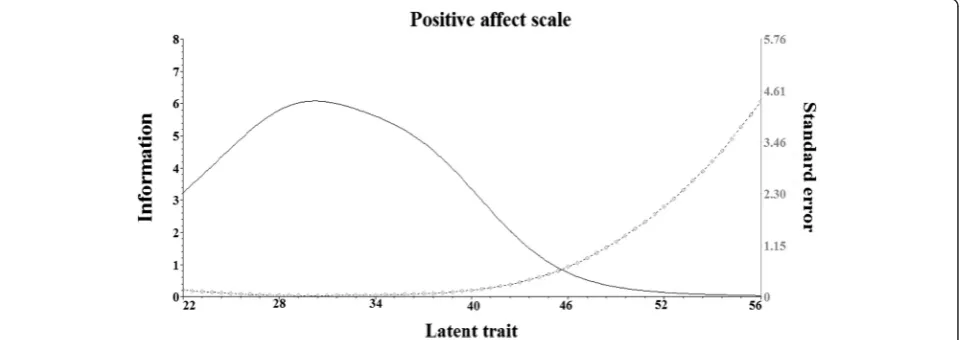
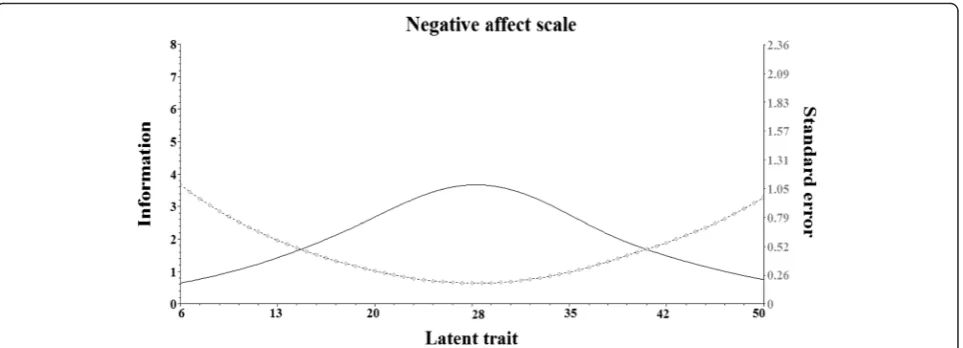
Test information functions
Figures 2 and 3 present test information functions (solid lines) and standard errors (broken lines) to the positive and negative scales, respectively. As shown in Fig. 2, most of the information provided by the scale was below the mean of respondent scores suggesting that the scale was better designed for respondents with lower scores.
Regarding the negative affect scale, the information was well spread over the continuum. However, the amount of information given was much lower than the positive affect scale and less than what was considered accept-able. In a redesign, perhaps the clarity of the negative statements could be improved, and perhaps the addition of a few more items could increase the level of test infor-mation. But historically, negatively worded items have always proved more problematic for respondents.
Discussion
The two most important advantages provided by an IRT application during the development and analyses of these scales are probably item and ability parameter in-variance and test information functions. Many psycho-logical tests used to assess personality, intelligence, attitudes etc. might also benefit from these IRT advan-tages. In research as well as in applied contexts, details about the area in which the latent traits measured by the test are doing better measurement (and how well) would help clinics, researchers or test makers to decide which test is more appropriate for their specific interests. In addition, a test that is free of examinee sample charac-teristics in test development allows for more reliable comparisons among respondents as well as groups (see some recent IRT applications in the Brazilian context: Brant et al. 2015; Carvalho et al. 2013; Knijnik et al. 2014; Lopes, & Bueno, 2014; Muniz et al. 2014).
Often, classical methods exclusively are used to offer evidence of validity and reliability to new tests and this evidence is undoubtedly important. But this paper pro-vides evidence that IRT results can be extremely helpful to complement this evidence with information regarding the quality of the measurement at specific points of the measuring scale. CTT can provide this same information but it is more cumbersome to do so using little known statistics for assessing conditional errors. In this case, it
is clear that the positive affect scale should not be used for the purpose of evaluating people with high levels of positive affect. The amount of information provided by the 10 items is simply not very good at the higher score levels. For this situation to change, more“difficult”items are needed in the scale—items that would be difficult for respondents to agree with and therefore permit better assessment at the high end of the score continuum. Situ-ations in which people are being selected based on their (high level of ) intelligence or other skills/traits might be misleading, unfair, and even unreliable, if the informa-tion funcinforma-tion and errors provided by the test presented similar distribution and values to those shown in Fig. 2.
IRT applications provide different standard errors of measurement at different trait levels. Because standard errors of measurement are used in score interpretations, it is possible to easily create confidence intervals to in-terpret individual scores (Embretson, 1996). So, one can have a range (around the reached score) associated with a probability. The smaller the errors at some level, the smaller the confidence bands. This does not happen with classical methods that nearly always assume the same standard error applies at all trait levels.
As shown in Fig. 3, the quality of the measurement provided by the negative affect scale is spread over the continuum and it is relatively higher at the middle of the scale (around the mean). However, the amount of infor-mation provided is relatively low and reflects items with modest discriminative indices. It raises the question of how well these statements were actually written. Perhaps they were confusing to respondents. Due to parameter invariance properties, these items will keep their psycho-metric characteristics in other applications. So, new items can be included in future revisions of these scales and a reevaluation of the item information functions could be conducted. These procedures can be repeated until one gets the desired test.
According to Embretson (1996), psychologists have had little exposure to IRT especially because it is both relatively new and statistically sophisticated (compared with classical methods), measurement courses have de-clined in graduate programs of psychology so not only are graduate students less knowledgeable about CTT, they may have little or no knowledge of IRT, and be-cause not much understandable material has been fo-cused on psychological issues (most of them are to educational assessment). The latter point was a focal point within this paper. Two introductory books are sug-gested to students and professors interested in IRT (for psychological examples, see Embretson & Reise, 2000; for educational examples, see Hambletonet al., 1991).
This study is not free of limitations. Differential item functioning (DIF) constitutes a serious threat to test val-idity and needs to be further addressed on the items of the Affect Scale. DIF occurs when participants with identical latent trait provide different patterns of answers to some items. This might be the case of items that favor (or disfavor) some sample’s subgroups (e.g., girls and boys, black and white, minorities). Considering that women are more likely than men to present depression symptoms, the investigation of DIF across sex on items of positive and negative affect might reveal possible dif-ferences on these groups.
Conclusion
Lastly, IRT is not a panacea and does not correct prob-lems of misleading items or failure to meet content specifications. It also does not substitute classical methods that were influential and are still important. However, IRT is a worthwhile tool that can and should be used to increase the quality of psychological tests and consequently psychological assessment.
Endnotes
1
As indicated by one anonymous reviewer, this might not be the case for Rasch models because is expected that the data fit the model and not the opposite. Our position, however, is that models that do not fit the data are of little value and removing items from the test to fit the model can decrease its content validity. The Rasch model also assumes that test items are all equally dis-criminating and this assumption runs counter to the widely held view that test items in practice often differ in both their difficulty levels and discriminating powers.
2
Measurement invariance depends on the degree of representativeness of the sample in the population being studied. Thus, parameter invariance might not hold for samples with extremely different characteristics.
3
There are IRT models that are multidimensional and do not require evidence of unidimensionality. See Reck-ase (2009) for multidimensional IRT models, and Kose
and Demirtasli (2012) for a comparison between uni and multidimensional IRT models.
Competing interests
The authors declare that they have no competing interests.
Authors’contributions
CZ participated on the study conception, writting, statistical analysis, data interpretation, and revision. CSH participated on writting, data interpretation, and revision. HY participated on statistical analysis, data interpretation and revision. RKH participated on the study conception, writting, statistical analysis, datainterpretation, and revision. All authors read and approved the final manuscript.
Author details
1Department of Psychology, Universidade São Francisco, Alexandre Rodrigues Barbosa Str. 45, Itatiba 13251-900SP, Brazil.2Department of Psychology, Federal University of Rio Grande do Sul, Ramiro Barcelos Str. 2600, Porto Alegre 90035-003, RS, Brazil.3School of Education, University of Massachusets Amherst, Hills South, USA.
Received: 26 November 2015 Accepted: 7 April 2016
References
Bradburn NM. The structure of psychological well being. Chicago: Aldine Publishing; 1969.
Brant SRC, Pilati R, Borges-Andrade JE. Estratégias de aplicação do aprendido: análise baseada em TRI. Psicologia: Reflexão e Crítica. 2015;28(1):01–10. doi:10.1590/1678-7153.201528101.
Carvalho LF, Monteiro RM, Alcará AR, Santos AAA. Aplicação da TRI em uma medida de avaliação da compreensão de leitura. Psicologia: Reflexão e Crítica. 2013;26(1):47–57. doi:10.1590/S0102-79722013000100006. Ebesutani C, Regan J, Smith A, Reise S, Chorpita BF, Higa-McMillan C. The 10-item
positive and negative affect schedule for children, child and parent shortened versions: Application of item response theory for more efficient assessment. J Psychopathol Behav Assess. 2013;34:191–203. doi:10.1007/s10862-011-9273-2. Embretson SE. The new rules of measurement. Psychol Assess. 1996;8(4):341–9.
doi:10.1037/1040-3590.8.4.341.
Embretson SE, Reise SP. Item Response Theory for Psychologists. Mahwah: Lawrence Erlbaum Associates; 2000.
Fordyce MW. Development of a program to increase personal happiness. J Couns Psychol. 1977;24:511–21. doi:10.1037//0022-0167.24.6.511. Gulliksen H. Theories of Mental Test Scores. New York: Wiley; 1950. Hambleton RK. Item response theory: A broad psychometric framework for
measurement advances. Psicothema. 1994;6(3):535–56.
Hambleton RK. Applications of item response theory to improve health outcomes assessment: Developing item banks, linking instruments, and computer-adaptive testing. In: Lipscomb J, Gotay CC, Snyder C, editors. Outcomes Assessment in Cancer: Measures, Methods and Applications. Cambridge: Cambridge University Press; 2005. p. 445–64.
Hambleton RK, Jodoin M. Item response theory: models and features. In: Fernández-Ballesteros R, editor. Encyclopedia of Psychological Assessment. London: Sage; 2003. p. 509–14.
Hambleton RK, Robin F, Xing D. Item response models for the analysis of educational and psychological test data. In: Tinsley HEA, Brown SD, editors. Handbook of Applied Multivariate Statistics and Mathematical Modeling. San Diego: Academic; 2000. p. 553–85.
Hambleton RK, Swaminathan H, Rogers HJ. Fundamentals of Item Response Theory. Thousand Oaks: Sage Publications; 1991.
Hambleton RK, van der Linden WJ, Wells CS. IRT models for the analysis of polytomous scored data: Brief and selected history of model building advances. In: Nering ML, Ostini R, editors. Handbook of Polytomous Item Response Theory Models. New York: Routledge; 2011. p. 21–42. Han KT, Hambleton RK. User’s Manual: WinGen (Center for Educational
Assessment Report no. 642). Amherst: University of Massachusetts, Center for Educational Assessment; 2007.
Hattie J. Methodology review: Assessing unidimensionality of tests and items. Appl Psychol Meas. 1985;9:139–64.
Kammann R, Flett R. A scale to measure current level of general happiness. Aust Psychol. 1983;35(1):259–65.
Keller LA. Item response theory (IRT) models for polytomous response data. In: Everitt BS, Howell DC, editors. Encyclopedia of Statistics in Behavioral Sciences. Chichester: John Wiley & Sons; 2005. p. 990–1003.
Knijnik LF, Giacomoni CH, Zanon C, Stein LM. Avaliação dos subtestes de leitura e escrita do teste de desempenho escolar através da Teoria de Resposta ao Item. Psicologia: Reflexão e Crítica. 2014;27(3):481–90. doi:10.1590/1678-7153. 201427308.
Kose A, Demirtasli NC. Comparison of one-dimensional and multi-dimensional models based on item response theory in terms of Both variables of test sample and length size. Proceeding - Social and Behavioral Sciences. 2012;46: 135–40. doi:10.1016/j.sbspro.2012.05.082.
Liang T, Han KT, Hambleton RK. User’s Guide for ResidPlots-2: Computer Software for IRT Graphical Residual Analyses, Version 2.0 (Center for Educational Assessment Research Report no. 688). Amherst: University of Massachusetts, Center for Educational Assessment; 2008.
Lin TH, Yao G. Evaluating Item Discrimination Power of WHOQOL-BREF from an Item Response Model Perspectives. Soc Indic Res. 2009;91:141–53. doi:10.1007/s11205-008-9273-0.
Lopes J, Bueno M. Construção e validação de uma prova de Matemática para alunos do 1° ao 4° ano de escolaridade. Psicologia: Reflexão e Crítica. 2014; 27(3):434–42. doi:10.1590/1678-7153.201427303.
Lord, F. M. A theory of test scores. Psychometrika 1952; Monograph 7. Lord FM, Novick MR. Statistical Theories of Mental Test Scores. Reading:
Addison-Wesley; 1968.
Lorenzo-Seva U, Timmerman ME, Kiers HAL. The Hull method for selecting the number of common factors. Multivar Behav Res. 2011;46(2):340–64. doi:10.1080/00273171.2011.564527.
Lyubomirsky S, King L, Diener E. The benefits of frequent positive affect: Does happiness lead to success? Psychol Bull. 2005;131(6):803–55. doi:10.1037/0033-2909.131.6.803.
Maydeu-Olivares A. Linear IRT, non-linear IRT, and factor analysis: A unified framework. In: Maydeu-Olivares A, McArdle JJ, editors. Contemporary Psychometrics. A Festschrift to Roderick P. McDonald. Mahwah: Lawrence Erlbaum; 2005. p. 73–100.
Masters GN. A Rasch model for partial credit scoring. Psychometrika. 1982;47(2): 149–74. doi:10.1007/bf02296272.
Miles H, MacLeod AK, Pote H. Retrospective and prospective cognitions in adolescents: Anxiety, depression, and positive and negative affect. J Adolesc. 2004;27(6):691–701. doi:10.1016/j.adolescence.2004.04.001.
Muniz M, Rueda FJM, Nery JCS. Analysis of psychometric properties of the cube test to evaluate visuospatial reasoning. Psicologia: Reflexão e Crítica. 2014; 27(3):504–14. doi:10.1590/1678-7153.201427311.
Muraki E. A generalized partial credit model: Application of an EM algorithm. Appl Psychol Meas. 1992;16(2):159–76. doi:10.1177/014662169201600206. Muraki E, Bock RD. PARSCALE: IRT-Based Test Scoring and Item Analysis for
Graded and Open-Ended Exercises and Performance Tasks. Chicago: Scientific Software International; 1993.
Naragon K, Watson D. Positive affectivity. In: Lopez SJ, editor. Encyclopedia of Positive Psychology, vol. 2. Malden: Wiley-Blackwell; 2009. p. 707–11. Reckase MD. Multidimensional Item Response Theory: Statistics for Social and
Behavioral Sciences. New York: Springer; 2009.
Rupp AA, Zumbo BD. A note on how to quantify and report whether IRT parameter invariance holds: when Pearson correlations are not enough. Educ Psychol Meas. 2004;64(4):588–99. doi:10.1177/0013164403261051.
Samejima F. Estimation of latent ability using a response pattern of graded scores. Psychometrika 1969; Monograph 7.
Trapnell PD, Campbell JD. Private self-consciousness and the five-factor model of personality: distinguishing rumination from reflection. J Pers Soc Psychol. 1999;76(2):284–304. doi:10.1037//0022-3514.76.2.284.
Watson D. Positive affectivity: The disposition to experience pleasurable emotional states. In: Snyder CR, Lopez SJ, editors. Handbook of Positive Psychology. New York: Oxford University Press; 2005. p. 106–19.
Watson D, Clark LA, Tellegen A. Development and validation of brief measures of Positive and Negative Affect: The PANAS Scales. J Pers Soc Psychol. 1988; 54(1):1063–70. doi:10.1037/0022-3514.54.6.1063.
Yu CH, Popp SO, DiGangi S, Jannasch-Pennell A. Assessing unidimensionality: A comparison of Rasch modeling, Parallel Analysis, and TETRAD. Practical Assessment, Evaluation & Research. 2007;12(14):1–19.
Zanon C, Bastianello MR, Pacico JC, Hutz SC. Development and validation of a positive and negative affect scale. Psico-USF. 2013a;18(2):193–202. doi:10.1590/s1413-82712013000200003.
Zanon C, Bastianello MR, Pacico JC, Hutz SC. Relationships between positive and negative affect and the five factors of personality in a Brazilian sample. Paidéia (Ribeirão Preto). 2013b;23(56):285–92. doi:10.1590/1982-43272356201302.
Submit your manuscript to a
journal and benefi t from:
7 Convenient online submission
7 Rigorous peer review
7 Immediate publication on acceptance
7 Open access: articles freely available online
7 High visibility within the fi eld
7 Retaining the copyright to your article